


 |
市場調查報告書
商品編碼
1698570
智慧建築市場機會、成長動力、產業趨勢分析及2025-2034年預測Smart Building Market Opportunity, Growth Drivers, Industry Trend Analysis, and Forecast 2025-2034 |
||||||
2024 年全球智慧建築市場價值為 1,030 億美元,預計 2025 年至 2034 年的複合年成長率為 24.4%。對能源效率、永續性和提高生產力的需求不斷成長,推動了該行業的擴張。 5G、物聯網、人工智慧和進階資料分析的快速應用正在改變市場格局。此外,向建築管理系統即服務的轉變正在進一步加速市場成長。企業和住宅業主擴大投資智慧技術,以最佳化營運、降低成本並遵守不斷變化的法規。政府和監管機構也正在推動能源效率舉措,鼓勵更廣泛地採用智慧建築解決方案。
對能源效率的需求已成為智慧建築業的主要驅動力。隨著減少能源消耗變得越來越重要,物聯網、自動化和能源管理軟體在最佳化能源使用方面發揮著至關重要的作用。人工智慧 HVAC 系統根據入住率和天氣狀況動態調整氣候控制,最大限度地減少能源浪費。更嚴格的監管架構迫使企業整合符合永續發展目標的智慧解決方案。先進的監控系統追蹤能源消耗模式,幫助業主做出明智的決策,提高營運效率。
| 市場範圍 | |
|---|---|
| 起始年份 | 2024 |
| 預測年份 | 2025-2034 |
| 起始值 | 1030億美元 |
| 預測值 | 8277億美元 |
| 複合年成長率 | 24.4% |
人工智慧和物聯網正在透過實現即時資料分析和預測洞察重塑智慧建築的未來。物聯網促進持續監控,而人工智慧則識別低效率並推薦解決方案。智慧系統管理能源使用、水消耗和廢棄物產生,創造更永續的生態系統。人工智慧預測性維護的整合可減少停機時間,防止系統故障發生。基於雲端的平台透過實現關鍵建築功能的無縫自動化進一步提高了效率。
科技驅動的創新不斷改變建築管理,提供更強的控制力、安全性和便利性。人工智慧、物聯網和雲端運算顯著提高了即時監控和自動化水平,使管理員能夠做出數據驅動的決策。預測性維護透過主動解決潛在問題來確保順利運作。隨著這些進步,智慧建築變得越來越有效率、經濟和環保。
旨在保持競爭力的公司優先投資人工智慧驅動的能源管理解決方案。根據即時佔用、天氣狀況和使用趨勢最佳化建築營運的能力至關重要。採用綠建築認證也成為吸引有環保意識的客戶和遵守永續法規的關鍵策略。
市場分為解決方案和服務,其中服務部門預計以 26.6% 的複合年成長率成長。預測性維護服務需求的持續成長是這一成長背後的關鍵因素。解決方案部門的價值到 2023 年將達到 633 億美元,包括能源管理、安全和保全管理、綜合工作場所系統和網路管理。暖通空調控制、照明管理和節水系統等智慧基礎設施解決方案正在受到越來越多的關注。
商業領域將佔據主導地位,到 2024 年將佔據 51.7% 的市場佔有率。受對能源效率日益重視的推動,北美將以 38.7% 的佔有率領先。在美國,2024 年市場價值將達到 306 億美元,企業和屋主擴大採用智慧解決方案來最佳化能源使用並減少碳足跡。
目錄
第1章:方法論與範圍
- 市場範圍和定義
- 基礎估算與計算
- 預測計算
- 資料來源
- 基本的
- 次要
- 付費來源
- 公共資源
第2章:執行摘要
第3章:行業洞察
- 產業生態系統分析
- 影響價值鏈的因素
- 利潤率分析
- 中斷
- 未來展望
- 製造商
- 經銷商
- 供應商格局
- 利潤率分析
- 重要新聞和舉措
- 監管格局
- 衝擊力
- 成長動力
- 能源效率和永續性日益重要
- 智慧建築的技術進步
- 節省成本並提高營運效率
- 政府法規和激勵措施
- 產業陷阱與挑戰
- 網路安全擔憂加劇
- 初期成本高
- 成長動力
- 成長潛力分析
- 波特的分析
- PESTEL分析
第4章:競爭格局
- 介紹
- 公司市佔率分析
- 競爭定位矩陣
- 戰略展望矩陣
第5章:市場估計與預測:依組件,2021-2034
- 主要趨勢
- 解決方案
- 安全與安保管理
- 門禁系統
- 視訊監控系統
- 消防和生命安全系統
- 能源管理
- HVAC控制系統
- 照明管理系統
- 其他
- 建築基礎設施管理
- 停車管理系統
- 水管理系統
- 其他
- 整合工作場所管理系統 (IWMS)
- 房地產管理
- 資本項目管理
- 設施管理
- 營運和服務管理
- 環境與能源管理
- 網管
- 有線技術
- 無線技術
- 安全與安保管理
- 服務
第6章:市場估計與預測:依最終用途,2021-2034
- 主要趨勢
- 住宅
- 商業的
- 衛生保健
- 零售
- 學術的
- 其他
- 工業的
第7章:市場估計與預測:按地區,2021-2034
- 主要趨勢
- 北美洲
- 美國
- 加拿大
- 歐洲
- 英國
- 德國
- 法國
- 瑞典
- 荷蘭
- 俄羅斯
- 亞太地區
- 中國
- 印度
- 日本
- 韓國
- 澳洲
- 拉丁美洲
- 巴西
- 墨西哥
- MEA
- 南非
- 沙烏地阿拉伯
- 阿拉伯聯合大公國
第8章:公司簡介
- ABB
- Azbil corporation
- Cisco
- Hitachi ltd
- Honeywell
- Huawei
- IBM
- Intel Corporation
- legrand
- Microsoft Corporation
- Schneider Electric SE
- Siemens AG
- Johnsons controls
- NEC Corporation
- Nexii Building Solutions Inc
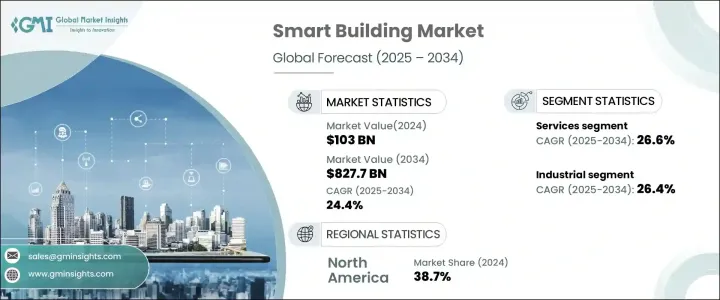
The Global Smart Building Market was valued at USD 103 billion in 2024 and is expected to grow at a CAGR of 24.4% from 2025 to 2034. The expansion of this industry is fueled by the rising demand for energy efficiency, sustainability, and improved productivity. The rapid adoption of 5G, IoT, AI, and advanced data analytics is transforming the market landscape. Additionally, the transition toward building management systems as a service is further accelerating market growth. Businesses and residential property owners are increasingly investing in smart technologies to optimize operations, reduce costs, and comply with evolving regulations. Governments and regulatory bodies are also pushing energy efficiency initiatives, encouraging wider adoption of intelligent building solutions.
The need for energy efficiency has become a major driver of the smart building industry. As energy consumption reduction gains importance, IoT, automation, and energy management software play a crucial role in optimizing energy usage. AI-powered HVAC systems dynamically adjust climate control based on occupancy and weather conditions, minimizing energy waste. Stricter regulatory frameworks are compelling businesses to integrate smart solutions that align with sustainability goals. Advanced monitoring systems track energy consumption patterns, helping property owners make informed decisions that enhance operational efficiency.
| Market Scope | |
|---|---|
| Start Year | 2024 |
| Forecast Year | 2025-2034 |
| Start Value | $103 Billion |
| Forecast Value | $827.7 Billion |
| CAGR | 24.4% |
AI and IoT are reshaping the future of smart buildings by enabling real-time data analysis and predictive insights. IoT facilitates continuous monitoring, while AI identifies inefficiencies and recommends solutions. Smart systems manage energy use, water consumption, and waste production, creating a more sustainable ecosystem. The integration of AI-powered predictive maintenance reduces downtime, preventing system failures before they occur. Cloud-based platforms further enhance efficiency by enabling seamless automation of critical building functions.
Technology-driven innovations continue to transform building management, providing greater control, security, and convenience. AI, IoT, and cloud computing have significantly improved real-time monitoring and automation, allowing administrators to make data-driven decisions. Predictive maintenance ensures smooth operations by proactively addressing potential issues. With these advancements, smart buildings are becoming increasingly efficient, cost-effective, and environmentally friendly.
Companies aiming to stay competitive are prioritizing investments in AI-driven energy management solutions. The ability to optimize building operations based on real-time occupancy, weather conditions, and usage trends is crucial. Adopting green building certifications has also become a key strategy for attracting environmentally conscious clients and complying with sustainability regulations.
The market is segmented into solutions and services, with the services segment projected to grow at a CAGR of 26.6%. The increasing demand for predictive maintenance services is a key factor behind this growth. The solutions segment, valued at USD 63.3 billion in 2023, includes energy management, safety and security management, integrated workplace systems, and network management. Smart infrastructure solutions such as HVAC control, lighting management, and water conservation systems are gaining traction.
The commercial segment is set to dominate, accounting for 51.7% of the market in 2024. North America leads with a 38.7% share, driven by the growing emphasis on energy efficiency. In the United States, the market was valued at USD 30.6 billion in 2024, with businesses and homeowners increasingly adopting smart solutions to optimize energy use and reduce carbon footprints.
Table of Contents
Chapter 1 Methodology & Scope
- 1.1 Market scope & definitions
- 1.2 Base estimates & calculations
- 1.3 Forecast calculations
- 1.4 Data sources
- 1.4.1 Primary
- 1.4.2 Secondary
- 1.4.2.1 Paid sources
- 1.4.2.2 Public sources
Chapter 2 Executive Summary
- 2.1 Industry synopsis, 2021-2034
Chapter 3 Industry Insights
- 3.1 Industry ecosystem analysis
- 3.1.1 Factor affecting the value chain
- 3.1.2 Profit margin analysis
- 3.1.3 Disruptions
- 3.1.4 Future outlook
- 3.1.5 Manufacturers
- 3.1.6 Distributors
- 3.2 Supplier landscape
- 3.3 Profit margin analysis
- 3.4 Key news & initiatives
- 3.5 Regulatory landscape
- 3.6 Impact forces
- 3.6.1 Growth drivers
- 3.6.1.1 Growing importance of energy efficiency and sustainability
- 3.6.1.2 Technological advancement in smart buildings
- 3.6.1.3 Cost savings and operational efficiency
- 3.6.1.4 Government regulations and incentives
- 3.6.2 Industry pitfalls & challenges
- 3.6.2.1 Rising cybersecurity concern
- 3.6.2.2 High initial cost
- 3.6.1 Growth drivers
- 3.7 Growth potential analysis
- 3.8 Porter's analysis
- 3.9 PESTEL analysis
Chapter 4 Competitive Landscape, 2024
- 4.1 Introduction
- 4.2 Company market share analysis
- 4.3 Competitive positioning matrix
- 4.4 Strategic outlook matrix
Chapter 5 Market Estimates & Forecast, By Component, 2021-2034 (USD Billion)
- 5.1 Key trends
- 5.2 Solution
- 5.2.1 Safety & security management
- 5.2.1.1 Access control system
- 5.2.1.2 Video surveillance system
- 5.2.1.3 Fire and life safety system
- 5.2.2 Energy Management
- 5.2.2.1 HVAC control system
- 5.2.2.2 Lighting management system
- 5.2.2.3 Others
- 5.2.3 Building infrastructure management
- 5.2.3.1 Parking management system
- 5.2.3.2 Water management system
- 5.2.3.3 Others
- 5.2.4 Integrated Workplace Management System (IWMS)
- 5.2.4.1 Real estate management
- 5.2.4.2 Capital project management
- 5.2.4.3 Facility management
- 5.2.4.4 Operations and services management
- 5.2.4.5 Environment and energy management
- 5.2.5 Network management
- 5.2.5.1 Wired technology
- 5.2.5.2 Wireless technology
- 5.2.1 Safety & security management
- 5.3 Service
Chapter 6 Market Estimates & Forecast, By End Use, 2021-2034 (USD Billion)
- 6.1 Key trends
- 6.2 Residential
- 6.3 Commercial
- 6.3.1 Healthcare
- 6.3.2 Retail
- 6.3.3 Academic
- 6.3.4 Others
- 6.4 Industrial
Chapter 7 Market Estimates & Forecast, By Region, 2021-2034 (USD Billion)
- 7.1 Key trends
- 7.2 North America
- 7.2.1 U.S.
- 7.2.2 Canada
- 7.3 Europe
- 7.3.1 UK
- 7.3.2 Germany
- 7.3.3 France
- 7.3.4 Sweden
- 7.3.5 Netherlands
- 7.3.6 Russia
- 7.4 Asia Pacific
- 7.4.1 China
- 7.4.2 India
- 7.4.3 Japan
- 7.4.4 South Korea
- 7.4.5 Australia
- 7.5 Latin America
- 7.5.1 Brazil
- 7.5.2 Mexico
- 7.6 MEA
- 7.6.1 South Africa
- 7.6.2 Saudi Arabia
- 7.6.3 UAE
Chapter 8 Company Profiles
- 8.1 ABB
- 8.2 Azbil corporation
- 8.3 Cisco
- 8.4 Hitachi ltd
- 8.5 Honeywell
- 8.6 Huawei
- 8.7 IBM
- 8.8 Intel Corporation
- 8.9 legrand
- 8.10 Microsoft Corporation
- 8.11 Schneider Electric SE
- 8.12 Siemens AG
- 8.13 Johnsons controls
- 8.14 NEC Corporation
- 8.15 Nexii Building Solutions Inc
 2025年建築能源模擬軟體全球市場報告
 智慧建築市場:按組件、建築類型、連接性、應用和部署 - 2025-2030 年全球預測智慧外牆市場 - 全球產業規模、佔有率、趨勢、機會和預測,按材料類型、技術、應用、地區、競爭細分,2020-2030 年預測
 智慧建築市場規模、佔有率及成長分析(按組件、解決方案、建築類型和地區)-2025-2032 年產業預測
 智慧建築:市場佔有率分析、產業趨勢與統計、成長預測(2025-2030 年)
 智慧商業建築中的物聯網設備(2025-2030)- 設備預測、採用、元趨勢分析2025年智慧建築(非住宅建築)全球市場報告2025 年全球辦公大樓市場報告
 智慧建築市場分析:年度訂閱
 智慧建築的Start-Ups(2025年):M&A,投資,引人注目的亞太地區的新興企業