


 |
市場調查報告書
商品編碼
1167122
中國LNG(液化天然氣)進口分析(2023-2032)Research Report on China's Liquefied Natural Gas (LNG) Import 2023-2032 |
||||||
液化天然氣 (LNG) 的體積約為氣體的六分之一,被公認為地球上最清潔的化石能源之一。 隨著全球經濟逐步走向低碳化和環保化,近年來LNG市場規模迅速擴大。 由於自身的液化天然氣儲備不足,中國每年不得不進口大量的液化天然氣。
示例視圖
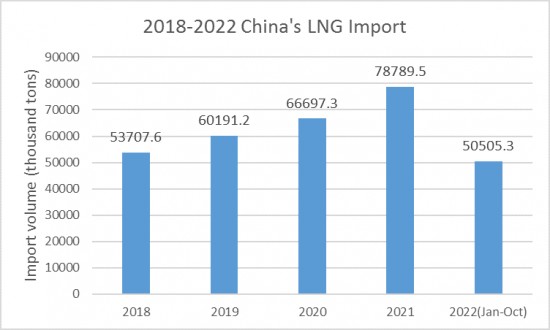
2021年,中國液化天然氣進口量將達到787.95萬噸(同比增長18.13%),進口額為440.75億美元(同比增長89.64%)。 受新型冠狀病毒病(COVID-19)疫情影響,2022年1-10月,中國液化天然氣進口量將下降至5050.53萬噸(同比下降21.60%),進口額為408.17億美元(同比增長34.28%)。
中國的液化天然氣進口平均價格持續下降,從 2018 年的 499.09 美元/噸下降到 2020 年的 348.47 美元/噸。 2020-2022年將繼續上漲,2021年LNG進口均價為559.41美元/噸(較上年上漲60.53%)。 2022年1-10月,中國LNG進口均價為808.17美元/噸,同比上漲71.26%。
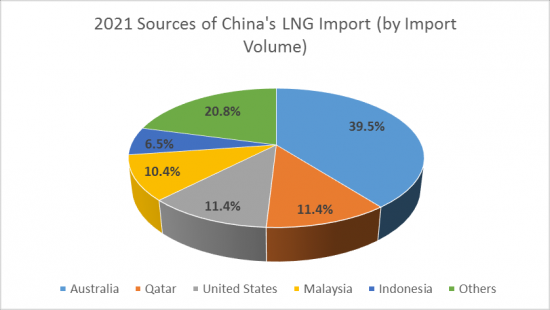
2021年,中國將從27個國家進口液化天然氣。 從數量上看,澳大利亞、卡塔爾、美國、馬來西亞和印度尼西亞是中國LNG進口的主要來源地。 澳大利亞是中國最大的液化天然氣進口來源國,2021年進口3110.24萬噸(佔進口總量的39.48%),價值163.01億美元(佔進口總量的36.98%)。
由於中國對清潔能源的投資正在增加,而國內液化天然氣生產增長潛力有限,預計從 2023 年到 2032 年,中國的液化天然氣進口量將繼續增加。
本報告分析了中國液化天然氣 (LNG) 進口市場,包括總體進口量和進口額、主要進口來源地(2018-2022 年)、按類型分類的詳細趨勢、進口我們將編制和發布價格趨勢、主要進口等信息市場驅動和製約因素,主要公司概況和戰略,以及未來進口趨勢展望(2023-2032)。
內容
第一章中國LNG進口分析(2018-2022年)
- 中國液化天然氣進口規模
- 中國液化天然氣進口量
- 中國的液化天然氣進口值
- 中國液化天然氣進口價格
- 中國液化天然氣表觀消費量
- 中國對液化天然氣進口的依賴
- 中國主要的液化天然氣進口商
- 進口量
- 進口價值
第2章中國液化天然氣進口分析:長期合同(LTAs)(2018-2022)
- 進口量
- 進口價值
- 進口價格
- 進口商
- 進口量
- 進口價值
第3章中國LNG進口分析:短期合同/現貨(2018-2022)
第四章中國主要進口來源地分析(2018-2022年)
- 澳大利亞
- 卡塔爾
- 美國
- 馬來西亞
- 印度尼西亞
- 其他進口來源
第5章中國LNG進口展望(2023-2032年)
- 影響中國液化天然氣進口的因素
- 有利因素
- 不利因素
- 中國 LNG 進口預測 (2023-2032)
- 進口量預測
- 進口量預測:按主要進口來源
Liquefied Natural Gas (LNG) is recognized as one of the cleanest fossil energy sources on the planet, with a volume of about one six hundredth of its gaseous form. With the global economy gradually moving towards low-carbon and environmental protection, the LNG market size has grown rapidly in recent years. China has insufficient local LNG reserves and therefore needs to import a large amount of LNG every year.
SAMPLE VIEW
In 2021, China's LNG imports reached 78,789,500 tons, up 18.13% year-on-year, with an import value of US$44.075 billion, up 89.64% year-on-year. According to CRI's analysis, from January to October 2022, China imported 50,505,300 tons of LNG, down 21.60% year-on-year, and imported US$40.817 billion, up 34.28% year-on-year, due to the COVID-19 outbreak.
CRI analysis, from 2018-2022, the average price of China's LNG imports generally shows a decreasing trend followed by an increasing trend. From 2018-2020, the average price of China's LNG imports decreases continuously, from US$499.09 per ton in 2018 to US$348.47 per ton in 2020. From 2020-2022, the average price of China's LNG imports increases continuously. In 2021, the average price of China's LNG imports is US$559.41 per ton, an increase of 60.53% y-o-y. In January-October 2022, the average price of China's LNG imports is US$808.17 per ton, an increase of 71.26% y-o-y.
In 2021, China imports LNG from a total of 27 countries. CRI analysis shows that by import volume, Australia, Qatar, the US, Malaysia and Indonesia are the main sources of LNG imports into China. Australia is the largest Chinese LNG importer, and in 2021, China imports 31,102,400 tons of LNG, accounting for 39.48% of total LNG imports in that year, with an import value of US$16,301 million, or 36.98% of total imports.
With China's investment in clean energy on the rise and limited room for growth in domestic LNG production, CRI expects China's LNG imports to continue to rise over the 2023-2032 period.
Topics covered:
- China's LNG Import Status and Major Sources in 2018-2022
- What is the Impact of COVID-19 on China's LNG Import?
- Which Companies are the Major Players in China's LNG Import Market and What are their Competitive Benchmarks?
- Key Drivers and Market Opportunities in China's LNG Import
- What are the Key Drivers, Challenges, and Opportunities for China's LNG Import during 2023-2032?
- What is the Expected Revenue of China's LNG Import during 2023-2032?
- What are the Strategies Adopted by the Key Players in the Market to Increase Their Market Share in the Industry?
- What are the Competitive Advantages of the Major Players in China's LNG Import Market?
- Which Segment of China's LNG Import is Expected to Dominate the Market in 2032?
- What are the Major Adverse Factors Facing China's LNG Import?
Table of Contents
1. 2018-2022 China's LNG Import Analysis
- 1.1. China's LNG Import Scale
- 1.1.1. China's LNG Import Volume
- 1.1.2. China's LNG Import Value
- 1.1.3. China LNG Import Price
- 1.1.4. China's Apparent LNG Consumption
- 1.1.5. China's LNG Import Dependence
- 1.2. China's Main Sources of LNG Imports
- 1.2.1. By Import Volume
- 1.2.2. By Import Value
2. 2018-2022 China LNG Import Analysis by LTA
- 2.1. Import Volume
- 2.2 Import Value
- 2.3. Import Price
- 2.4. Import Sources
- 2.4.1. By Import Volume
- 2.4.2. By Import Value
3. 2018-2022 China Short Contract/Spot LNG Import Analysis
- 3.1. Import Volume
- 3.2. Import Value
- 3.3. Import Price
- 3.4 Import Sources
- 3.4.1. By Import Volume
- 3.4.2. By Import Value
4. 2018-2022 China's Main Import Sources Analysis
- 4.1. Australia
- 4.2. Qatar
- 4.3. United States
- 4.4. Malaysia
- 4.5. Indonesia
- 4.6. Other Import Sources
5. China's LNG Import Outlook 2023-2032
- 5.1 Factors Affecting China's LNG Imports
- 5.1.1 Favorable Factors
- 5.1.2. Unfavorable Factors
- 5.2. China's LNG Import Forecast, 2023-2032
- 5.2.1 Import Volume Forecast
- 5.2.2. Forecast of Major Import Sources
 2024-2032 年按技術(液化、再氣化)、最終用途產業(住宅、商業、工業)及地區分類的規劃液化天然氣市場
 C 型儲罐市場規模和預測、全球和區域佔有率、趨勢和成長機會分析報告範圍:按儲罐類型、應用、最終用戶和地理位置
 亞太生物液化天然氣市場:分析與預測(2023-2032)
 歐洲生物液化天然氣市場-分析與預測(2023-2032)
 2024年液化天然氣壓縮機全球市場報告
 生物液化天然氣市場:按來源類型、應用分類 - 2024-2030 年全球預測
 液化天然氣市場:按類型、應用分類 - 2024-2030 年全球預測
 2024 年液化天然氣全球市場報告
 液化天然氣卡車的全球市場(2024年版):金額、數量、卡車類型、重量類型、應用、地區、國家、市場分析、考察進行分析(2019-2029)
 LNG長期契約動向的檢討分析:各地區,各契約,各企業,2022年