


 |
市場調查報告書
商品編碼
1729668
電視網路市場:依服務、收益模式和地區分類Television Network Market, By Service, By Revenue Model, By Geography |
||||||
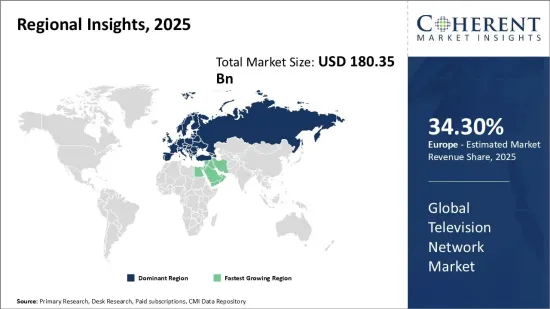
預計 2025 年全球電視網路市場規模將達到 1,803.5 億美元,到 2032 年將達到 2,765.9 億美元,2025 年至 2032 年的年複合成長率(CAGR)為 6.3%。
| 報告範圍 | 報告詳細資訊 | ||
|---|---|---|---|
| 基準年 | 2024 | 2025年的市場規模 | 1803.5億美元 |
| 效能數據 | 從2020年到2024年 | 預測期 | 2025年至2032年 |
| 預測期:2025-2032年複合年成長率: | 6.30% | 2032年價值預測 | 2765.9億美元 |
過去幾十年來,受娛樂和資訊內容需求不斷成長的推動,全球電視網路市場穩步成長。電視是最受歡迎且消費範圍最廣的媒體之一,不僅對個人觀眾如此,對廣告商也是如此。全球領先的廣播公司繼續大力投資開發高品質節目,同時擴展其分發基礎設施,以便在多個平台和設備上提供內容。科技創新使得觀眾除了傳統電視外,還可以透過任何螢幕(包括智慧型手機、平板電腦和筆記型電腦)觀看直播電視和隨選視訊。這導致全球媒體消費的增加。
市場動態:
全球電視網路市場的成長受到觀眾對多樣化內容的強烈需求、全球網際網路普及率的提高以及智慧互聯設備的出現所推動。然而,由於觀眾越來越青睞線上串流媒體而非傳統付費電視,有線電視用戶「剪線」現像日益嚴重,加上數媒體播放機的競爭日益激烈,這些因素都有可能擾亂市場。同時,電視廣播公司正在擴大其在Over-The-Top(OTT) 平台上的業務,並利用與通訊業者合作提供全面服務的機會。人工智慧、虛擬實境和區塊鏈等領域的進步也為未來改善電視觀看體驗提供了潛力。
本研究的主要特點
本報告對全球電視網路市場進行了詳細分析,並以 2024 年為基準年,給出了預測期(2025-2032 年)的市場規模和年複合成長率(CAGR%)。
它還強調了各個領域的潛在商機,並說明了該市場有吸引力的投資提案矩陣。
它還提供了有關市場促進因素、限制因素、機會、新產品發布和核准、市場趨勢、區域前景和主要企業採用的競爭策略的重要見解。
全球電視網路市場的主要企業是根據公司亮點、產品系列、關鍵亮點、財務績效和策略等參數進行的分析。
本報告的見解將使負責人和公司經營團隊能夠就未來的產品發布、類型升級、市場擴張和行銷策略做出明智的決策。
本研究報告針對該產業的各個相關人員,包括投資者、供應商、產品製造商、經銷商、新進業者和財務分析師。
相關人員將透過用於分析全球電視網路市場的各種策略矩陣更輕鬆地做出決策。
目錄
第1章 調查目的與前提條件
- 研究目標
- 先決條件
- 簡稱
第2章 市場展望
- 報告描述
- 市場定義和範圍
- 執行摘要
第3章市場動態、法規與趨勢分析
- 市場動態
- 影響分析
- 主要亮點
- 監管情景
- 產品發布/核准
- PEST分析
- 波特分析
- 市場機會
- 監管情景
- 主要進展
- 產業趨勢
4. 2020-2032 年全球電視網路市場(按服務分類)
- 直接廣播衛星(DBS)服務
- 有線電視和其他付費服務
- 訂閱頻道服務
- 衛星主天線系統服務(SMATV)
- 多點分佈系統服務(MDS)
- 閉路電視(監視錄影機)
5. 2020-2032 年全球電視網路市場收益模式
- 訂閱
- 廣告
6. 2020-2032 年全球電視網路市場(按地區)
- 北美洲
- 美國
- 加拿大
- 拉丁美洲
- 巴西
- 阿根廷
- 墨西哥
- 其他拉丁美洲
- 歐洲
- 德國
- 英國
- 西班牙
- 法國
- 義大利
- 俄羅斯
- 其他歐洲國家
- 亞太地區
- 中國
- 印度
- 日本
- 澳洲
- 韓國
- ASEAN
- 其他亞太地區
- 中東
- 海灣合作理事會國家
- 以色列
- 其他中東地區
- 非洲
- 南非
- 北非
- 中部非洲
第7章 競爭態勢
- Samsung Electronics
- LG Display
- Sony Corporation
- Hisense Group
- Foxconn Technology Group
- Dixon Technologies
- Kathrein-Werke KG
- Comcast Corporation
- The Walt Disney Company
- Warner Bros. Discovery
- Netflix Inc.
- Paramount Global
- Apple Inc.
- AT&T Inc.
- Charter Communications
第 8 章分析師建議
- 命運之輪
- 分析師觀點
- 一致的機會圖
第9章參考文獻與調查方法
- 參考
- 調查方法
- 關於出版商
Global Television Network Market is estimated to be valued at USD 180.35 Bn in 2025 and is expected to reach USD 276.59 Bn by 2032, growing at a compound annual growth rate (CAGR) of 6.3% from 2025 to 2032.
| Report Coverage | Report Details | ||
|---|---|---|---|
| Base Year: | 2024 | Market Size in 2025: | USD 180.35 Bn |
| Historical Data for: | 2020 To 2024 | Forecast Period: | 2025 To 2032 |
| Forecast Period 2025 to 2032 CAGR: | 6.30% | 2032 Value Projection: | USD 276.59 Bn |
The global television network market has been growing steadily over the past few decades driven by rising demand for entertainment and information content. Television remains one of the most popular and widely used media for both individual viewers as well as advertisers. Major broadcasters across the world continue to invest heavily in developing high quality programming as well as expanding their distribution infrastructure to deliver content across various platforms and devices. Innovation in technology has enabled viewers to access live television and on-demand video on any screen of their choice including smartphones, tablets, and laptops besides traditional television sets. This has boosted media consumption globally.
Market Dynamics:
The global television network market growth is driven by strong demand for diversified content from viewers, growing internet penetration worldwide, and advent of smart connected devices. However, factors such as rising cord-cutting trend wherein viewers prefer online streaming over conventional pay television and increasing competition from digital media players threatens to disrupt the market. Meanwhile, television broadcasters are capitalizing on opportunities to expand their over-the-top (OTT) platform presence and partnerships with telecom operators to deliver integrated services. Advancements in areas such as artificial intelligence, virtual reality and Blockchain also offer potential to enhance television viewing experience going forward.
Key Features of the Study:
This report provides in-depth analysis of the global television network market, and provides market size (US$ Billion) and compound annual growth rate (CAGR%) for the forecast period (2025-2032), considering 2024 as the base year
It elucidates potential revenue opportunities across different segments and explains attractive investment proposition matrices for this market
This study also provides key insights about market drivers, restraints, opportunities, new product launches or approvals, market trends, regional outlook, and competitive strategies adopted by key players
It profiles key players in the global television network market based on the following parameters - company highlights, products portfolio, key highlights, financial performance, and strategies
Key companies covered as a part of this study include Samsung Electronics, LG Display, Sony Corporation, Hisense Group, Foxconn Technology Group, Dixon Technologies, Kathrein-Werke KG, Comcast Corporation, The Walt Disney Company, Warner Bros. Discovery, Netflix Inc., Paramount Global, Apple Inc., AT&T Inc., and Charter Communications
Insights from this report would allow marketers and the management authorities of the companies to make informed decisions regarding their future product launches, type up-gradation, market expansion, and marketing tactics
The global television network market report caters to various stakeholders in this industry including investors, suppliers, product manufacturers, distributors, new entrants, and financial analysts
Stakeholders would have ease in decision-making through various strategy matrices used in analyzing the global television network market
Market Segmentation
- Service Insights (Revenue, USD Bn, 2020 - 2032)
- Direct Broadcast Satellite (DBS) Services
- Cable and Other Pay Services
- Subscription Channel Services
- Satellite Master Antenna Systems Services (SMATV)
- Multipoint Distribution System Services (MDS)
- Closed Circuit Television Circuits
- Revenue Model Insights (Revenue, USD Bn, 2020 - 2032)
- Subscription
- Advertisement
- Regional Insights (Revenue, USD Bn, 2020 - 2032)
- North America
- U.S.
- Canada
- Latin America
- Brazil
- Argentina
- Mexico
- Rest of Latin America
- Europe
- Germany
- U.K.
- Spain
- France
- Italy
- Russia
- Rest of Europe
- Asia Pacific
- China
- India
- Japan
- Australia
- South Korea
- ASEAN
- Rest of Asia Pacific
- Middle East
- GCC Countries
- Israel
- Rest of Middle East
- Africa
- South Africa
- North Africa
- Central Africa
- Company Profiles:
- Samsung Electronics
- LG Display
- Sony Corporation
- Hisense Group
- Foxconn Technology Group
- Dixon Technologies
- Kathrein-Werke KG
- Comcast Corporation
- The Walt Disney Company
- Warner Bros. Discovery
- Netflix Inc.
- Paramount Global
- Apple Inc.
- AT&T Inc.
- Charter Communications
Table of Contents
1. Research Objectives and Assumptions
- Research Objectives
- Assumptions
- Abbreviations
2. Market Purview
- Report Description
- Market Definition and Scope
- Executive Summary
- Global Television Network Market, By Service
- Global Television Network Market, By Revenue Model
- Global Television Network Market, By Region
3. Market Dynamics, Regulations, and Trends Analysis
- Market Dynamics
- Impact Analysis
- Key Highlights
- Regulatory Scenario
- Product Launches/Approvals
- PEST Analysis
- PORTER's Analysis
- Market Opportunities
- Regulatory Scenario
- Key Developments
- Industry Trends
4. Global Television Network Market, By Service, 2020-2032, (USD Bn)
- Introduction
- Market Share Analysis, 2025 and 2032 (%)
- Y-o-Y Growth Analysis, 2021 - 2032
- Segment Trends
- Direct Broadcast Satellite (DBS) Services
- Introduction
- Market Size and Forecast, and Y-o-Y Growth, 2020-2032, (USD Bn)
- Cable and Other Pay Services
- Introduction
- Market Size and Forecast, and Y-o-Y Growth, 2020-2032, (USD Bn)
- Subscription Channel Services
- Introduction
- Market Size and Forecast, and Y-o-Y Growth, 2020-2032, (USD Bn)
- Satellite Master Antenna Systems Services (SMATV)
- Introduction
- Market Size and Forecast, and Y-o-Y Growth, 2020-2032, (USD Bn)
- Multipoint Distribution System Services (MDS)
- Introduction
- Market Size and Forecast, and Y-o-Y Growth, 2020-2032, (USD Bn)
- Closed Circuit Television Circuits
- Introduction
- Market Size and Forecast, and Y-o-Y Growth, 2020-2032, (USD Bn)
5. Global Television Network Market, By Revenue Model, 2020-2032, (USD Bn)
- Introduction
- Market Share Analysis, 2025 and 2032 (%)
- Y-o-Y Growth Analysis, 2021 - 2032
- Segment Trends
- Subscription
- Introduction
- Market Size and Forecast, and Y-o-Y Growth, 2020-2032, (USD Bn)
- Advertisement
- Introduction
- Market Size and Forecast, and Y-o-Y Growth, 2020-2032, (USD Bn)
6. Global Television Network Market, By Region, 2020 - 2032, Value (USD Bn)
- Introduction
- Market Share (%) Analysis, 2025, 2028 & 2032, Value (USD Bn)
- Market Y-o-Y Growth Analysis (%), 2021 - 2032, Value (USD Bn)
- Regional Trends
- North America
- Introduction
- Market Size and Forecast, By Service, 2020 - 2032, Value (USD Bn)
- Market Size and Forecast, By Revenue Model, 2020 - 2032, Value (USD Bn)
- Market Size and Forecast, By Country, 2020 - 2032, Value (USD Bn)
- U.S.
- Canada
- Latin America
- Introduction
- Market Size and Forecast, By Service, 2020 - 2032, Value (USD Bn)
- Market Size and Forecast, By Revenue Model, 2020 - 2032, Value (USD Bn)
- Market Size and Forecast, By Country, 2020 - 2032, Value (USD Bn)
- Brazil
- Argentina
- Mexico
- Rest of Latin America
- Europe
- Introduction
- Market Size and Forecast, By Service, 2020 - 2032, Value (USD Bn)
- Market Size and Forecast, By Revenue Model, 2020 - 2032, Value (USD Bn)
- Market Size and Forecast, By Country, 2020 - 2032, Value (USD Bn)
- Germany
- U.K.
- Spain
- France
- Italy
- Russia
- Rest of Europe
- Asia Pacific
- Introduction
- Market Size and Forecast, By Service, 2020 - 2032, Value (USD Bn)
- Market Size and Forecast, By Revenue Model, 2020 - 2032, Value (USD Bn)
- Market Size and Forecast, By Country, 2020 - 2032, Value (USD Bn)
- China
- India
- Japan
- Australia
- South Korea
- ASEAN
- Rest of Asia Pacific
- Middle East
- Introduction
- Market Size and Forecast, By Service, 2020 - 2032, Value (USD Bn)
- Market Size and Forecast, By Revenue Model, 2020 - 2032, Value (USD Bn)
- Market Size and Forecast, By Country, 2020 - 2032, Value (USD Bn)
- GCC Countries
- Israel
- Rest of Middle East
- Africa
- Introduction
- Market Size and Forecast, By Service, 2020 - 2032, Value (USD Bn)
- Market Size and Forecast, By Revenue Model, 2020 - 2032, Value (USD Bn)
- Market Size and Forecast, By Country/Region, 2020 - 2032, Value (USD Bn)
- South Africa
- North Africa
- Central Africa
7. Competitive Landscape
- Samsung Electronics
- Company Highlights
- Product Portfolio
- Key Developments
- Financial Performance
- Strategies
- LG Display
- Company Highlights
- Product Portfolio
- Key Developments
- Financial Performance
- Strategies
- Sony Corporation
- Company Highlights
- Product Portfolio
- Key Developments
- Financial Performance
- Strategies
- Hisense Group
- Company Highlights
- Product Portfolio
- Key Developments
- Financial Performance
- Strategies
- Foxconn Technology Group
- Company Highlights
- Product Portfolio
- Key Developments
- Financial Performance
- Strategies
- Dixon Technologies
- Company Highlights
- Product Portfolio
- Key Developments
- Financial Performance
- Strategies
- Kathrein-Werke KG
- Company Highlights
- Product Portfolio
- Key Developments
- Financial Performance
- Strategies
- Comcast Corporation
- Company Highlights
- Product Portfolio
- Key Developments
- Financial Performance
- Strategies
- The Walt Disney Company
- Company Highlights
- Product Portfolio
- Key Developments
- Financial Performance
- Strategies
- Warner Bros. Discovery
- Company Highlights
- Product Portfolio
- Key Developments
- Financial Performance
- Strategies
- Netflix Inc.
- Company Highlights
- Product Portfolio
- Key Developments
- Financial Performance
- Strategies
- Paramount Global
- Company Highlights
- Product Portfolio
- Key Developments
- Financial Performance
- Strategies
- Apple Inc.
- Company Highlights
- Product Portfolio
- Key Developments
- Financial Performance
- Strategies
- AT&T Inc.
- Company Highlights
- Product Portfolio
- Key Developments
- Financial Performance
- Strategies
- Charter Communications
- Company Highlights
- Product Portfolio
- Key Developments
- Financial Performance
- Strategies
8. Analyst Recommendations
- Wheel of Fortune
- Analyst View
- Coherent Opportunity Map
9. References and Research Methodology
- References
- Research Methodology
- About us
 2026年全球廣播圖形系統市場報告2026年全球電視網路市場報告
 電視服務市場報告:按分發平台、收入模式、廣播公司類型和地區分類(2026-2034 年)
 全球ATSC 3.0設備市場規模、佔有率、趨勢和成長分析報告(2026-2034年)