


 |
市場調查報告書
商品編碼
1699465
按顯示類型、應用程式和地區分類的數位互動服務市場Digital Interactive Service Market, By Display Type, By Application, By Geography |
||||||
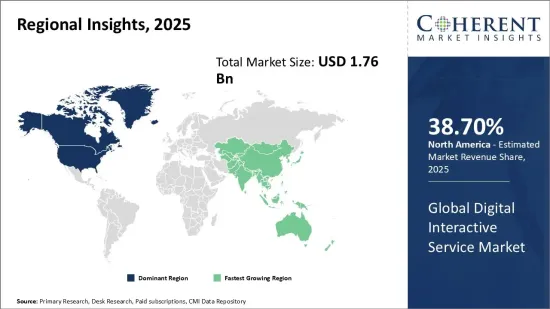
預計 2025 年全球數位互動服務市場規模將達到 17.6 億美元,到 2032 年將達到 26.8 億美元,2025 年至 2032 年的年複合成長率(CAGR)為 6.2%。
| 報告範圍 | 報告詳細資訊 | ||
|---|---|---|---|
| 基準年 | 2024 | 2025年的市場規模 | 17.6億美元 |
| 效能數據 | 從2020年到2024年 | 預測期 | 2025年至2032年 |
| 預測期:2025-2032年複合年成長率: | 6.20% | 2032年價值預測 | 26.8億美元 |
各行各業的數位化和自動化趨勢正在推動透過數位平台提供的互動式服務的採用率不斷提高。我們的互動服務讓您能夠進行互動交流並獲得客製化的個人化體驗。人工智慧、物聯網、雲端和分析等技術的進步使服務供應商能夠為用戶提供高度客製化和引人入勝的數位體驗。網路和智慧型手機普及率的提高以及消費者對數位和自動化服務的偏好的改變是推動全球數位互動服務市場向前發展的一些關鍵因素。然而,與數位資料的收集和使用相關的安全和隱私問題可能會在一定程度上抑制市場成長。
市場動態:
推動全球數位互動服務市場成長的關鍵因素包括各行業數位化和自動化趨勢的不斷成長、網際網路和智慧型手機普及率的提高以及消費者對數位服務的偏好的改變。然而,與數位資料的收集和使用相關的資料隱私和安全問題給市場帶來了重大挑戰。然而,人工智慧、區塊鏈、擴增實境(AR) 和虛擬實境 (VR) 等新興技術的發展預計將在未來幾年為服務供應商創造新的機會。教育、醫療保健、電子商務、BFSI、製造、媒體和娛樂等領域對數位互動式服務的採用正在增加。基於視訊和音訊的互動式工具的日益普及也推動了市場的成長。然而,這些服務的高實施和維護成本是一個障礙,尤其是在新興市場。
本研究的主要特點
本報告對全球數位互動服務市場進行了詳細分析,並以 2024 年為基準年,展示了預測期(2025-2032 年)的市場規模和年複合成長率(CAGR%)。
它還強調了各個領域的潛在商機,並說明了該市場的有吸引力的投資提案矩陣。
它還提供了有關市場促進因素、限制因素、機會、新產品發布和核准、市場趨勢、區域前景和主要企業採用的競爭策略的重要見解。
全球數位互動服務市場的主要企業是根據公司亮點、產品系列、關鍵亮點、績效和策略等參數進行的分析。
主要企業包括三星電子、LG 電子、微軟公司、Google有限責任公司、夏普公司、明基電通公司、Elo Touch Solutions、NEC Display Solutions、優派公司、SMART Technologies、Promethean World、富視覺公司、松下公司、思科系統公司和宏碁公司。
本報告的見解將使負責人和公司經營團隊能夠就未來的產品發布、類型升級、市場擴張和行銷策略做出明智的決策。
本研究報告針對該產業的各個相關人員,包括投資者、供應商、產品製造商、經銷商、新進業者和財務分析師。
相關人員可以透過用於分析全球數位互動服務市場的各種策略矩陣更輕鬆地做出決策。
目錄
第1章 調查目的與前提條件
- 研究目標
- 先決條件
- 簡稱
第2章 市場展望
- 報告描述
- 市場定義和範圍
- 執行摘要
第3章市場動態、法規與趨勢分析
- 市場動態
- 影響分析
- 主要亮點
- 監管情景
- 產品發布/核准
- PEST分析
- 波特分析
- 市場機會
- 監管情景
- 主要進展
- 產業趨勢
4. 2020 年至 2032 年全球數位互動服務市場(按顯示類型)
- 互動式自助服務終端
- 互動式電視牆
- 互動桌
- 互動式監視器
- 互動式白板
5. 2020 年至 2032 年全球數位互動服務市場(按應用分類)
- 零售
- 飯店業
- 衛生保健
- 運輸
- 銀行、金融服務和保險(BFSI)
- 企業
- 娛樂
- 教育
6. 2020 年至 2032 年全球數位互動服務市場(按地區)
- 北美洲
- 拉丁美洲
- 歐洲
- 亞太地區
- 中東
- 非洲
第7章競爭格局
- Samsung Electronics
- LG Electronics
- Microsoft Corporation
- Google LLC
- Sharp Corporation
- BenQ Corporation
- Elo Touch Solutions
- NEC Display Solutions
- ViewSonic Corporation
- SMART Technologies
- Promethean World
- InFocus Corporation
- Panasonic Corporation
- Cisco Systems, Inc.
- Acer Inc.
第 8 章分析師建議
- 命運之輪
- 分析師觀點
- 一致的機會圖
第9章參考文獻與調查方法
- 參考
- 調查方法
- 關於出版商
Global Digital Interactive Service Market is estimated to be valued at US$ 1.76 Bn in 2025 and is expected to reach US$ 2.68 Bn by 2032, growing at a compound annual growth rate (CAGR) of 6.2% from 2025 to 2032.
| Report Coverage | Report Details | ||
|---|---|---|---|
| Base Year: | 2024 | Market Size in 2025: | USD 1.76 Bn |
| Historical Data for: | 2020 To 2024 | Forecast Period: | 2025 To 2032 |
| Forecast Period 2025 to 2032 CAGR: | 6.20% | 2032 Value Projection: | USD 2.68 Bn |
Digitalization and automation trends across various industry verticals have increased the adoption of interactive services which are offered through digital platforms. Interactive services allow users to engage in two-way communication and receive customized and personalized experience. Advancements in technologies, such as AI, IoT, cloud, and analytics, have enabled service providers to offer highly customized and engaging digital experiences to users. The growth of internet and smartphone penetration coupled with changing consumer preferences for digital and automated services are some of the key factors driving the global digital interactive service market forward. However, security and privacy concerns associated with digital data collection and usage may restrain the market growth to a certain extent.
Market Dynamics:
The key drivers propelling the growth of the global digital interactive service market include growing digitization and automation trends across industries, rising internet and smartphone penetration, and changing consumer preferences towards digital services. However, data privacy and security concerns associated with digital data collection and usage pose as major challenges for the market. But development of advanced technologies such as AI, Blockchain, augmented reality, and virtual reality are expected to create new opportunities for service providers in the coming years. Adoption of digital interactive services is increasing across sectors like education, healthcare, e-commerce, BFSI, manufacturing, media, and entertainment, among others. Rising popularity of video and audio based interactive tools is another factor boosting the market growth. However, high implementation and maintenance costs associated with these services hamper the market particularly in under developed regions.
Key Features of the Study:
This report provides in-depth analysis of the global digital interactive service market, and provides market size (US$ Billion) and compound annual growth rate (CAGR%) for the forecast period (2025-2032), considering 2024 as the base year
It elucidates potential revenue opportunities across different segments and explains attractive investment proposition matrices for this market
This study also provides key insights about market drivers, restraints, opportunities, new product launches or approvals, market trends, regional outlook, and competitive strategies adopted by key players
It profiles key players in the global digital interactive service market based on the following parameters - company highlights, products portfolio, key highlights, financial performance, and strategies
Key companies covered as a part of this study include Samsung Electronics, LG Electronics, Microsoft Corporation, Google LLC, Sharp Corporation, BenQ Corporation, Elo Touch Solutions, NEC Display Solutions, ViewSonic Corporation, SMART Technologies, Promethean World, InFocus Corporation, Panasonic Corporation, Cisco Systems, Inc., and Acer Inc.
Insights from this report would allow marketers and the management authorities of the companies to make informed decisions regarding their future product launches, type up-gradation, market expansion, and marketing tactics
The global digital interactive service market report caters to various stakeholders in this industry including investors, suppliers, product manufacturers, distributors, new entrants, and financial analysts
Stakeholders would have ease in decision-making through various strategy matrices used in analyzing the global digital interactive service market
Market Segmentation
- Display Type Insights (Revenue, USD Bn, 2020 - 2032)
- Interactive Kiosk
- Interactive Video Wall
- Interactive Table
- Interactive Monitor
- Interactive Whiteboard
- Application Insights (Revenue, USD Bn, 2020 - 2032)
- Retail
- Hospitality
- Healthcare
- Transportation
- Banking, Financial Services, and Insurance (BFSI)
- Corporate
- Entertainment
- Education
- Regional Insights (Revenue, USD Bn, 2020 - 2032)
- North America
- U.S.
- Canada
- Latin America
- Brazil
- Argentina
- Mexico
- Rest of Latin America
- Europe
- Germany
- U.K.
- Spain
- France
- Italy
- Russia
- Rest of Europe
- Asia Pacific
- China
- India
- Japan
- Australia
- South Korea
- ASEAN
- Rest of Asia Pacific
- Middle East
- GCC Countries
- Israel
- Rest of Middle East
- Africa
- South Africa
- North Africa
- Central Africa
- Key Players Insights
- Samsung Electronics
- LG Electronics
- Microsoft Corporation
- Google LLC
- Sharp Corporation
- BenQ Corporation
- Elo Touch Solutions
- NEC Display Solutions
- ViewSonic Corporation
- SMART Technologies
- Promethean World
- InFocus Corporation
- Panasonic Corporation
- Cisco Systems, Inc.
- Acer Inc.
Table of Contents
1. Research Objectives and Assumptions
- Research Objectives
- Assumptions
- Abbreviations
2. Market Purview
- Report Description
- Market Definition and Scope
- Executive Summary
- Global Digital Interactive Service Market, By Display Type
- Global Digital Interactive Service Market, By Application
- Global Digital Interactive Service Market, By Region
3. Market Dynamics, Regulations, and Trends Analysis
- Market Dynamics
- Impact Analysis
- Key Highlights
- Regulatory Scenario
- Product Launches/Approvals
- PEST Analysis
- PORTER's Analysis
- Market Opportunities
- Regulatory Scenario
- Key Developments
- Industry Trends
4. Global Digital Interactive Service Market, By Display Type, 2020-2032, (USD Bn)
- Introduction
- Market Share Analysis, 2025 and 2032 (%)
- Y-o-Y Growth Analysis, 2021 - 2032
- Segment Trends
- Interactive Kiosk
- Introduction
- Market Size and Forecast, and Y-o-Y Growth, 2020-2032, (USD Bn)
- Interactive Video Wall
- Introduction
- Market Size and Forecast, and Y-o-Y Growth, 2020-2032, (USD Bn)
- Interactive Table
- Introduction
- Market Size and Forecast, and Y-o-Y Growth, 2020-2032, (USD Bn)
- Interactive Monitor
- Introduction
- Market Size and Forecast, and Y-o-Y Growth, 2020-2032, (USD Bn)
- Interactive Whiteboard
- Introduction
- Market Size and Forecast, and Y-o-Y Growth, 2020-2032, (USD Bn)
5. Global Digital Interactive Service Market, By Application, 2020-2032, (USD Bn)
- Introduction
- Market Share Analysis, 2025 and 2032 (%)
- Y-o-Y Growth Analysis, 2021 - 2032
- Segment Trends
- Retail
- Introduction
- Market Size and Forecast, and Y-o-Y Growth, 2020-2032, (USD Bn)
- Hospitality
- Introduction
- Market Size and Forecast, and Y-o-Y Growth, 2020-2032, (USD Bn)
- Healthcare
- Introduction
- Market Size and Forecast, and Y-o-Y Growth, 2020-2032, (USD Bn)
- Transportation
- Introduction
- Market Size and Forecast, and Y-o-Y Growth, 2020-2032, (USD Bn)
- Banking, Financial Services, and Insurance (BFSI)
- Introduction
- Market Size and Forecast, and Y-o-Y Growth, 2020-2032, (USD Bn)
- Corporate
- Introduction
- Market Size and Forecast, and Y-o-Y Growth, 2020-2032, (USD Bn)
- Entertainment
- Introduction
- Market Size and Forecast, and Y-o-Y Growth, 2020-2032, (USD Bn)
- Education
- Introduction
- Market Size and Forecast, and Y-o-Y Growth, 2020-2032, (USD Bn)
6. Global Digital Interactive Service Market, By Region, 2020 - 2032, Value (USD Bn)
- Introduction
- Market Share (%) Analysis, 2025,2028 & 2032, Value (USD Bn)
- Market Y-o-Y Growth Analysis (%), 2021 - 2032, Value (USD Bn)
- Regional Trends
- North America
- Introduction
- Market Size and Forecast, By Display Type, 2020 - 2032, Value (USD Bn)
- Market Size and Forecast, By Application, 2020 - 2032, Value (USD Bn)
- Market Size and Forecast, By Country, 2020 - 2032, Value (USD Bn)
- U.S.
- Canada
- Latin America
- Introduction
- Market Size and Forecast, By Display Type, 2020 - 2032, Value (USD Bn)
- Market Size and Forecast, By Application, 2020 - 2032, Value (USD Bn)
- Market Size and Forecast, By Country, 2020 - 2032, Value (USD Bn)
- Brazil
- Argentina
- Mexico
- Rest of Latin America
- Europe
- Introduction
- Market Size and Forecast, By Display Type, 2020 - 2032, Value (USD Bn)
- Market Size and Forecast, By Application, 2020 - 2032, Value (USD Bn)
- Market Size and Forecast, By Country, 2020 - 2032, Value (USD Bn)
- Germany
- U.K.
- Spain
- France
- Italy
- Russia
- Rest of Europe
- Asia Pacific
- Introduction
- Market Size and Forecast, By Display Type, 2020 - 2032, Value (USD Bn)
- Market Size and Forecast, By Application, 2020 - 2032, Value (USD Bn)
- Market Size and Forecast, By Country, 2020 - 2032, Value (USD Bn)
- China
- India
- Japan
- Australia
- South Korea
- ASEAN
- Rest of Asia Pacific
- Middle East
- Introduction
- Market Size and Forecast, By Display Type, 2020 - 2032, Value (USD Bn)
- Market Size and Forecast, By Application, 2020 - 2032, Value (USD Bn)
- Market Size and Forecast, By Country, 2020 - 2032, Value (USD Bn)
- GCC Countries
- Israel
- Rest of Middle East
- Africa
- Introduction
- Market Size and Forecast, By Display Type, 2020 - 2032, Value (USD Bn)
- Market Size and Forecast, By Application, 2020 - 2032, Value (USD Bn)
- Market Size and Forecast, By Country/Region, 2020 - 2032, Value (USD Bn)
- South Africa
- North Africa
- Central Africa
7. Competitive Landscape
- Samsung Electronics
- Company Highlights
- Product Portfolio
- Key Developments
- Financial Performance
- Strategies
- LG Electronics
- Company Highlights
- Product Portfolio
- Key Developments
- Financial Performance
- Strategies
- Microsoft Corporation
- Company Highlights
- Product Portfolio
- Key Developments
- Financial Performance
- Strategies
- Google LLC
- Company Highlights
- Product Portfolio
- Key Developments
- Financial Performance
- Strategies
- Sharp Corporation
- Company Highlights
- Product Portfolio
- Key Developments
- Financial Performance
- Strategies
- BenQ Corporation
- Company Highlights
- Product Portfolio
- Key Developments
- Financial Performance
- Strategies
- Elo Touch Solutions
- Company Highlights
- Product Portfolio
- Key Developments
- Financial Performance
- Strategies
- NEC Display Solutions
- Company Highlights
- Product Portfolio
- Key Developments
- Financial Performance
- Strategies
- ViewSonic Corporation
- Company Highlights
- Product Portfolio
- Key Developments
- Financial Performance
- Strategies
- SMART Technologies
- Company Highlights
- Product Portfolio
- Key Developments
- Financial Performance
- Strategies
- Promethean World
- Company Highlights
- Product Portfolio
- Key Developments
- Financial Performance
- Strategies
- InFocus Corporation
- Company Highlights
- Product Portfolio
- Key Developments
- Financial Performance
- Strategies
- Panasonic Corporation
- Company Highlights
- Product Portfolio
- Key Developments
- Financial Performance
- Strategies
- Cisco Systems, Inc.
- Company Highlights
- Product Portfolio
- Key Developments
- Financial Performance
- Strategies
- Acer Inc.
- Company Highlights
- Product Portfolio
- Key Developments
- Financial Performance
- Strategies
8. Analyst Recommendations
- Wheel of Fortune
- Analyst View
- Coherent Opportunity Map
9. References and Research Methodology
- References
- Research Methodology
- About us
