


 |
市場調查報告書
商品編碼
1449679
排放權交易市場:按交易類型、最終用途和地區分類Emissions Trading Market, By Type Of Trading, By End Use, By Geography |
||||||
2023年排放權交易市場規模為3.176億美元,預計2030年將達10.345億美元,2023年至2030年年複合成長率為18.4%。
| 報告範圍 | 報告詳情 | ||
|---|---|---|---|
| 基準年 | 2022年 | 2023/2024年市場規模 | 3.176 億美元 |
| 實際資料 | 2018-2021 | 預測期 | 2024-2031 |
| 預測期間2023/2024 至2030/2031年年複合成長率: | 18.40% | 2030/2031年預測值 | 10.345 億美元 |
排放權交易,也稱為總量管制與交易,是一種基於市場的遏制溫室氣體排放的方法。排放權交易的運作前提是為特定產業或地區的溫室氣體排放排放設定上限。企業根據其允許排放分配排放配額。如果一家公司的排放低於其分配的排放,它可以將其剩餘排放出售給其他超過排放配額的公司。該系統提供了實現排放目標的彈性,同時獎勵公司在努力保持合規性的同時減少排放。排放權交易已成為全球應對氣候變遷、促進產業合作和鼓勵清潔技術投資的重要工具。
近年來,由於人們對環境問題的興趣日益濃厚以及國際社會應對氣候變遷的努力,排放權交易市場經歷了顯著成長。包括歐盟部分地區、中國和美國在內的多個地區已引進排放權交易計劃,以有效監管溫室氣體排放。此外,自願碳市場已經出現,允許企業和個人自願抵消其碳排放。隨著越來越多的國家和公司致力於減少碳排放,排放權交易市場將繼續擴大,並在世界向更永續和氣候智慧型未來的過渡中發揮關鍵作用。
歐盟排放權交易體系(EU ETS)是全球最大的碳市場,約佔全球碳權額交易的90%。歐盟承諾在2030年將溫室氣體排放減少55%,歐盟排放交易體系預計將持續成長。
市場動態:.
環境問題和氣候變遷緩解、監管合規和國際承諾預計將在預測期內推動全球排放權交易市場的成長。此外,經濟效率和成本效益、乾淨科技的推廣和技術創新也有望推動預測期內排放權交易市場的成長。擴大排放權交易計畫、整合排放權交易計畫、增加新的溫室氣體和基於市場的淨零目標解決方案預計將在預測期內為排放權交易市場提供成長機會。
然而,政治和政策的不確定性、不夠嚴格、市場運作和價格波動預計將阻礙預測期內排放權交易市場的成長。
本研究的主要特點
- 本報告詳細分析了排放權交易市場,並提供了以2022年為基準年的預測期間(2023-2030)的市場規模和年複合成長率(CAGR%)。
- 說明了各個細分市場的潛在商機,並為該市場提供了一系列有吸引力的投資提案。
- 提供了有關市場促進因素、限制因素、機會、新產品發布和核准、市場趨勢、區域前景、主要企業採取的競爭策略等的重要見解。
- 根據公司亮點、產品系列、主要亮點、財務表現和策略等參數,對排放權交易市場的主要企業進行了介紹。
- 本報告針對該產業的各個相關人員,包括投資者、供應商、產品製造商、經銷商、新進業者和財務分析師。
- 透過用於分析排放權交易市場的各種策略矩陣,將有助於相關人員做出決策。
目錄
第1章 研究目的與前提
- 研究目標
- 先決條件
- 簡稱
第2章 市場展望
- 報告說明
- 市場定義和範圍
- 執行摘要
- Coherent Opportunity Map(COM)
第3章 市場動態、法規及趨勢分析
- 市場動態
- 環境問題與減緩氣候變遷
- 監理合規性和國際舉措
- 經濟性和成本效益
- 促進潔淨科技和創新
- 排放大國缺乏承諾
- 普及排放免費分配
- 碳洩漏風險
- 擴大排放權交易體系
- 與排放權交易體系合作
- 含有新的溫室氣體
- 基於市場的淨零目標解決方案
- 主要亮點
- 監管場景
- 最近的趨勢
- 產品發布/核准
- PEST分析
- 波特的分析
- 合併、收購和合作
第4章 排放權交易市場,依交易類型,2017-2030
- 限額與交易
- 基準和學分
第5章 2017-2030年依最終用途分類的排放權交易市場
- 能源
- 發電
- 工業
- 交通設施
- 農業
第6章 2017-2030年依地區分類的排放權交易市場
- 北美洲
- 美國
- 加拿大
- 歐洲
- 德國
- 英國
- 西班牙
- 法國
- 義大利
- 俄羅斯
- 歐洲其他地區
- 亞太地區
- 中國
- 印度
- 日本
- 澳洲
- 韓國
- ASEAN
- 其他亞太地區
- 拉丁美洲
- 巴西
- 阿根廷
- 墨西哥
- 其他拉丁美洲
- 中東、非洲
- 海灣合作理事會國家
- 以色列
- 南非
- 北非
- 中部非洲
- 其他中東地區
第7章 競爭格局
- 公司簡介
- BP Plc.
- Royal Dutch Shell Plc
- Total SE
- Chevron Corporation
- ExxonMobil Corporation
- Engie SA
- RWE AG
- ON SE
- Vattenfall AB
- Gazprom
- Mitsubishi UFJ Financial Group(MUFG)
- JPMorgan Chase &Co.
- Goldman Sachs Group, Inc.
- Citigroup Inc.
- Barclays PLC
第8章
- 參考
- 調查方法
- 關於出版商
The emissions trading market size was estimated to be valued at US$ 317.6 Mn in 2023 and is expected to reach US$ 1,034.5 Mn by 2030, exhibiting a compound annual growth rate (CAGR) of 18.4% from 2023 to 2030.
| Report Coverage | Report Details | ||
|---|---|---|---|
| Base Year: | 2022 | Market Size in 2023/2024: | US$ 317.6 Mn |
| Historical Data for: | 2018 to 2021 | Forecast Period: | 2023 - 2030 |
| Forecast Period 2023/2024 to 2030/2031 CAGR: | 18.40% | 2030/2031 Value Projection: | US$ 1,034.5 Mn |
Emissions trading, also known as cap-and-trade, is a market-based approach to controlling greenhouse gas emissions. It operates under the premise of setting a cap on the total allowable emissions from specific industries or regions. Companies are allocated emission allowances corresponding to their permitted emission levels. If a company emits below its allotted amount, it can sell the surplus allowances to other companies exceeding their emissions limits. This system incentivizes emissions reductions as companies strive to maintain compliance while providing flexibility in achieving emission targets. Emissions trading has gained prominence globally as a crucial tool in addressing climate change, fostering cooperation among industries, and encouraging investment in cleaner technologies.
The emissions trading market has witnessed significant growth in recent years, spurred by mounting environmental concerns and international efforts to combat climate change. Various regions, including the European Union, China, and parts of the U.S., have implemented emissions trading systems to regulate greenhouse gas emissions effectively. Additionally, the voluntary carbon market has emerged, enabling businesses and individuals to offset their carbon footprint voluntarily. As more countries and companies commit to reducing their carbon emissions, the emissions trading market is likely to continue expanding, playing a vital role in the global transition towards a more sustainable and climate-conscious future.
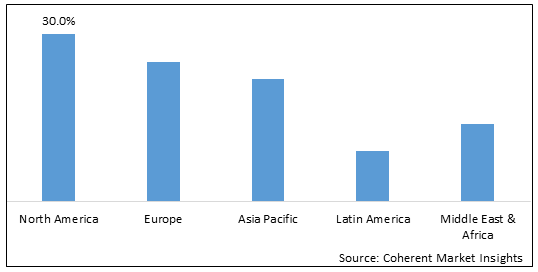
The European Union Emissions Trading System (EU ETS) is the largest carbon market in the world, accounting for around 90% of global carbon credit trading volume. The EU ETS is expected to continue to grow in the coming years, as the European Union commits to reducing its greenhouse gas emissions by 55% by 2030.
Market Dynamics:
Environmental concerns and climate change mitigation, regulatory compliance and international commitments are anticipated to drive growth of the global emissions trading market over the forecast period. Moreover, economic efficiency and cost-effectiveness, stimulating clean technologies and innovation is also expected to boost the growth of the emissions trading market over the forecast period. Expansion of emissions trading schemes, linking emissions trading systems, inclusion of new greenhouse gases, and market-based solutions for net-zero goals are expected to create growth opportunities for the emissions trading market during the forecast period.
However, political and policy uncertainty, insufficient stringency, market manipulation and price volatility are expected to hamper growth of the emissions trading market over the forecast period.
Key features of the study:
- This report provides in-depth analysis of the emissions trading market, and provides market size (US$ Mn) and compound annual growth rate (CAGR %) for the forecast period (2023-2030), considering 2022 as the base year.
- It elucidates potential revenue opportunities across different segments and explains attractive investment proposition matrices for this market.
- This study also provides key insights about market drivers, restraints, opportunities, new product launches or approval, market trends, regional outlook, and competitive strategies adopted by key players.
- It profiles key players in the emissions trading market based on the following parameters - company highlights, products portfolio, key highlights, financial performance, and strategies.
- Key companies covered as a part of this study include BP Plc., Royal Dutch Shell Plc., Total SE, Chevron Corporation, ExxonMobil Corporation, Engie SA, RWE AG, EON SE, Vattenfall AB, Gazprom, Mitsubishi UFJ Financial Group (MUFG), JPMorgan Chase & Co., Goldman Sachs Group, Inc. Citigroup Inc., and Barclays PLC Insights from this report would allow marketers and the management authorities of the companies to make informed decisions regarding their future product launches, type up-gradation, market expansion, and marketing tactics.
- The emissions trading market report caters to various stakeholders in this industry including investors, suppliers, product manufacturers, distributors, new entrants, and financial analysts.
- Stakeholders would have ease in decision-making through various strategy matrices used in analyzing the emissions trading market.
Detailed Segmentation:
- Emissions Trading Market Segmentation, By Trading Type:
- Cap-and-Trade
- Baseline-and-Credit
- Emissions Trading Market Segmentation, By End Use:
- Energy
- Power Generation
- Industrial
- Transportation
- Agriculture
- Emissions Trading Market Segmentation, By Region:
- North America
- Europe
- Asia Pacific
- Latin America
- Middle East
- Africa
- Top Companies in the Emissions Trading Market:
- BP Plc.
- Royal Dutch Shell Plc.
- Total SE
- Chevron Corporation
- ExxonMobil Corporation
- Engie SA
- RWE AG
- ON SE
- Vattenfall AB
- Gazprom
- Mitsubishi UFJ Financial Group (MUFG)
- JPMorgan Chase & Co
- Citigroup Inc.
- Barclays PLC
- Goldman Sachs Group, Inc.
Table of Contents
1. Research Objectives and Assumptions
- Research Objectives
- Assumptions
- Abbreviations
2. Market Purview
- Report Description
- Market Definition and Scope
- Executive Summary
- Emissions Trading Market, By Trading Type
- Emissions Trading Market, By End Use
- Emissions Trading Market, By Region
- Coherent Opportunity Map (COM)
3. Market Dynamics, Regulations, and Trends Analysis
- Market Dynamics
- Drivers
- Environmental concerns and climate change mitigation
- Regulatory compliance and international commitments
- Economic efficiency and cost-effectiveness
- Stimulating clean technologies and innovation
- Restraints
- Lack of commitment by large emitters
- Prevalence of free allocation of emissions allowances
- Carbon leakage risk
- Opportunities
- Expansion of emissions trading schemes
- Linking emissions trading systems
- Inclusion of new greenhouse gases
- Market-based solutions for net-Zero goals
- Key Highlights
- Regulatory Scenario
- Recent Trends
- Product Launches/Approvals
- PEST Analysis
- PORTER's Analysis
- Mergers, Acquisitions, and Collaborations
4. Emissions Trading Market, By Trading Type, 2017-2030, (US$ Mn)
- Introduction
- Market Share Analysis, 2023 and 2030 (%)
- Y-o-Y Growth Analysis, 2018 - 2030
- Segment Trends
- Cap-and-Trade
- Introduction
- Market Size and Forecast, and Y-o-Y Growth, 2017-2030,(US$ Mn)
- Baseline-and-Credit
- Introduction
- Market Size and Forecast, and Y-o-Y Growth, 2017-2030,(US$ Mn)
5. Emissions Trading Market, By End Use, 2017-2030, (US$ Mn)
- Introduction
- Market Share Analysis, 2023 and 2030 (%)
- Y-o-Y Growth Analysis, 2018 - 2030
- Segment Trends
- Energy
- Introduction
- Market Size and Forecast, and Y-o-Y Growth, 2017-2030, (US$ Million)
- Power Generation
- Introduction
- Market Size and Forecast, and Y-o-Y Growth, 2017-2030, (US$ Million)
- Industrial
- Introduction
- Market Size and Forecast, and Y-o-Y Growth, 2017-2030, (US$ Million)
- Transportation
- Introduction
- Market Size and Forecast, and Y-o-Y Growth, 2017-2030, (US$ Million)
- Agriculture
- Introduction
- Market Size and Forecast, and Y-o-Y Growth, 2017-2030, (US$ Million)
6. Emission Trading Market, By Region, 2017-2030, (US$ Mn)
- Introduction
- Market Share Analysis, By Sub-region, 2022 and 2030 (%)
- Y-o-Y Growth Analysis, For Sub-region, 2018 - 2030
- Segment Trends
- North America
- Introduction
- Market Size and Forecast, and Y-o-Y Growth, By Trading Type , 2017-2030,(US$ Mn)
- Market Size and Forecast, and Y-o-Y Growth, By End Use, 2017-2030,(US$ Mn)
- Market Size and Forecast, and Y-o-Y Growth, By Country, 2017-2030,(US$ Mn)
- U.S.
- Canada
- Europe
- Introduction
- Market Size and Forecast, and Y-o-Y Growth, By Trading Type , 2017-2030,(US$ Mn)
- Market Size and Forecast, and Y-o-Y Growth, By End Use, 2017-2030,(US$ Mn)
- Market Size and Forecast, and Y-o-Y Growth, By Country, 2017-2030,(US$ Mn)
- Germany
- U.K.
- Spain
- France
- Italy
- Russia
- Rest of Europe
- Asia Pacific
- Introduction
- Market Size and Forecast, and Y-o-Y Growth, By Trading Type , 2017-2030,(US$ Mn)
- Market Size and Forecast, and Y-o-Y Growth, By End Use, 2017-2030,(US$ Mn)
- Market Size and Forecast, and Y-o-Y Growth, By Country, 2017-2030,(US$ Mn)
- China
- India
- Japan
- Australia
- South Korea
- ASEAN
- Rest of Asia Pacific
- Latin America
- Introduction
- Market Size and Forecast, and Y-o-Y Growth, By Trading Type , 2017-2030,(US$ Mn)
- Market Size and Forecast, and Y-o-Y Growth, By End Use, 2017-2030,(US$ Mn)
- Market Size and Forecast, and Y-o-Y Growth, By Country, 2017-2030,(US$ Mn)
- Brazil
- Argentina
- Mexico
- Rest of Latin America
- Middle East & Africa
- Introduction
- Market Size and Forecast, and Y-o-Y Growth, By Trading Type , 2017-2030,(US$ Mn)
- Market Size and Forecast, and Y-o-Y Growth, By End Use, 2017-2030,(US$ Mn)
- Market Size and Forecast, and Y-o-Y Growth, By Country, 2017-2030,(US$ Mn)
- GCC Countries
- Israel
- South Africa
- North Africa
- Central Africa
- Rest of Middle East
7. Competitive Landscape
- Company Profile
- BP Plc.
- Company Highlights
- Product Portfolio
- Key Developments
- Financial Performance
- Strategies
- Royal Dutch Shell Plc
- Company Highlights
- Product Portfolio
- Key Highlights
- Financial Performance
- Strategies
- Total SE
- Company Highlights
- Product Portfolio
- Key Highlights
- Financial Performance
- Strategies
- Chevron Corporation
- Company Highlights
- Product Portfolio
- Key Highlights
- Financial Performance
- Strategies
- ExxonMobil Corporation
- Company Highlights
- Product Portfolio
- Key Highlights
- Financial Performance
- Strategies
- Engie SA
- Company Highlights
- Product Portfolio
- Key Highlights
- Financial Performance
- Strategies
- RWE AG
- Company Highlights
- Product Portfolio
- Key Highlights
- Financial Performance
- Strategies
- ON SE
- Company Highlights
- Product Portfolio
- Key Highlights
- Financial Performance
- Strategies
- Vattenfall AB
- Company Highlights
- Product Portfolio
- Key Highlights
- Financial Performance
- Strategies
- Gazprom
- Company Highlights
- Product Portfolio
- Key Highlights
- Financial Performance
- Strategies
- Mitsubishi UFJ Financial Group (MUFG)
- Company Highlights
- Product Portfolio
- Key Highlights
- Financial Performance
- Strategies
- JPMorgan Chase & Co.
- Company Highlights
- Product Portfolio
- Key Highlights
- Financial Performance
- Strategies
- Goldman Sachs Group, Inc.
- Company Highlights
- Product Portfolio
- Key Highlights
- Financial Performance
- Strategies
- Citigroup Inc.
- Company Highlights
- Product Portfolio
- Key Highlights
- Financial Performance
- Strategies
- Barclays PLC
- Company Highlights
- Product Portfolio
- Key Highlights
- Financial Performance
- Strategies
- Analyst Views
8. Section
- References
- Research Methodology
- About us
 二氧化碳捕集、利用和儲存市場 - 全球和區域分析:按應用、產品和區域 - 分析和預測(2025-2034)
 捕碳封存市場(按服務、技術和最終用途行業)—2025-2030 年全球預測碳捕獲、利用和儲存市場(按服務、技術類型和最終用途行業)—2025-2030 年全球預測
 捕碳封存:市場佔有率分析、行業趨勢和統計、成長預測(2025-2030 年)
 碳捕獲、利用和儲存市場規模、佔有率及成長分析(按技術、服務、類型、最終用戶和地區)-2025-2032 年產業預測
 2025年捕碳封存技術全球市場報告
 點源碳捕獲設備 (PSCD) 市場:2031 年預測
 全球發電碳捕獲與儲存市場研究報告 - 產業分析、規模、佔有率、成長、趨勢與預測 2025 年至 2033 年2025 年捕碳封存全球市場報告按技術、應用、服務和地區分類的捕碳封存市場