


 |
市場調查報告書
商品編碼
1251578
擴增實境的全球市場,規模調查&預測,各顯示器,各零件,各用途,各地區分析,2022-2029年Global Augmented Reality Market Size study&Forecast, by Component by Display, by Application and Regional Analysis, 2022-2029 |
||||||
擴增實境的全球市場,2021年價值253億3,000萬美元,在2022-2029年的預測期間以40.9%以上的強勢成長率成長。
增強現實是一種透過添加聲音、效果和圖形來增強用戶對現實世界的虛擬體驗的技術。由於在許多應用程式中的廣泛使用,有成長趨勢。AR透過物理世界和虛擬世界的結合,為用戶提供卓越的體驗。透過真實和虛擬對象的3D識別即時進行準確交互。此外,COVID-19對增強現實(AR)市場產生了積極影響,AR在多個產業的廣泛使用推動需求。
目錄
第1章 摘要整理
- 市場概述
- 世界及各分類市場的估計、預測,2019年~2029年
- 擴增實境市場,各地區,2019-2029年
- 擴增實境市場,各零件,2019-2029年
- 擴增實境市場,各顯示器,2019-2029年
- 擴增實境市場,各用途,2019-2029年
- 主要趨勢
- 調查手法
- 調查的前提條件
第2章 擴增實境的全球市場定義和範圍
- 調查目的
- 市場定義和範圍
- 調查目標範圍
- 產業的演進
- 本調查的對象年
- 貨幣換算比率
第3章 擴增實境的全球市場動態
- 擴增實境市場影響分析(2019-2029年)
- 推動市場要素
- 複數的應用使用頻率高漲
- COVID-19積極的效果
- 市場課題
- 擴增實境的過度使用弊病
- 市場潛力
- 擴增實境的投資擴大
- 進出與制定
- 推動市場要素
第4章 擴增實境的全球市場,各產業分析
- 波特的5力模式
- 供給企業談判力
- 買方議價能力
- 新加入業者的威脅
- 替代品的威脅
- 競爭企業間的敵對關係
- 對波特的5力模式的未來方法(2019-2029年)
- PEST分析
- 政治
- 經濟
- 社會
- 技術性
- 投資採用模式
- 分析師的建議與結論
- 主要的投資機會
- 主要成功策略
第5章 風險評估: COVID-19影響
- COVID-19對產業帶來的整體影響相關的評估
- COVID-19前和COVID-19後的市場情境
第6章 擴增實境的全球市場:各零件
- 市場概述
- 擴增實境的全球市場:各零件,各功能- 潛在力分析
- 全球AR(擴增實境)市場:各零件,估計、預測2019-2029
- 擴增實境市場,子區隔分析
- 硬體設備
- 軟體
第7章 擴增實境的全球市場,各顯示器
- 市場概述
- 擴增實境的全球市場:各顯示器,各功能)-潛在力分析
- 擴增實境的全球市場:各顯示器估計、預測2019-2029
- 擴增實境市場,子區隔分析
- HMD、智慧眼鏡
- HUD
- 手持設備
第8章 擴增實境的全球市場:各用途
- 市場概述
- 擴增實境的全球市場:各用途,各功能- 潛在力分析
- 擴增實境的全球市場:各用途估計、預測2019-2029
- 擴增實境市場,子區隔分析
- 航太、防衛
- 汽車
- 教育
- 電子商務與零售
- 遊戲&娛樂
- 醫療保健
- 產業、製造業
- 其他
第9章 擴增實境的全球市場:各地區分析
- 擴增實境市場,各地區市場概述
- 北美
- 美國
- 各零件的估計、預測,2019年~2029年
- 各顯示器的估計、預測,2019年~2029年
- 各用途的估計、預測,2019年~2029年
- 加拿大
- 美國
- 歐洲擴增實境市場概述
- 英國
- 德國
- 法國
- 西班牙
- 義大利
- 其他歐洲
- 亞太地區擴增實境市場概述
- 中國
- 印度
- 日本
- 澳洲
- 韓國
- 其他亞太地區
- 南美的擴增實境市場概述
- 巴西
- 墨西哥
- 全球其他地區
第10章 競爭資訊
- 最高市場策略
- 企業簡介
- Microsoft Corporation
- 主要的資訊
- 概要
- 只財務(資料的取得可能的情況)
- 產品概要
- 最近的趨勢
- Google LLC
- Apple, Inc.
- Sony Corporation
- Blippar Limited BLIPPAR COM INDIA PRIVATE LIMITED
- Infinity Augmented Reality Limited
- Niantic, Inc.
- Zappar Limited.
- Qualcomm Technologies, Inc.
- Wikitude GmbH
- Microsoft Corporation
第11章 調查流程
- 調查流程
- 資料探勘
- 分析
- 市場估計
- 檢驗
- 出版
- 調查的特徵
- 調查的前提條件
Global Augmented Reality Market is valued at approximately USD25.33 billion in 2021 and is anticipated to grow with a healthy growth rate of more than 40.9% over the forecast period 2022-2029. Augmented Reality is a technology that enhances the users virtual experience of real world through adding sound, effects and graphics. It is a growing trend due to its wider use in a number of applications. AR gives an excellent experience to its user through the combination of the physical and virtual world. Accurate interactions are made in real-time with 3D identification of real and virtual objects. Additionally, COVID-19 laid a positive impact on the augmented reality (AR) market and the wider use of AR in several industries is driving the demand.
The growthof augmented reality (AR) is seen in several applications by providingexperience using 2D/3D models, AR books, and AR games. The highest demand is witnessed by the healthcare industry, the adoption of 3D imaging technology is driving the demand for augmented reality. In 2017 the total market share for the 3D imaging industry accounted to be around USD 800 million. In 2020 it was projected that several hospitals adopted AR Devices for aiding patients. AR Technology in construction, architectural and consumer application is evolving rapidly. The uncertain pandemic led to a positive effect on the market growth of augmented reality. The businesses turned to remote and online work further creating a demand for AR. For instance, during the pandemic, the U.S. employee number working from home increased to 44%. Moreover, increasing investments in augmented reality and continuous advancements and formulation are boosting the market demand. However, the harmful effects of excessive use ofAugmented Reality stifle market growth throughout the forecast period of 2022-2029.
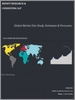
The key regions considered for the Global Augmented Reality Marketstudy includes Asia Pacific, North America, Europe, Latin America, and Rest of the World.North America dominated the market with a market share of 33.9%. This region is a fast adopter of new technologies in gaming and entertainment applications. The rising interest of individuals in augmented reality (AR) experience is playing a major role. Asia-Pacific is anticipated to be the fastest-growing region due to the increasing adoption of AR technologies and AR-based solutions. During the pandemic,healthcare experts shifted to AR technologies in order to trace and aid patients. It improved the patients' surveillance through live video streaming and face time.
Major market players included in this report are:
- Microsoft Corporation
- Google LLC
- Apple, Inc.
- Sony Corporation
- Blippar Limited BLIPPAR COM INDIA PRIVATE LIMITED
- Infinity Augmented Reality Limited
- Niantic, Inc.
- Zappar Limited.
- Qualcomm Technologies, Inc.
- Wikitude GmbH
Recent Developments in the Market:
- In February 2022, Microsoft partnered with Qualcomm to produce industry-first chip to cloud solutions for private organizations to easily implement private 5G networks globally.
- In March 2021, a new product was launched 'Microsoft Mesh' by Microsoft. This allows its user to interact and share experiencesfrom anywhere across an AR meeting space.
Global Augmented Reality Market Report Scope:
- Historical Data 2019-2020-2021
- Base Year for Estimation 2021
- Forecast period 2022-2029
- Report Coverage Revenue forecast, Company Ranking, Competitive Landscape, Growth factors, and Trends
- Segments Covered Component, Display, Application, Region
- Regional Scope North America; Europe; Asia Pacific; Latin America; Rest of the World
- Customization Scope Free report customization (equivalent up to 8 analyst's working hours) with purchase. Addition or alteration to country, regional & segment scope*
The objective of the study is to define market sizes of different segments & countries in recent years and to forecast the values to the coming years. The report is designed to incorporate both qualitative and quantitative aspects of the industry within countries involved in the study.
The report also caters detailed information about the crucial aspects such as driving factors & challenges which will define the future growth of the market. Additionally, it also incorporates potential opportunities in micro markets for stakeholders to invest along with the detailed analysis of competitive landscape and Component offerings of key players. The detailed segments and sub-segment of the market are explained below:
By Component:
- Hardware
- Software
By Display:
- HMD & smart glass
- HUD
- Handheld devices
By Application:
- Aerospace & Defense
- Automotive
- Education
- E-Commerce & Retail
- Gaming & Entertainment
- Healthcare
- Industrial & Manufacturing
- Others
By Region:
- North America
- U.S.
- Canada
- Europe
- UK
- Germany
- France
- Spain
- Italy
- ROE
- Asia Pacific
- China
- India
- Japan
- Australia
- South Korea
- RoAPAC
- Latin America
- Brazil
- Mexico
- Rest of the World
Table of Contents
Chapter 1. Executive Summary
- 1.1. Market Snapshot
- 1.2. Global & Segmental Market Estimates & Forecasts, 2019-2029 (USD Billion)
- 1.2.1. Augmented Reality Market, by Region, 2019-2029 (USD Billion)
- 1.2.2. Augmented Reality Market, by Component,2019-2029 (USD Billion)
- 1.2.3. Augmented Reality Market, by Display, 2019-2029 (USD Billion)
- 1.2.4. Augmented Reality Market, by Application, 2019-2029 (USD Billion)
- 1.3. Key Trends
- 1.4. Estimation Methodology
- 1.5. Research Assumption
Chapter 2. Global Augmented Reality Market Definition and Scope
- 2.1. Objective of the Study
- 2.2. Market Definition & Scope
- 2.2.1. Scope of the Study
- 2.2.2. Industry Evolution
- 2.3. Years Considered for the Study
- 2.4. Currency Conversion Rates
Chapter 3. Global Augmented Reality Market Dynamics
- 3.1. Augmented Reality Market Impact Analysis (2019-2029)
- 3.1.1. Market Drivers
- 3.1.1.1. Growing use in several applications.
- 3.1.1.2. Positive effect of COVID-19.
- 3.1.2. Market Challenges
- 3.1.2.1. Harmful effects of excessive use of Augmented Reality.
- 3.1.3. Market Opportunities
- 3.1.3.1. Increasing investment in Augmented Reality.
- 3.1.3.2. Advancements and Formulation.
- 3.1.1. Market Drivers
Chapter 4. Global Augmented Reality MarketIndustry Analysis
- 4.1. Porter's 5 Force Model
- 4.1.1. Bargaining Power of Suppliers
- 4.1.2. Bargaining Power of Buyers
- 4.1.3. Threat of New Entrants
- 4.1.4. Threat of Substitutes
- 4.1.5. Competitive Rivalry
- 4.2. Futuristic Approach to Porter's 5 Force Model (2019-2029)
- 4.3. PEST Analysis
- 4.3.1. Political
- 4.3.2. Economical
- 4.3.3. Social
- 4.3.4. Technological
- 4.4. Investment Adoption Model
- 4.5. Analyst Recommendation & Conclusion
- 4.6. Top investment opportunity
- 4.7. Top winning strategies
Chapter 5. Risk Assessment: COVID-19 Impact
- 5.1. Assessment of the overall impact of COVID-19 on the industry
- 5.2. Pre COVID-19 and post COVID-19 Market scenario
Chapter 6. Global Augmented Reality Market, by Component
- 6.1. Market Snapshot
- 6.2. Global Augmented Reality Market by Component, Performance - Potential Analysis
- 6.3. Global Augmented Reality Market Estimates & Forecasts by Component 2019-2029 (USD Billion)
- 6.4. Augmented Reality Market, Sub Segment Analysis
- 6.4.1. Hardware
- 6.4.2. Software
Chapter 7. Global Augmented Reality Market, by Display
- 7.1. Market Snapshot
- 7.2. Global Augmented Reality Market by Display, Performance - Potential Analysis
- 7.3. Global Augmented Reality Market Estimates & Forecasts by Display2019-2029 (USD Billion)
- 7.4. Augmented Reality Market, Sub Segment Analysis
- 7.4.1. HMD & smart glass
- 7.4.2. HUD
- 7.4.3. Handheld devices
Chapter 8. Global Augmented Reality Market, byApplication
- 8.1. Market Snapshot
- 8.2. Global Augmented Reality Market by Application, Performance - Potential Analysis
- 8.3. Global Augmented Reality Market Estimates & Forecasts by Application 2019-2029 (USD Billion)
- 8.4. Augmented Reality Market, Sub Segment Analysis
- 8.4.1. Aerospace & Defense
- 8.4.2. Automotive
- 8.4.3. Education
- 8.4.4. E-Commerce & Retail
- 8.4.5. Gaming & Entertainment
- 8.4.6. Healthcare
- 8.4.7. Industrial & Manufacturing
- 8.4.8. Others
Chapter 9. Global Augmented Reality Market, Regional Analysis
- 9.1. Augmented Reality Market, Regional Market Snapshot
- 9.2. North America Augmented Reality Market
- 9.2.1. U.S.Augmented Reality Market
- 9.2.1.1. Componentbreakdown estimates & forecasts, 2019-2029
- 9.2.1.2. Display breakdown estimates & forecasts, 2019-2029
- 9.2.1.3. Application breakdown estimates & forecasts, 2019-2029
- 9.2.2. Canada Augmented Reality Market
- 9.2.1. U.S.Augmented Reality Market
- 9.3. Europe Augmented Reality Market Snapshot
- 9.3.1. U.K. Augmented Reality Market
- 9.3.2. Germany Augmented Reality Market
- 9.3.3. France Augmented Reality Market
- 9.3.4. Spain Augmented Reality Market
- 9.3.5. Italy Augmented Reality Market
- 9.3.6. Rest of EuropeAugmented Reality Market
- 9.4. Asia-PacificAugmented Reality Market Snapshot
- 9.4.1. China Augmented Reality Market
- 9.4.2. India Augmented Reality Market
- 9.4.3. JapanAugmented Reality Market
- 9.4.4. Australia Augmented Reality Market
- 9.4.5. South Korea Augmented Reality Market
- 9.4.6. Rest of Asia PacificAugmented Reality Market
- 9.5. Latin America Augmented Reality Market Snapshot
- 9.5.1. Brazil Augmented Reality Market
- 9.5.2. MexicoAugmented Reality Market
- 9.6. Rest of The World Augmented Reality Market
Chapter 10. Competitive Intelligence
- 10.1. Top Market Strategies
- 10.2. Company Profiles
- 10.2.1. Microsoft Corporation
- 10.2.1.1. Key Information
- 10.2.1.2. Overview
- 10.2.1.3. Financial (Subject to Data Availability)
- 10.2.1.4. ProductSummary
- 10.2.1.5. Recent Developments
- 10.2.2. Google LLC
- 10.2.3. Apple, Inc.
- 10.2.4. Sony Corporation
- 10.2.5. Blippar Limited BLIPPAR COM INDIA PRIVATE LIMITED
- 10.2.6. Infinity Augmented Reality Limited
- 10.2.7. Niantic, Inc.
- 10.2.8. Zappar Limited.
- 10.2.9. Qualcomm Technologies, Inc.
- 10.2.10. Wikitude GmbH
- 10.2.1. Microsoft Corporation
Chapter 11. Research Process
- 11.1. Research Process
- 11.1.1. Data Mining
- 11.1.2. Analysis
- 11.1.3. Market Estimation
- 11.1.4. Validation
- 11.1.5. Publishing
- 11.2. Research Attributes
- 11.3. Research Assumption
LIST OF TABLES
- TABLE 1. Global Augmented Reality Market, report scope
- TABLE 2. Global Augmented Reality Market estimates & forecasts by Region 2019-2029 (USD Billion)
- TABLE 3. Global Augmented Reality Market estimates & forecasts by Component 2019-2029 (USD Billion)
- TABLE 4. Global Augmented Reality Market estimates & forecasts by Display 2019-2029 (USD Billion)
- TABLE 5. Global Augmented Reality Market estimates & forecasts by Application 2019-2029 (USD Billion)
- TABLE 6. Global Augmented Reality Market by segment, estimates & forecasts, 2019-2029 (USD Billion)
- TABLE 7. Global Augmented Reality Market by region, estimates & forecasts, 2019-2029 (USD Billion)
- TABLE 8. Global Augmented Reality Market by segment, estimates & forecasts, 2019-2029 (USD Billion)
- TABLE 9. Global Augmented Reality Market by region, estimates & forecasts, 2019-2029 (USD Billion)
- TABLE 10. Global Augmented Reality Market by segment, estimates & forecasts, 2019-2029 (USD Billion)
- TABLE 11. Global Augmented Reality Market by region, estimates & forecasts, 2019-2029 (USD Billion)
- TABLE 12. Global Augmented Reality Market by segment, estimates & forecasts, 2019-2029 (USD Billion)
- TABLE 13. Global Augmented Reality Market by region, estimates & forecasts, 2019-2029 (USD Billion)
- TABLE 14. Global Augmented Reality Market by segment, estimates & forecasts, 2019-2029 (USD Billion)
- TABLE 15. Global Augmented Reality Market by region, estimates & forecasts, 2019-2029 (USD Billion)
- TABLE 16. U.S. Augmented Reality Market estimates & forecasts, 2019-2029 (USD Billion)
- TABLE 17. U.S. Augmented Reality Market estimates & forecasts by segment 2019-2029 (USD Billion)
- TABLE 18. U.S. Augmented Reality Market estimates & forecasts by segment 2019-2029 (USD Billion)
- TABLE 19. Canada Augmented Reality Market estimates & forecasts, 2019-2029 (USD Billion)
- TABLE 20. Canada Augmented Reality Market estimates & forecasts by segment 2019-2029 (USD Billion)
- TABLE 21. Canada Augmented Reality Market estimates & forecasts by segment 2019-2029 (USD Billion)
- TABLE 22. UK Augmented Reality Market estimates & forecasts, 2019-2029 (USD Billion)
- TABLE 23. UK Augmented Reality Market estimates & forecasts by segment 2019-2029 (USD Billion)
- TABLE 24. UK Augmented Reality Market estimates & forecasts by segment 2019-2029 (USD Billion)
- TABLE 25. Germany Augmented Reality Market estimates & forecasts, 2019-2029 (USD Billion)
- TABLE 26. Germany Augmented Reality Market estimates & forecasts by segment 2019-2029 (USD Billion)
- TABLE 27. Germany Augmented Reality Market estimates & forecasts by segment 2019-2029 (USD Billion)
- TABLE 28. France Augmented Reality Market estimates & forecasts, 2019-2029 (USD Billion)
- TABLE 29. FranceAugmented Reality Market estimates & forecasts by segment 2019-2029 (USD Billion)
- TABLE 30. FranceAugmented Reality Market estimates & forecasts by segment 2019-2029 (USD Billion)
- TABLE 31. ItalyAugmented Reality Market estimates & forecasts, 2019-2029 (USD Billion)
- TABLE 32. ItalyAugmented Reality Market estimates & forecasts by segment 2019-2029 (USD Billion)
- TABLE 33. ItalyAugmented Reality Market estimates & forecasts by segment 2019-2029 (USD Billion)
- TABLE 34. SpainAugmented Reality Market estimates & forecasts, 2019-2029 (USD Billion)
- TABLE 35. SpainAugmented Reality Market estimates & forecasts by segment 2019-2029 (USD Billion)
- TABLE 36. SpainAugmented Reality Market estimates & forecasts by segment 2019-2029 (USD Billion)
- TABLE 37. RoEAugmented Reality Market estimates & forecasts, 2019-2029 (USD Billion)
- TABLE 38. RoEAugmented Reality Market estimates & forecasts by segment 2019-2029 (USD Billion)
- TABLE 39. RoEAugmented Reality Market estimates & forecasts by segment 2019-2029 (USD Billion)
- TABLE 40. China Augmented Reality Market estimates & forecasts, 2019-2029 (USD Billion)
- TABLE 41. China Augmented Reality Market estimates & forecasts by segment 2019-2029 (USD Billion)
- TABLE 42. China Augmented Reality Market estimates & forecasts by segment 2019-2029 (USD Billion)
- TABLE 43. India Augmented Reality Market estimates & forecasts, 2019-2029 (USD Billion)
- TABLE 44. India Augmented Reality Market estimates & forecasts by segment 2019-2029 (USD Billion)
- TABLE 45. India Augmented Reality Market estimates & forecasts by segment 2019-2029 (USD Billion)
- TABLE 46. Japan Augmented Reality Market estimates & forecasts, 2019-2029 (USD Billion)
- TABLE 47. Japan Augmented Reality Market estimates & forecasts by segment 2019-2029 (USD Billion)
- TABLE 48. Japan Augmented Reality Market estimates & forecasts by segment 2019-2029 (USD Billion)
- TABLE 49. South Korea Augmented Reality Market estimates & forecasts, 2019-2029 (USD Billion)
- TABLE 50. South Korea Augmented Reality Market estimates & forecasts by segment 2019-2029 (USD Billion)
- TABLE 51. South Korea Augmented Reality Market estimates & forecasts by segment 2019-2029 (USD Billion)
- TABLE 52. Australia Augmented Reality Market estimates & forecasts, 2019-2029 (USD Billion)
- TABLE 53. Australia Augmented Reality Market estimates & forecasts by segment 2019-2029 (USD Billion)
- TABLE 54. Australia Augmented Reality Market estimates & forecasts by segment 2019-2029 (USD Billion)
- TABLE 55. RoAPACAugmented Reality Market estimates & forecasts, 2019-2029 (USD Billion)
- TABLE 56. RoAPACAugmented Reality Market estimates & forecasts by segment 2019-2029 (USD Billion)
- TABLE 57. RoAPACAugmented Reality Market estimates & forecasts by segment 2019-2029 (USD Billion)
- TABLE 58. Brazil Augmented Reality Market estimates & forecasts, 2019-2029 (USD Billion)
- TABLE 59. Brazil Augmented Reality Market estimates & forecasts by segment 2019-2029 (USD Billion)
- TABLE 60. Brazil Augmented Reality Market estimates & forecasts by segment 2019-2029 (USD Billion)
- TABLE 61. Mexico Augmented Reality Market estimates & forecasts, 2019-2029 (USD Billion)
- TABLE 62. Mexico Augmented Reality Market estimates & forecasts by segment 2019-2029 (USD Billion)
- TABLE 63. Mexico Augmented Reality Market estimates & forecasts by segment 2019-2029 (USD Billion)
- TABLE 64. RoLAAugmented Reality Market estimates & forecasts, 2019-2029 (USD Billion)
- TABLE 65. RoLAAugmented Reality Market estimates & forecasts by segment 2019-2029 (USD Billion)
- TABLE 66. RoLAAugmented Reality Market estimates & forecasts by segment 2019-2029 (USD Billion)
- TABLE 67. Row Augmented Reality Market estimates & forecasts, 2019-2029 (USD Billion)
- TABLE 68. Row Augmented Reality Market estimates & forecasts by segment 2019-2029 (USD Billion)
- TABLE 69. Row Augmented Reality Market estimates & forecasts by segment 2019-2029 (USD Billion)
- TABLE 70. List of secondary sources, used in the study of global Augmented Reality Market
- TABLE 71. List of primary sources, used in the study of global Augmented Reality Market
- TABLE 72. Years considered for the study
- TABLE 73. Exchange rates considered
List of tables and figures and dummy in nature, final lists may vary in the final deliverable
LIST OF FIGURES
List of figures
- FIG 1. Global Augmented Reality Market, research methodology
- FIG 2. Global Augmented Reality Market, Market estimation techniques
- FIG 3. Global Market size estimates & forecast methods
- FIG 4. Global Augmented Reality Market, key trends 2021
- FIG 5. Global Augmented Reality Market, growth prospects 2022-2029
- FIG 6. Global Augmented Reality Market, porters 5 force model
- FIG 7. Global Augmented Reality Market, pest analysis
- FIG 8. Global Augmented Reality Market, value chain analysis
- FIG 9. Global Augmented Reality Market by segment, 2019 & 2029 (USD Billion)
- FIG 10. Global Augmented Reality Market by segment, 2019 & 2029 (USD Billion)
- FIG 11. Global Augmented Reality Market by segment, 2019 & 2029 (USD Billion)
- FIG 12. Global Augmented Reality Market by segment, 2019 & 2029 (USD Billion)
- FIG 13. Global Augmented Reality Market by segment, 2019 & 2029 (USD Billion)
- FIG 14. Global Augmented Reality Market, regional snapshot 2019 & 2029
- FIG 15. North America Augmented Reality Market2019 & 2029 (USD Billion)
- FIG 16. Europe Augmented Reality Market2019 & 2029 (USD Billion)
- FIG 17. Asia pacific Augmented Reality Market2019 & 2029 (USD Billion)
- FIG 18. Latin America Augmented Reality Market2019 & 2029 (USD Billion)
- FIG 19. Global Augmented Reality Market, company Market share analysis (2021)
List of tables and figures and dummy in nature, final lists may vary in the final deliverable
 全球空間計算市場規模、佔有率、成長分析,依組件(空間計算設備)、依技術、依應用、依行業 - 2024-2031 年行業預測
 2024-2028 年全球空間運算市場
 AR(擴增實境):市場佔有率分析、產業趨勢與統計、成長預測(2024-2029)
 2024 年工業擴增實境全球市場報告
 空間計算市場規模、佔有率、趨勢分析報告:按解決方案、按技術、按最終用途、按地區、細分市場預測,2023-2030 年
 擴增實境行銷全球市場報告 2024
 供應鏈市場中的擴增實境:按產品、應用程式和最終用戶分類 - 2024-2030 年全球預測
 擴增實境市場:按產品、技術、設備類型和應用分類 - 2024-2030 年全球預測
 數位學習中的擴增實境(AR) 市場:按組件、按部署分類 - 2024-2030 年全球預測
 全球空間計算市場 - 2023-2030