


 |
市場調查報告書
商品編碼
1215353
全球超連接市場規模研究與預測:按組件、按產品、按組織規模、按最終用途行業、按地區,2022-2029 年Global Hyperconnectivity Market Size study & Forecast, by Component, by Product, by Organization Size, by End Use Industry and Regional Analysis, 2022-2029 |
||||||
2021 年全球超連接市場價值約為 3109 億美元,預計在 2022-2029 年預測期內將以超過 22.08% 的健康增長率增長。
超級連接可以定義為使用各種系統和設備與社交網絡和其他數字資源保持連接。 超連接是通過互聯網相互連接的信息系統、數據和設備之間的交互。 物聯網技術的普及、智能手機的普及以及主要市場參與者的戰略舉措是推動市場增長的主要因素。
越來越多地採用基於物聯網 (IoT) 的設備,這有助於全球超連接市場的增長。 例如,根據 Statista 的數據,到 2020 年,全球物聯網 (IoT) 市場總額估計為 3890 億美元,預計到 2030 年將增長到超過 1 萬億美元。 此外,根據 Statista 預測,2020 年全球預計將有 97 億台物聯網 (IoT) 設備,到 2030 年這一數字有望增長到 290 億台。 此外,新興國家高速互聯網連接的興起以及組織中越來越多地採用超連接解決方案也有望在預測期內為市場創造良好的增長前景。 然而,數據洩露事件的數量和數據隱私問題將阻礙整個 2022-2029 年預測期內的市場增長。
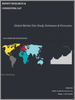
研究的全球超連接市場區域包括亞太地區、北美、歐洲、拉丁美洲和世界其他主要地區。 由於該地區強大的市場參與者和必要的技術基礎設施的可用性,北美在收入方面佔據了市場主導地位。 另一方面,由於物聯網連接設備普及率上升、工業化程度提高以及對 5G 技術的投資增加等因素,預計亞太地區在預測期內將以最高複合年增長率增長。
這項研究的目的是定義近年來各個細分市場和國家/地區的市場規模,並預測它們在未來幾年的價值。 本報告旨在捕捉被調查國家行業的定性和定量方面的情況。
它還提供了關鍵方面的詳細信息,例如決定市場未來增長的驅動因素和挑戰。 此外,它還包含供利益相關者投資的微觀市場潛在機會,以及對主要參與者的競爭格局和產品供應的深入分析。
按組件
解決方案
服務
按產品
企業可穿戴設備
中間件軟件
雲平台
商業解決方案
按組織規模
中小企業
大企業
最終用戶
英國食品安全協會
醫療保健與生命科學
通訊/IT行業
政府/公共機構
製造業
消費品與零售
媒體和娛樂
內容
第 1 章執行摘要
- 市場概況
- 2019-2029 年各細分市場的全球市場估計和預測
- 超連接市場,按地區劃分,2019-2029 年
- 超連接市場:按組件分類,2019-2029 年
- 超連接市場:按產品分類,2019-2029 年
- 超連接市場:按組織規模劃分,2019 年至 2029 年
- 超連接市場:按最終用途行業分類,2019-2029 年
- 主要趨勢
- 調查方法
- 調查先決條件
第 2 章超連接的全球市場定義和範圍
- 調查的目的
- 市場定義和範圍
- 調查範圍
- 工業發展
- 調查年份
- 貨幣兌換率
第 3 章超連接的全球市場動態
- 超連接市場的影響分析(2019-2029)
- 市場驅動力
- 物聯網技術的採用率提高
- 智能手機普及率上升
- 主要市場參與者的戰略舉措
- 市場挑戰
- 數據隱私和安□□全問題
- 市場機會
- 新興國家/地區高速互聯網連接的興起
- 在組織中更多地採用超級連接解決方案
- 市場驅動力
第 4 章超連接全球市場行業分析
- 波特 5 力模型
- 供應商的議價能力
- 買家的議價能力
- 新進入者的威脅
- 替代品的威脅
- 競爭公司之間的敵對關係
- 波特 5 力模型的未來方法 (2019-2029)
- 害蟲分析
- 政治
- 經濟的
- 社交
- 技術
- 頂級投資機會
- 關鍵成功策略
- 行業專家的展望
- 分析師的結論和建議
第 5 章風險評估:COVID-19 的影響
- 評估 COVID-19 對行業的總體影響
- COVID-19 之前和 COVID-19 之後的市場情景
第 6 章全球超連接市場,按組件分類
- 市場概況
- 全球超連接市場:按組件分類的性能潛力分析
- 2019-2029 年全球超連接市場、按組成部分的估計和預測
- 超連接市場、細分市場分析
- 解決方案
- 服務
第 7 章:全球超連接市場:按產品分類
- 市場概況
- 全球超連接市場:按產品、按性能、潛力分析
- 2019-2029 年全球超連接市場、按產品估算和預測
- 超連接市場、細分市場分析
- 適用於企業的可穿戴設備
- 中間件軟件
- 雲平台
- 業務解決方案
第 8 章全球超連接市場:按組織規模
- 市場概況
- 全球超級連接市場:組織規模、績效和潛力分析
- 2019-2029 年全球超連接市場、按組織規模估算和預測
- 超連接市場、細分市場分析
- 中小企業
- 大公司
第 9 章全球超級連接市場:按最終用途行業分類
- 市場概況
- 全球超級連接市場:按最終用途行業進行的性能和潛力分析
- 2019-2029 年全球超連接市場、最終用途行業的估計和預測
- 超連接市場、細分市場分析
- BFSI
- 醫療保健與生命科學
- 通信/IT 領域
- 政府/公共機構
- 製造業
- 消費品/零售
- 媒體與娛樂
第 10 章全球超連接市場:區域分析
- 超連接市場的區域市場概況
- 北美
- 美國
- 2019-2029 年各組成部分的估計和預測
- 2019-2029 年按產品估算和預測
- 按組織規模估算和預測,2019 年至 2029 年
- 2019-2029 年終端用戶行業的估計和預測
- 加拿大
- 美國
- 歐洲超連接市場概況
- 英國
- 德國
- 法國
- 西班牙
- 意大利
- 其他歐洲地區
- 亞太超級連接市場概況
- 中國
- 印度
- 日本
- 澳大利亞
- 韓國
- 其他亞太地區
- 拉丁美洲超連接市場概況
- 巴西
- 墨西哥
- 其他拉丁美洲地區
- 世界其他地區
第 11 章衝突信息
- 頂級市場策略
- 公司簡介
- Avaya Holdings Corp.
- 主要信息
- 概覽
- 財務信息(取決於數據可用性)
- 產品概述
- 近期趨勢
- Extreme Networks
- Fujitsu Limited
- Iberdrola SA
- International Business Machines Corporation
- Microsoft Corporation
- Orange IT Solutions
- Oracle Corporation
- PathPartner Technology
- Broadcom Inc.
- Avaya Holdings Corp.
第 12 章研究過程
- 研究過程
- 數據挖掘
- 分析
- 市場評估
- 驗證
- 出版
- 調查屬性
- 調查先決條件
Global Hyperconnectivity Market is valued at approximately USD 310.9 billion in 2021 and is anticipated to grow with a healthy growth rate of more than 22.08% over the forecast period 2022-2029. Hyperconnectivity can be defined as the use of various systems and devices to remain connected to social networks and other digital sources of information. Hyperconnectivity is an interaction between information systems, data, and devices, which are connected to each other through the internet. The increasing adoption of IoT technologies and growing penetration of smartphones as well as strategic initiatives from leading market players are key factors accelerating the market growth.
The increasing adoption of Internet of Things (IoT) based devices is contributing to the growth of the Global Hyperconnectivity Market. For instance, according to Statista - in 2020, the total Internet of Things (IoT) market worldwide was estimated at USD 389 billion, and the market is projected to grow to more than USD 1000 billion by 2030. Moreover, as per Statista estimates - in 2020, globally the number of Internet of Things (IoT) devices was estimated at 9.7 billion, and as per projections, this number would grow to 29 billion by 2030. Also, rising emergence of high-speed internet connectivity in developing nations coupled with increasing adoption of hyperconnectivity solutions in organizations would create a lucrative growth prospectus for the market over the forecast period. However, increasing incidences of data breaches & concerns relating to data privacy impede the market growth throughout the forecast period of 2022-2029.
The key regions considered for the Global Hyperconnectivity Market study include Asia Pacific, North America, Europe, Latin America, and Rest of the World. North America dominated the market in terms of revenue, owing to the presence of leading market players and availability of required technological infrastructure in the region. Whereas Asia Pacific is expected to grow with the highest CAGR during the forecast period, owing to factors such as rising penetration of IoT-connected devices, coupled with growing industrialization and increasing investment in 5G technologies in the region.
Major market players included in this report are:
Avaya Holdings Corp.
Extreme Networks
Fujitsu Limited
Iberdrola SA
International Business Machines Corporation
Microsoft Corporation
Orange IT Solutions
Oracle Corporation
PathPartner Technology
Broadcom Inc.
Recent Developments in the Market:
- In June 2021, KPIT Technologies entered into a definitive agreement to acquire PathPartner Technology. PathPartner is a leading provider of operating system software and low-level software for Automotive, Camera, Radar, and Multimedia devices.
Global Hyperconnectivity Market Report Scope:
Historical Data: 2019-2020-2021
Base Year for Estimation: 2021
Forecast period: 2022-2029
Report Coverage: Revenue forecast, Company Ranking, Competitive Landscape, Growth factors, and Trends
Segments Covered: Component, Product, Organization Size, End-Use Industry, Region
Regional Scope: North America; Europe; Asia Pacific; Latin America; Rest of the World
Customization Scope: Free report customization (equivalent up to 8 analyst's working hours) with purchase. Addition or alteration to country, regional & segment scope*
The objective of the study is to define market sizes of different segments & countries in recent years and to forecast the values to the coming years. The report is designed to incorporate both qualitative and quantitative aspects of the industry within countries involved in the study.
The report also caters detailed information about the crucial aspects such as driving factors & challenges which will define the future growth of the market. Additionally, it also incorporates potential opportunities in micro markets for stakeholders to invest along with the detailed analysis of competitive landscape and product offerings of key players. The detailed segments and sub-segment of the market are explained below:
By Component
Solutions
Services
By Product
Enterprise Wearable Devices
Middleware Software
Cloud Platforms
Business Solutions
By Organization Size
Small-& Medium-sized Enterprises
Large Enterprises
By End Use Industry
BFSI
Healthcare & Life Sciences
Telecommunications & IT
Government & Public Sector
Manufacturing
Consumer Goods & Retail
Media & Entertainment
By Region:
North America
U.S.
Canada
Europe
UK
Germany
France
Spain
Italy
ROE
Asia Pacific
China
India
Japan
Australia
South Korea
RoAPAC
Latin America
Brazil
Mexico
RoLA
Rest of the World
Table of Contents
Chapter 1. Executive Summary
- 1.1. Market Snapshot
- 1.2. Global & Segmental Market Estimates & Forecasts, 2019-2029 (USD Billion)
- 1.2.1. Hyperconnectivity Market, by Region, 2019-2029 (USD Billion)
- 1.2.2. Hyperconnectivity Market, by Component, 2019-2029 (USD Billion)
- 1.2.3. Hyperconnectivity Market, by Product, 2019-2029 (USD Billion)
- 1.2.4. Hyperconnectivity Market, by Organization Size, 2019-2029 (USD Billion)
- 1.2.5. Hyperconnectivity Market, by End-Use Industry, 2019-2029 (USD Billion)
- 1.3. Key Trends
- 1.4. Estimation Methodology
- 1.5. Research Assumption
Chapter 2. Global Hyperconnectivity Market Definition and Scope
- 2.1. Objective of the Study
- 2.2. Market Definition & Scope
- 2.2.1. Scope of the Study
- 2.2.2. Industry Evolution
- 2.3. Years Considered for the Study
- 2.4. Currency Conversion Rates
Chapter 3. Global Hyperconnectivity Market Dynamics
- 3.1. Hyperconnectivity Market Impact Analysis (2019-2029)
- 3.1.1. Market Drivers
- 3.1.1.1. Increasing adoption of IoT technologies
- 3.1.1.2. Growing penetration of smartphones
- 3.1.1.3. Strategic initiatives from leading market players
- 3.1.2. Market Challenges
- 3.1.2.1. Data privacy & Security concerns
- 3.1.3. Market Opportunities
- 3.1.3.1. Rising emergence of high-speed internet connectivity in developing nations
- 3.1.3.2. Increasing adoption of hyperconnectivity solutions in organizations
- 3.1.1. Market Drivers
Chapter 4. Global Hyperconnectivity Market Industry Analysis
- 4.1. Porter's 5 Force Model
- 4.1.1. Bargaining Power of Suppliers
- 4.1.2. Bargaining Power of Buyers
- 4.1.3. Threat of New Entrants
- 4.1.4. Threat of Substitutes
- 4.1.5. Competitive Rivalry
- 4.2. Futuristic Approach to Porter's 5 Force Model (2019-2029)
- 4.3. PEST Analysis
- 4.3.1. Political
- 4.3.2. Economical
- 4.3.3. Social
- 4.3.4. Technological
- 4.4. Top investment opportunity
- 4.5. Top winning strategies
- 4.6. Industry Experts Prospective
- 4.7. Analyst Recommendation & Conclusion
Chapter 5. Risk Assessment: COVID-19 Impact
- 5.1. Assessment of the overall impact of COVID-19 on the industry
- 5.2. Pre COVID-19 and post COVID-19 Market scenario
Chapter 6. Global Hyperconnectivity Market, by Component
- 6.1. Market Snapshot
- 6.2. Global Hyperconnectivity Market by Component, Performance - Potential Analysis
- 6.3. Global Hyperconnectivity Market Estimates & Forecasts by Component 2019-2029 (USD Billion)
- 6.4. Hyperconnectivity Market, Sub Segment Analysis
- 6.4.1. Solutions
- 6.4.2. Services
Chapter 7. Global Hyperconnectivity Market, by Product
- 7.1. Market Snapshot
- 7.2. Global Hyperconnectivity Market by Product, Performance - Potential Analysis
- 7.3. Global Hyperconnectivity Market Estimates & Forecasts by Product 2019-2029 (USD Billion)
- 7.4. Hyperconnectivity Market, Sub Segment Analysis
- 7.4.1. Enterprise Wearable Devices
- 7.4.2. Middleware Software
- 7.4.3. Cloud Platforms
- 7.4.4. Business Solutions
Chapter 8. Global Hyperconnectivity Market, by Organization Size
- 8.1. Market Snapshot
- 8.2. Global Hyperconnectivity Market by Organization Size, Performance - Potential Analysis
- 8.3. Global Hyperconnectivity Market Estimates & Forecasts by Organization Size 2019-2029 (USD Billion)
- 8.4. Hyperconnectivity Market, Sub Segment Analysis
- 8.4.1. Small-& Medium-sized Enterprises
- 8.4.2. Large Enterprises
Chapter 9. Global Hyperconnectivity Market, by End-Use Industry
- 9.1. Market Snapshot
- 9.2. Global Hyperconnectivity Market by End-Use Industry, Performance - Potential Analysis
- 9.3. Global Hyperconnectivity Market Estimates & Forecasts by End-Use Industry 2019-2029 (USD Billion)
- 9.4. Hyperconnectivity Market, Sub Segment Analysis
- 9.4.1. BFSI
- 9.4.2. Healthcare & Life Sciences
- 9.4.3. Telecommunications & IT
- 9.4.4. Government & Public Sector
- 9.4.5. Manufacturing
- 9.4.6. Consumer Goods & Retail
- 9.4.7. Media & Entertainment
Chapter 10. Global Hyperconnectivity Market, Regional Analysis
- 10.1. Hyperconnectivity Market, Regional Market Snapshot
- 10.2. North America Hyperconnectivity Market
- 10.2.1. U.S. Hyperconnectivity Market
- 10.2.1.1. Component breakdown estimates & forecasts, 2019-2029
- 10.2.1.2. Product breakdown estimates & forecasts, 2019-2029
- 10.2.1.3. Organization Size breakdown estimates & forecasts, 2019-2029
- 10.2.1.4. End-Use Industry breakdown estimates & forecasts, 2019-2029
- 10.2.2. Canada Hyperconnectivity Market
- 10.2.1. U.S. Hyperconnectivity Market
- 10.3. Europe Hyperconnectivity Market Snapshot
- 10.3.1. U.K. Hyperconnectivity Market
- 10.3.2. Germany Hyperconnectivity Market
- 10.3.3. France Hyperconnectivity Market
- 10.3.4. Spain Hyperconnectivity Market
- 10.3.5. Italy Hyperconnectivity Market
- 10.3.6. Rest of Europe Hyperconnectivity Market
- 10.4. Asia-Pacific Hyperconnectivity Market Snapshot
- 10.4.1. China Hyperconnectivity Market
- 10.4.2. India Hyperconnectivity Market
- 10.4.3. Japan Hyperconnectivity Market
- 10.4.4. Australia Hyperconnectivity Market
- 10.4.5. South Korea Hyperconnectivity Market
- 10.4.6. Rest of Asia Pacific Hyperconnectivity Market
- 10.5. Latin America Hyperconnectivity Market Snapshot
- 10.5.1. Brazil Hyperconnectivity Market
- 10.5.2. Mexico Hyperconnectivity Market
- 10.5.3. Rest of Latin America Hyperconnectivity Market
- 10.6. Rest of The World Hyperconnectivity Market
Chapter 11. Competitive Intelligence
- 11.1. Top Market Strategies
- 11.2. Company Profiles
- 11.2.1. Avaya Holdings Corp.
- 11.2.1.1. Key Information
- 11.2.1.2. Overview
- 11.2.1.3. Financial (Subject to Data Availability)
- 11.2.1.4. Product Summary
- 11.2.1.5. Recent Developments
- 11.2.2. Extreme Networks
- 11.2.3. Fujitsu Limited
- 11.2.4. Iberdrola SA
- 11.2.5. International Business Machines Corporation
- 11.2.6. Microsoft Corporation
- 11.2.7. Orange IT Solutions
- 11.2.8. Oracle Corporation
- 11.2.9. PathPartner Technology
- 11.2.10. Broadcom Inc.
- 11.2.1. Avaya Holdings Corp.
Chapter 12. Research Process
- 12.1. Research Process
- 12.1.1. Data Mining
- 12.1.2. Analysis
- 12.1.3. Market Estimation
- 12.1.4. Validation
- 12.1.5. Publishing
- 12.2. Research Attributes
- 12.3. Research Assumption
LIST OF TABLES
- TABLE 1. Global Hyperconnectivity Market, report scope
- TABLE 2. Global Hyperconnectivity Market estimates & forecasts by Region 2019-2029 (USD Billion)
- TABLE 3. Global Hyperconnectivity Market estimates & forecasts by Component 2019-2029 (USD Billion)
- TABLE 4. Global Hyperconnectivity Market estimates & forecasts by Product 2019-2029 (USD Billion)
- TABLE 5. Global Hyperconnectivity Market estimates & forecasts by Organization Size 2019-2029 (USD Billion)
- TABLE 6. Global Hyperconnectivity Market estimates & forecasts by End-Use Industry 2019-2029 (USD Billion)
- TABLE 7. Global Hyperconnectivity Market by segment, estimates & forecasts, 2019-2029 (USD Billion)
- TABLE 8. Global Hyperconnectivity Market by region, estimates & forecasts, 2019-2029 (USD Billion)
- TABLE 9. Global Hyperconnectivity Market by segment, estimates & forecasts, 2019-2029 (USD Billion)
- TABLE 10. Global Hyperconnectivity Market by region, estimates & forecasts, 2019-2029 (USD Billion)
- TABLE 11. Global Hyperconnectivity Market by segment, estimates & forecasts, 2019-2029 (USD Billion)
- TABLE 12. Global Hyperconnectivity Market by region, estimates & forecasts, 2019-2029 (USD Billion)
- TABLE 13. Global Hyperconnectivity Market by segment, estimates & forecasts, 2019-2029 (USD Billion)
- TABLE 14. Global Hyperconnectivity Market by region, estimates & forecasts, 2019-2029 (USD Billion)
- TABLE 15. Global Hyperconnectivity Market by segment, estimates & forecasts, 2019-2029 (USD Billion)
- TABLE 16. Global Hyperconnectivity Market by region, estimates & forecasts, 2019-2029 (USD Billion)
- TABLE 17. U.S. Hyperconnectivity Market estimates & forecasts, 2019-2029 (USD Billion)
- TABLE 18. U.S. Hyperconnectivity Market estimates & forecasts by segment 2019-2029 (USD Billion)
- TABLE 19. U.S. Hyperconnectivity Market estimates & forecasts by segment 2019-2029 (USD Billion)
- TABLE 20. Canada Hyperconnectivity Market estimates & forecasts, 2019-2029 (USD Billion)
- TABLE 21. Canada Hyperconnectivity Market estimates & forecasts by segment 2019-2029 (USD Billion)
- TABLE 22. Canada Hyperconnectivity Market estimates & forecasts by segment 2019-2029 (USD Billion)
- TABLE 23. UK Hyperconnectivity Market estimates & forecasts, 2019-2029 (USD Billion)
- TABLE 24. UK Hyperconnectivity Market estimates & forecasts by segment 2019-2029 (USD Billion)
- TABLE 25. UK Hyperconnectivity Market estimates & forecasts by segment 2019-2029 (USD Billion)
- TABLE 26. Germany Hyperconnectivity Market estimates & forecasts, 2019-2029 (USD Billion)
- TABLE 27. Germany Hyperconnectivity Market estimates & forecasts by segment 2019-2029 (USD Billion)
- TABLE 28. Germany Hyperconnectivity Market estimates & forecasts by segment 2019-2029 (USD Billion)
- TABLE 29. France Hyperconnectivity Market estimates & forecasts, 2019-2029 (USD Billion)
- TABLE 30. France Hyperconnectivity Market estimates & forecasts by segment 2019-2029 (USD Billion)
- TABLE 31. France Hyperconnectivity Market estimates & forecasts by segment 2019-2029 (USD Billion)
- TABLE 32. Italy Hyperconnectivity Market estimates & forecasts, 2019-2029 (USD Billion)
- TABLE 33. Italy Hyperconnectivity Market estimates & forecasts by segment 2019-2029 (USD Billion)
- TABLE 34. Italy Hyperconnectivity Market estimates & forecasts by segment 2019-2029 (USD Billion)
- TABLE 35. Spain Hyperconnectivity Market estimates & forecasts, 2019-2029 (USD Billion)
- TABLE 36. Spain Hyperconnectivity Market estimates & forecasts by segment 2019-2029 (USD Billion)
- TABLE 37. Spain Hyperconnectivity Market estimates & forecasts by segment 2019-2029 (USD Billion)
- TABLE 38. RoE Hyperconnectivity Market estimates & forecasts, 2019-2029 (USD Billion)
- TABLE 39. RoE Hyperconnectivity Market estimates & forecasts by segment 2019-2029 (USD Billion)
- TABLE 40. RoE Hyperconnectivity Market estimates & forecasts by segment 2019-2029 (USD Billion)
- TABLE 41. China Hyperconnectivity Market estimates & forecasts, 2019-2029 (USD Billion)
- TABLE 42. China Hyperconnectivity Market estimates & forecasts by segment 2019-2029 (USD Billion)
- TABLE 43. China Hyperconnectivity Market estimates & forecasts by segment 2019-2029 (USD Billion)
- TABLE 44. India Hyperconnectivity Market estimates & forecasts, 2019-2029 (USD Billion)
- TABLE 45. India Hyperconnectivity Market estimates & forecasts by segment 2019-2029 (USD Billion)
- TABLE 46. India Hyperconnectivity Market estimates & forecasts by segment 2019-2029 (USD Billion)
- TABLE 47. Japan Hyperconnectivity Market estimates & forecasts, 2019-2029 (USD Billion)
- TABLE 48. Japan Hyperconnectivity Market estimates & forecasts by segment 2019-2029 (USD Billion)
- TABLE 49. Japan Hyperconnectivity Market estimates & forecasts by segment 2019-2029 (USD Billion)
- TABLE 50. South Korea Hyperconnectivity Market estimates & forecasts, 2019-2029 (USD Billion)
- TABLE 51. South Korea Hyperconnectivity Market estimates & forecasts by segment 2019-2029 (USD Billion)
- TABLE 52. South Korea Hyperconnectivity Market estimates & forecasts by segment 2019-2029 (USD Billion)
- TABLE 53. Australia Hyperconnectivity Market estimates & forecasts, 2019-2029 (USD Billion)
- TABLE 54. Australia Hyperconnectivity Market estimates & forecasts by segment 2019-2029 (USD Billion)
- TABLE 55. Australia Hyperconnectivity Market estimates & forecasts by segment 2019-2029 (USD Billion)
- TABLE 56. RoAPAC Hyperconnectivity Market estimates & forecasts, 2019-2029 (USD Billion)
- TABLE 57. RoAPAC Hyperconnectivity Market estimates & forecasts by segment 2019-2029 (USD Billion)
- TABLE 58. RoAPAC Hyperconnectivity Market estimates & forecasts by segment 2019-2029 (USD Billion)
- TABLE 59. Brazil Hyperconnectivity Market estimates & forecasts, 2019-2029 (USD Billion)
- TABLE 60. Brazil Hyperconnectivity Market estimates & forecasts by segment 2019-2029 (USD Billion)
- TABLE 61. Brazil Hyperconnectivity Market estimates & forecasts by segment 2019-2029 (USD Billion)
- TABLE 62. Mexico Hyperconnectivity Market estimates & forecasts, 2019-2029 (USD Billion)
- TABLE 63. Mexico Hyperconnectivity Market estimates & forecasts by segment 2019-2029 (USD Billion)
- TABLE 64. Mexico Hyperconnectivity Market estimates & forecasts by segment 2019-2029 (USD Billion)
- TABLE 65. RoLA Hyperconnectivity Market estimates & forecasts, 2019-2029 (USD Billion)
- TABLE 66. RoLA Hyperconnectivity Market estimates & forecasts by segment 2019-2029 (USD Billion)
- TABLE 67. RoLA Hyperconnectivity Market estimates & forecasts by segment 2019-2029 (USD Billion)
- TABLE 68. Row Hyperconnectivity Market estimates & forecasts, 2019-2029 (USD Billion)
- TABLE 69. Row Hyperconnectivity Market estimates & forecasts by segment 2019-2029 (USD Billion)
- TABLE 70. Row Hyperconnectivity Market estimates & forecasts by segment 2019-2029 (USD Billion)
- TABLE 71. List of secondary sources, used in the study of global Hyperconnectivity Market
- TABLE 72. List of primary sources, used in the study of global Hyperconnectivity Market
- TABLE 73. Years considered for the study
- TABLE 74. Exchange rates considered
List of tables and figures and dummy in nature, final lists may vary in the final deliverable
LIST OF FIGURES
List of figures
- FIG 1. Global Hyperconnectivity Market, research methodology
- FIG 2. Global Hyperconnectivity Market, Market estimation techniques
- FIG 3. Global Market size estimates & forecast methods
- FIG 4. Global Hyperconnectivity Market, key trends 2021
- FIG 5. Global Hyperconnectivity Market, growth prospects 2022-2029
- FIG 6. Global Hyperconnectivity Market, porters 5 force model
- FIG 7. Global Hyperconnectivity Market, pest analysis
- FIG 8. Global Hyperconnectivity Market, value chain analysis
- FIG 9. Global Hyperconnectivity Market by segment, 2019 & 2029 (USD Billion)
- FIG 10. Global Hyperconnectivity Market by segment, 2019 & 2029 (USD Billion)
- FIG 11. Global Hyperconnectivity Market by segment, 2019 & 2029 (USD Billion)
- FIG 12. Global Hyperconnectivity Market by segment, 2019 & 2029 (USD Billion)
- FIG 13. Global Hyperconnectivity Market by segment, 2019 & 2029 (USD Billion)
- FIG 14. Global Hyperconnectivity Market, regional snapshot 2019 & 2029
- FIG 15. North America Hyperconnectivity Market 2019 & 2029 (USD Billion)
- FIG 16. Europe Hyperconnectivity Market 2019 & 2029 (USD Billion)
- FIG 17. Asia Pacific Hyperconnectivity Market 2019 & 2029 (USD Billion)
- FIG 18. Latin America Hyperconnectivity Market 2019 & 2029 (USD Billion)
- FIG 19. Global Hyperconnectivity Market, company Market share analysis (2021)
List of tables and figures and dummy in nature, final lists may vary in the final deliverable
 超連結市場 - 全球產業規模、佔有率、趨勢、機會和預測,按組件、產品、組織規模、最終用途、地區、競爭細分,2018-2028 年
 超級連接市場:當前分析和預測 (2022-2028)
 超連接市場:按組件、按產品、按組織規模、按行業:2021-2031 年全球機遇分析和行業預測
 全球超連接市場規模、份額、行業趨勢分析報告:按組件、按產品、按組織規模(大型企業、中小企業)、按最終用途、按地區、展望和預測,2022-2028 年
 超連接市場規模、份額和趨勢分析報告:按組件、按產品、按組織規模、按最終用途、按地區、按細分市場預測,2022-2030 年