


 |
市場調查報告書
商品編碼
1151972
Volt/VAR系統全球市場規模調查,按解決方案(電壓/VAR控制、配電電壓優化、維護電壓降低、配電電壓/VAR控制)2022-2028區域預測Global Volt/VAR systems Market Size study, By Solution (Volt/VAR Control, Distribution Voltage Optimization, Conservation Voltage Reduction, Distribution Volt/VAR Control), and Regional Forecasts 2022-2028 |
||||||
VVO(電壓/無功優化)是指優化管理電壓和無功功率以實現更高效的電網運行的過程。
VVO 系統調節無功功率並管理電壓,以抵消太陽能對電網的影響。 Volt-VAR 系統由各種組件組成,包括硬件和軟件。全球電力需求不斷增長、可再生能源的日益整合、對能源效率和系統電壓的興趣日益濃厚,這些都是推動全球市場需求的因素。例如,國際能源署(IEA)公佈,2019年全球總用電量達到22848太瓦時,比2018年增長超過1.7%。此外,2020 年英國用電量估計為 287.32 TWh,到 2021 年將進一步上升至 294.4 TWh。此外,市場領導者正在推出創新解決方案,以利用對 Vola/VAR 系統不斷增長的需求。例如,2019 年 2 月,總部位於法國的施耐德電氣宣布推出 Ecostruxure Power 2.0。 EcoStruxure Power 架構使用 EcoStruxure Microgrid Operation 來管理分佈式能源 (DER) 和保護系統,以提高微電網的穩定性和效率。此外,配電行業自動化程度的提高和對新可再生能源項目投資的增加預計將在預測期內刺激市場需求。然而,與 Volt/VAR 系統相關的高安裝成本阻礙了 2022-2028 年預測期內的市場增長。
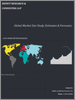
Volt/VAR 系統全球市場研究考慮的主要區域是亞太地區、北美、歐洲、拉丁美洲和世界其他地區。由於電力和配電行業的增長以及主要參與者的存在,北美在市場份額方面已成為世界領先地區。另一方面,預計亞太地區在 2022-2028 年的預測期內將呈現顯著的增長率。可再生能源行業的蓬勃發展和該地區用電量的增加等因素將為亞太地區的 Volt/VAR 系統市場創造良好的增長前景。
本報告中包含的主要市場參與者包括:
- ABB
- General Electric Company
- Schneider Electric
- Siemens AG
- Silver Spring Networks
- Beckwith Electric Co., Inc
- Eaton
- GRIDCO SYSTEMS
- S&C Electric Company
- Varentec
這項研究的目的是確定近年來各個細分市場和國家/地區的市場規模,並預測未來八年的價值。本報告旨在捕捉每個被調查地區和國家的行業定性和定量方面的情況。此外,它還提供了有關關鍵方面的詳細信息,例如將定義市場未來增長的驅動因素和挑戰。此外,該報告還應包含對主要參與者的競爭格局和產品供應的詳細分析,以及微觀市場中可供利益相關者投資的可用機會。市場的詳細細分和子細分如下所述。
按解決方案
電壓/無功控制
配電電壓優化
降低存儲電壓
配電電壓/VAR 控制
按地區
北美
美國
加拿大
歐洲
英國
德國
法國
西班牙
意大利
其他歐洲
亞太地區
中國
印度
日本
澳大利亞
韓國
其他亞太地區
拉丁美洲
巴西
墨西哥
世界其他地方
此外,本研究中考慮的年份是:
實際年份 - 2018, 2019, 2020
基準年 2021
預測期:2022-2028
本報告的目標受眾是全球 Volt/VAR 系統市場。
主要諮詢公司和顧問
大公司、中型公司、中小企業
風險投資
增值經銷商 (VAR)
第三方知識提供者
投資銀行家
投資人
內容
第 1 章執行摘要
- 市場概況
- 2020-2028 年全球市場細分的估計和預測
- 2020 年至 2028 年按地區分列的全球伏特/無功功率系統市場
- 2020-2028 年按解決方案劃分的 Volt/VAR 系統全球市場
- 主要趨勢
- 調查方法
- 調查先決條件
第 2 章 Volt/VAR 系統全球市場的定義和範圍
- 調查的目的
- 市場定義和範圍
- 調查範圍
- 工業發展
- 調查年份
- 貨幣兌換率
第 3 章 Volt/VAR 系統的全球市場動態
- Volt/VAR 系統市場影響分析(2020 年至 2028 年)
- 市場驅動因素
- 全球電力需求增加
- 可再生能源並網規模不斷擴大
- 人們越來越關注能效和系統電壓
- 市場挑戰
- 初始成本高
- 市場機會
- 推動配電行業的自動化
- 增加對可再生能源項目的投資
- 市場驅動因素
第 4 章全球電壓/VAR 系統市場行業分析
- 波特 5 力模型
- 供應商的議價能力
- 買家的議價能力
- 新進入者的威脅
- 替代品的威脅
- 競爭公司之間的敵對關係
- 波特 5 力模型的未來方法 (2018-2028)
- 害蟲分析
- 政治
- 經濟的
- 社交
- 技術
- 投資招聘模式
- 分析師的結論和建議
- 頂級投資機會
- 關鍵成功策略
第 5 章風險評估:COVID-19 的影響
- 評估 COVID-19 對行業的總體影響
- COVID-19 之前和 COVID-19 之後的市場情景
第 6 章全球 Volt/VAR 系統市場,按解決方案
- 市場概況
- Volt/VAR 系統全球市場:按解決方案分類的性能、潛力分析
- 2018-2028 年 Volt/VAR 系統全球市場、按解決方案估算和預測
- Volt/VAR 系統全球市場細分分析
- VOLT/VAR 控制
- 優化配電電壓
- 降低存儲電壓
- 配電 VOLT/VAR 控制
第 7 章全球 Volt/VAR 系統市場,區域分析
- Volt/VAR 系統市場,區域市場概況
- 北美
- 美國
- 2018-2028 年解決方案的估計和預測
- 加拿大
- 美國
- 歐洲 Volt/VAR 系統市場概況
- 英國
- 德國
- 法國
- 西班牙
- 意大利
- 其他歐洲地區
- 亞太地區 Volt/VAR 系統市場概況
- 中國
- 印度
- 日本
- 澳大利亞
- 韓國
- 其他亞太地區
- 拉丁美洲 Volt/VAR 系統市場概況
- 巴西
- 墨西哥
- 世界其他地區
第 8 章衝突信息
- 頂級市場策略
- 公司簡介
- ABB
- 主要信息
- 概覽
- 財務(取決於數據可用性)
- 產品概覽
- 近期發展狀況
- General Electric Company
- Schneider Electric
- Siemens AG
- Silver Spring Networks
- Beckwith Electric Co., Inc
- Eaton
- GRIDCO SYSTEMS
- S&C Electric Company
- Varentec
- ABB
第 9 章研究過程
- 研究過程
- 數據挖掘
- 分析
- 市場評估
- 驗證
- 出版
- 調查屬性
- 調查先決條件
Global Volt/VAR systems Market is valued approximately USD XX million in 2021 and is anticipated to grow with a healthy growth rate of more than XX % over the forecast period 2022-2028.
Volt/VAR optimization (VVO) refers to a process of optimally managing voltage levels and reactive power to achieve more efficient gird operation. Volt-VAr Systems regulate reactive power to manage voltage and offsets the impact of solar generation on the grid. Volt/VAR System comprised of different components such as hardware, and software. The rising electricity demand worldwide and growing expansion of renewable power integration as well as increasing concern over energy efficiency and system voltages are factors that are accelerating the global market demand. For instance, as per International Energy Agency (IEA)- In 2019, total electricity consumption worldwide reached to 22 848 TWh, witnessing an increase of over 1.7% from 2018. Furthermore, in 2020, the UK's electricity consumption was estimated at 287.32 TWh and it further increased to 294.4 TWh in 2021. Further, leading market players are coming up with innovative solutions to leverage the growing demand for Vola/VAR Systems. For instance, In February 2019, France based Schneider Electric unveiled the Ecostruxure Power 2.0. The EcoStruxure Power architecture uses EcoStruxure Microgrid Operation to manage the Distributed Energy Resources (DER) and the protection systems for increased microgrid stability and efficiency. Also, growing automation in Power distribution Sector and increasing investment towards new renewable energy projects are anticipated to act as a catalyzing factor for the market demand during the forecast period. However, high deployment cost associated with Volt/VAR systems impede the growth of the market over the forecast period of 2022-2028.
The key regions considered for the global Volt/VAR systems Market study include Asia Pacific, North America, Europe, Latin America, and the Rest of the World. North America is the leading region across the world in terms of market share owing to the growing power and distribution sector as well as presence of leading market players. Whereas, Asia Pacific is anticipated to exhibit a significant growth rate over the forecast period 2022-2028. Factors such as the thriving growth of the renewable energy sector and rising electricity consumption in the region, would create lucrative growth prospects for the Volt/VAR systems Market across the Asia Pacific region.
Major market players included in this report are:
ABB
General Electric Company
Schneider Electric
Siemens AG
Silver Spring Networks
Beckwith Electric Co., Inc
Eaton
GRIDCO SYSTEMS
S&C Electric Company
Varentec
The objective of the study is to define market sizes of different segments & countries in recent years and to forecast the values to the coming eight years. The report is designed to incorporate both qualitative and quantitative aspects of the industry within each of the regions and countries involved in the study. Furthermore, the report also caters the detailed information about the crucial aspects such as driving factors & challenges which will define the future growth of the market. Additionally, the report shall also incorporate available opportunities in micro markets for stakeholders to invest along with the detailed analysis of competitive landscape and product offerings of key players. The detailed segments and sub-segment of the market are explained below:
By Solution
Volt/VAR Control
Distribution Voltage Optimization
Conservation Voltage Reduction
Distribution Volt/VAR Control
By Region:
North America
U.S.
Canada
Europe
UK
Germany
France
Spain
Italy
ROE
Asia Pacific
China
India
Japan
Australia
South Korea
RoAPAC
Latin America
Brazil
Mexico
Rest of the World
Furthermore, years considered for the study are as follows:
Historical year - 2018, 2019, 2020
Base year - 2021
Forecast period: 2022 to 2028
Target Audience of the Global Volt/VAR systems Market in Market Study:
Key Consulting Companies & Advisors
Large, medium-sized, and small enterprises
Venture capitalists
Value-Added Resellers (VARs)
Third-party knowledge providers
Investment bankers
Investors
Table of Contents
Chapter 1. Executive Summary
- 1.1. Market Snapshot
- 1.2. Global & Segmental Market Estimates & Forecasts, 2020-2028 (USD Million)
- 1.2.1. Global Volt/VAR systems Market, by Region, 2020-2028 (USD Million)
- 1.2.2. Global Volt/VAR systems Market, by Solution, 2020-2028 (USD Million)
- 1.3. Key Trends
- 1.4. Estimation Methodology
- 1.5. Research Assumption
Chapter 2. Global Volt/VAR systems Market Definition and Scope
- 2.1. Objective of the Study
- 2.2. Market Definition & Scope
- 2.2.1. Scope of the Study
- 2.2.2. Industry Evolution
- 2.3. Years Considered for the Study
- 2.4. Currency Conversion Rates
Chapter 3. Global Volt/VAR systems Market Dynamics
- 3.1. Volt/VAR systems Market Impact Analysis (2020-2028)
- 3.1.1. Market Drivers
- 3.1.1.1. Growing electricity demand worldwide.
- 3.1.1.2. Rising expansion of renewable power integration
- 3.1.1.3. Increasing concern over energy efficiency and system voltages
- 3.1.2. Market Challenges
- 3.1.2.1. High initial cost requirement.
- 3.1.3. Market Opportunities
- 3.1.3.1. Growing automation in Power distribution Sector.
- 3.1.3.2. Increasing investment towards new renewable energy projects.
- 3.1.1. Market Drivers
Chapter 4. Global Volt/VAR systems Market Industry Analysis
- 4.1. Porter's 5 Force Model
- 4.1.1. Bargaining Power of Suppliers
- 4.1.2. Bargaining Power of Buyers
- 4.1.3. Threat of New Entrants
- 4.1.4. Threat of Substitutes
- 4.1.5. Competitive Rivalry
- 4.1.6. Futuristic Approach to Porter's 5 Force Model (2018-2028)
- 4.2. PEST Analysis
- 4.2.1. Political
- 4.2.2. Economical
- 4.2.3. Social
- 4.2.4. Technological
- 4.3. Investment Adoption Model
- 4.4. Analyst Recommendation & Conclusion
- 4.5. Top investment opportunity
- 4.6. Top winning strategies
Chapter 5. Risk Assessment: COVID-19 Impact
- 5.1.1. Assessment of the overall impact of COVID-19 on the industry
- 5.1.2. Pre COVID-19 and post COVID-19 Market scenario
Chapter 6. Global Volt/VAR systems Market, by Solution
- 6.1. Market Snapshot
- 6.2. Global Volt/VAR systems Market by Solution, Performance - Potential Analysis
- 6.3. Global Volt/VAR systems Market Estimates & Forecasts by Solution 2018-2028 (USD Million)
- 6.4. Volt/VAR systems Market, Sub Segment Analysis
- 6.4.1. VOLT/VAR Control
- 6.4.2. Distribution Voltage Optimization
- 6.4.3. Conservation Voltage Reduction
- 6.4.4. Distribution VOLT/VAR Control
Chapter 7. Global Volt/VAR systems Market, Regional Analysis
- 7.1. Volt/VAR systems Market, Regional Market Snapshot
- 7.2. North America Volt/VAR systems Market
- 7.2.1. U.S. Volt/VAR systems Market
- 7.2.1.1. Solution estimates & forecasts, 2018-2028
- 7.2.2. Canada Volt/VAR systems Market
- 7.2.1. U.S. Volt/VAR systems Market
- 7.3. Europe Volt/VAR systems Market Snapshot
- 7.3.1. U.K. Volt/VAR systems Market
- 7.3.2. Germany Volt/VAR systems Market
- 7.3.3. France Volt/VAR systems Market
- 7.3.4. Spain Volt/VAR systems Market
- 7.3.5. Italy Volt/VAR systems Market
- 7.3.6. Rest of Europe Volt/VAR systems Market
- 7.4. Asia-Pacific Volt/VAR systems Market Snapshot
- 7.4.1. China Volt/VAR systems Market
- 7.4.2. India Volt/VAR systems Market
- 7.4.3. Japan Volt/VAR systems Market
- 7.4.4. Australia Volt/VAR systems Market
- 7.4.5. South Korea Volt/VAR systems Market
- 7.4.6. Rest of Asia Pacific Volt/VAR systems Market
- 7.5. Latin America Volt/VAR systems Market Snapshot
- 7.5.1. Brazil Volt/VAR systems Market
- 7.5.2. Mexico Volt/VAR systems Market
- 7.6. Rest of The World Volt/VAR systems Market
Chapter 8. Competitive Intelligence
- 8.1. Top Market Strategies
- 8.2. Company Profiles
- 8.2.1. ABB
- 8.2.1.1. Key Information
- 8.2.1.2. Overview
- 8.2.1.3. Financial (Subject to Data Availability)
- 8.2.1.4. Product Summary
- 8.2.1.5. Recent Developments
- 8.2.2. General Electric Company
- 8.2.3. Schneider Electric
- 8.2.4. Siemens AG
- 8.2.5. Silver Spring Networks
- 8.2.6. Beckwith Electric Co., Inc
- 8.2.7. Eaton
- 8.2.8. GRIDCO SYSTEMS
- 8.2.9. S&C Electric Company
- 8.2.10. Varentec
- 8.2.1. ABB
Chapter 9. Research Process
- 9.1. Research Process
- 9.1.1. Data Mining
- 9.1.2. Analysis
- 9.1.3. Market Estimation
- 9.1.4. Validation
- 9.1.5. Publishing
- 9.2. Research Attributes
- 9.3. Research Assumption
LIST OF TABLES
- TABLE 1. Global Volt/VAR systems Market, report scope
- TABLE 2. Global Volt/VAR systems Market estimates & forecasts by Region 2018-2028 (USD Million)
- TABLE 3. Global Volt/VAR systems Market estimates & forecasts by Solution 2018-2028 (USD Million)
- TABLE 4. Global Volt/VAR systems Market by segment, estimates & forecasts, 2018-2028 (USD Million)
- TABLE 5. Global Volt/VAR systems Market by region, estimates & forecasts, 2018-2028 (USD Million)
- TABLE 6. Global Volt/VAR systems Market by segment, estimates & forecasts, 2018-2028 (USD Million)
- TABLE 7. Global Volt/VAR systems Market by region, estimates & forecasts, 2018-2028 (USD Million)
- TABLE 8. Global Volt/VAR systems Market by segment, estimates & forecasts, 2018-2028 (USD Million)
- TABLE 9. Global Volt/VAR systems Market by region, estimates & forecasts, 2018-2028 (USD Million)
- TABLE 10. Global Volt/VAR systems Market by segment, estimates & forecasts, 2018-2028 (USD Million)
- TABLE 11. Global Volt/VAR systems Market by region, estimates & forecasts, 2018-2028 (USD Million)
- TABLE 12. Global Volt/VAR systems Market by segment, estimates & forecasts, 2018-2028 (USD Million)
- TABLE 13. Global Volt/VAR systems Market by region, estimates & forecasts, 2018-2028 (USD Million)
- TABLE 14. U.S. Volt/VAR systems Market estimates & forecasts, 2018-2028 (USD Million)
- TABLE 15. U.S. Volt/VAR systems Market estimates & forecasts by segment 2018-2028 (USD Million)
- TABLE 16. U.S. Volt/VAR systems Market estimates & forecasts by segment 2018-2028 (USD Million)
- TABLE 17. Canada Volt/VAR systems Market estimates & forecasts, 2018-2028 (USD Million)
- TABLE 18. Canada Volt/VAR systems Market estimates & forecasts by segment 2018-2028 (USD Million)
- TABLE 19. Canada Volt/VAR systems Market estimates & forecasts by segment 2018-2028 (USD Million)
- TABLE 20. UK Volt/VAR systems Market estimates & forecasts, 2018-2028 (USD Million)
- TABLE 21. UK Volt/VAR systems Market estimates & forecasts by segment 2018-2028 (USD Million)
- TABLE 22. UK Volt/VAR systems Market estimates & forecasts by segment 2018-2028 (USD Million)
- TABLE 23. Germany Volt/VAR systems Market estimates & forecasts, 2018-2028 (USD Million)
- TABLE 24. Germany Volt/VAR systems Market estimates & forecasts by segment 2018-2028 (USD Million)
- TABLE 25. Germany Volt/VAR systems Market estimates & forecasts by segment 2018-2028 (USD Million)
- TABLE 26. RoE Volt/VAR systems Market estimates & forecasts, 2018-2028 (USD Million)
- TABLE 27. RoE Volt/VAR systems Market estimates & forecasts by segment 2018-2028 (USD Million)
- TABLE 28. RoE Volt/VAR systems Market estimates & forecasts by segment 2018-2028 (USD Million)
- TABLE 29. China Volt/VAR systems Market estimates & forecasts, 2018-2028 (USD Million)
- TABLE 30. China Volt/VAR systems Market estimates & forecasts by segment 2018-2028 (USD Million)
- TABLE 31. China Volt/VAR systems Market estimates & forecasts by segment 2018-2028 (USD Million)
- TABLE 32. India Volt/VAR systems Market estimates & forecasts, 2018-2028 (USD Million)
- TABLE 33. India Volt/VAR systems Market estimates & forecasts by segment 2018-2028 (USD Million)
- TABLE 34. India Volt/VAR systems Market estimates & forecasts by segment 2018-2028 (USD Million)
- TABLE 35. Japan Volt/VAR systems Market estimates & forecasts, 2018-2028 (USD Million)
- TABLE 36. Japan Volt/VAR systems Market estimates & forecasts by segment 2018-2028 (USD Million)
- TABLE 37. Japan Volt/VAR systems Market estimates & forecasts by segment 2018-2028 (USD Million)
- TABLE 38. RoAPAC Volt/VAR systems Market estimates & forecasts, 2018-2028 (USD Million)
- TABLE 39. RoAPAC Volt/VAR systems Market estimates & forecasts by segment 2018-2028 (USD Million)
- TABLE 40. RoAPAC Volt/VAR systems Market estimates & forecasts by segment 2018-2028 (USD Million)
- TABLE 41. Brazil Volt/VAR systems Market estimates & forecasts, 2018-2028 (USD Million)
- TABLE 42. Brazil Volt/VAR systems Market estimates & forecasts by segment 2018-2028 (USD Million)
- TABLE 43. Brazil Volt/VAR systems Market estimates & forecasts by segment 2018-2028 (USD Million)
- TABLE 44. Mexico Volt/VAR systems Market estimates & forecasts, 2018-2028 (USD Million)
- TABLE 45. Mexico Volt/VAR systems Market estimates & forecasts by segment 2018-2028 (USD Million)
- TABLE 46. Mexico Volt/VAR systems Market estimates & forecasts by segment 2018-2028 (USD Million)
- TABLE 47. RoLA Volt/VAR systems Market estimates & forecasts, 2018-2028 (USD Million)
- TABLE 48. RoLA Volt/VAR systems Market estimates & forecasts by segment 2018-2028 (USD Million)
- TABLE 49. RoLA Volt/VAR systems Market estimates & forecasts by segment 2018-2028 (USD Million)
- TABLE 50. Row Volt/VAR systems Market estimates & forecasts, 2018-2028 (USD Million)
- TABLE 51. Row Volt/VAR systems Market estimates & forecasts by segment 2018-2028 (USD Million)
- TABLE 52. Row Volt/VAR systems Market estimates & forecasts by segment 2018-2028 (USD Million)
- TABLE 53. List of secondary sources, used in the study of global Volt/VAR systems Market
- TABLE 54. List of primary sources, used in the study of global Volt/VAR systems Market
- TABLE 55. Years considered for the study
- TABLE 56. Exchange rates considered
LIST OF FIGURES
List of figures
- FIG 1. Global Volt/VAR systems Market, research methodology
- FIG 2. Global Volt/VAR systems Market, Market estimation techniques
- FIG 3. Global Market size estimates & forecast methods
- FIG 4. Global Volt/VAR systems Market, key trends 2021
- FIG 5. Global Volt/VAR systems Market, growth prospects 2022-2028
- FIG 6. Global Volt/VAR systems Market, porters 5 force model
- FIG 7. Global Volt/VAR systems Market, pest analysis
- FIG 8. Global Volt/VAR systems Market, value chain analysis
- FIG 9. Global Volt/VAR systems Market by segment, 2018 & 2028 (USD Million)
- FIG 10. Global Volt/VAR systems Market by segment, 2018 & 2028 (USD Million)
- FIG 11. Global Volt/VAR systems Market by segment, 2018 & 2028 (USD Million)
- FIG 12. Global Volt/VAR systems Market by segment, 2018 & 2028 (USD Million)
- FIG 13. Global Volt/VAR systems Market by segment, 2018 & 2028 (USD Million)
- FIG 14. Global Volt/VAR systems Market, regional snapshot 2018 & 2028
- FIG 15. North America Volt/VAR systems Market 2018 & 2028 (USD Million)
- FIG 16. Europe Volt/VAR systems Market 2018 & 2028 (USD Million)
- FIG 17. Asia pacific Market 2018 & 2028 (USD Million)
- FIG 18. Latin America Volt/VAR systems Market 2018 & 2028 (USD Million)
- FIG 19. Global Volt/VAR systems Market, company Market share analysis (2021)


