


 |
市場調查報告書
商品編碼
1757090
連接器產業年鑑:2025年2025 Connector Industry Yearbook |
||||||
Bishop & Associates 每年都會根據上市連接器公司提供的年鑑編製 "連接器產業年鑑" 。年鑑會整合過去 10 年、5 年和當年的損益表和資產負債表,為產業和上市公司的整體績效提供基準。
此外,本報告也回顧了連接器產業2014年至2024年按地區和終端設備細分市場的收入情況,以及我們對2025年和2030年按地區和終端設備細分市場的最新預測。
本報告的特點
上市公司的合併歷史記錄,包括:
- 主要財務指標(2014年~2024年)
- 資產負債表 (2014年~2024年)
- 損益清單 (2014年~2024年)
- 資產負債表百分率(2014年~2024年)
- 損益清單百分率(2014年~2024年)
使用以下財務指標的行業平均值,按公司劃分的15年業績趨勢指標:
- 銷售、一般及管理費用 (2010-2024)
- 淨利率 (2010-2024)
- 資產報酬率 (2010-2024)
- 長期負債/權益比率 (2010-2024)
- 應收帳款週轉率 (2010-2024)
- 存貨週轉率 (2010-2024)
- 銷售成本比率 (2010-2024)
- 銷售成本+銷售、一般及管理費用比率 (2010-2024)
- 流動比率 (2010-2024)
- 股權報酬率 (2010-2024)
- 負債權益比(2010-2024)
- 平均投資回收期 (2010-2024)
- 庫存天數 (2010-2024)
2024 年年鑑公司淨利佔銷售額的百分比
下表顯示了 2025 年連接器產業年鑑中上市公司 2014 年至 2024 年的淨利潤佔銷售額的百分比。
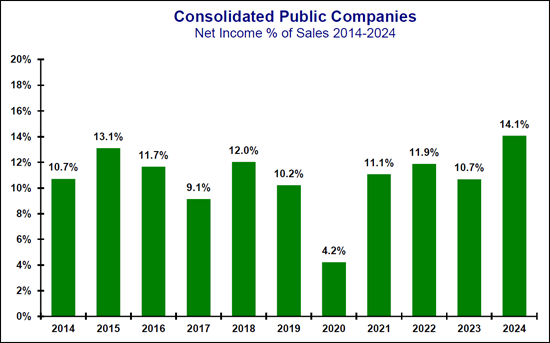
淨利
2024 年連接器產業平均淨利佔銷售額的 14.1%。 2018年對美國來說是重要的一年,因為這一年 "減稅與就業法案" 獲得通過。該法案將聯邦企業稅率從35%降至21%。受全球新冠疫情影響,2020年淨利佔銷售額的比重降至最低,僅4.2%。 2015年至2019年,淨利潤佔銷售額的比例從2015年的13.1%下降到2019年的10.2%。 2020年至2024年,淨利潤佔銷售額的比例從2020年的4.2%上升到2024年的14.1%。
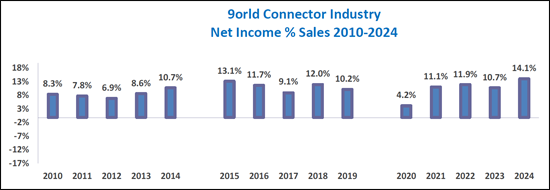
下圖是2010年至2024年連接器產業淨利的歷史走勢。
目錄
開端
第1章 全球電子連接器產業
- 過去10年(2014年~2024年)
- 過去5年(2019年~2024年)
- 去年~2024年
- 設備部門的銷售額(2022年~2024年)
- 設備各部門銷售額
- 各地區2025年和2030年的預測
- 主要的技術趨勢
- 前置作業時間
- 價格趨勢
第2章 重要的事件
第3章 -連合主要業績評估指標
整合主要業績指標
各企業業績履歷
銷貨成本
銷售費及一般管理費(SG&A)
銷貨成本+銷售費及一般管理費
淨利的轉變
流動比率
資產報酬率
股本報酬率
長期債務/資本
負債對資本
應收賬款週轉率
平均收集期間
存貨週轉率
庫存日數
第4章 選擇企業的業績履歷
主要企業的業績履歷
Amphenol Corporatio
- 主要財務指標
- 表(圖表):主要財務指標
- 資產負債表(美元)(2014年~2024年)
- 資產負債表(%)(2014年~2024年)
- 損益清單(美元)(2014年~2024年)
- 損益清單的比例(2014年~2024年)
Cheng Uei Precision Co. Ltd. (Foxlink)
- 主要財務指標
- 表(圖表):主要財務指標
- 資產負債表(美元)(2014年~2024年)
- 資產負債表(%)(2014年~2024年)
- 損益清單(美元)(2014年~2024年)
- 損益清單的比例(2014年~2024年)
FIT Hon Teng Ltd
- 主要財務指標
- 表(圖表):主要財務指標
- 資產負債表(美元)(2014年~2024年)
- 資產負債表(%)(2014年~2024年)
- 損益清單(美元)(2014年~2024年)
- 損益清單的比例(2014年~2024年)
Hirose Electric Co., Ltd
- 主要財務指標
- 表(圖表):主要財務指標
- 資產負債表(美元)(2014年~2024年)
- 資產負債表(%)(2014年~2024年)
- 損益清單(美元)(2014年~2024年)
- 損益清單的比例(2014年~2024年)
Hosiden
- 主要財務指標
- 表(圖表):主要財務指標
- 資產負債表(美元)(2014年~2024年)
- 資產負債表(%)(2014年~2024年)
- 損益清單(美元)(2014年~2024年)
- 損益清單的比例(2014年~2024年)
HUBER+SUHNER
- 主要財務指標
- 表(圖表):主要財務指標
- 資產負債表(美元)(2014年~2024年)
- 資產負債表(%)(2014年~2024年)
- 損益清單(美元)(2014年~2024年)
- 損益清單的比例(2014年~2024年)
Japan Aviation Electronics Industry (JAE), Limited
- 主要財務指標
- 表(圖表):主要財務指標
- 資產負債表(美元)(2014年~2024年)
- 資產負債表(%)(2014年~2024年)
- 損益清單(美元)(2014年~2024年)
- 損益清單的比例(2014年~2024年)
Korea Electric Terminal Co. Ltd.
- 主要財務指標
- 表(圖表):主要財務指標
- 資產負債表(美元)(2014年~2024年)
- 資產負債表(%)(2014年~2024年)
- 損益清單(美元)(2014年~2024年)
- 損益清單的比例(2014年~2024年)
SMK
- 主要財務指標
- 表(圖表):主要財務指標
- 資產負債表(美元)(2014年~2024年)
- 資產負債表(%)(2014年~2024年)
- 損益清單(美元)(2014年~2024年)
- 損益清單的比例(2014年~2024年)
TE Connectivity
- 主要財務指標
- 表(圖表):主要財務指標
- 資產負債表(美元)(2014年~2024年)
- 資產負債表(%)(2014年~2024年)
- 損益清單(美元)(2014年~2024年)
- 損益清單的比例(2014年~2024年)
Each year, Bishop & Associates prepares the Connector Industry Yearbook based on annual reports provided by publicly traded connector companies. Income statements and balance sheets are consolidated for the past 10 years, five years, and most current year, providing benchmarks on the industry and the overall performance of the public connector companies.
In addition, the report provides a review of the connector industry for the period 2014-2024 for sales by region, end-use equipment sector and our current forecast for 2025 and 2030 by region and end-use equipment sector.
This report features:
Consolidated history of the public companies including:
- Key Financial Measurements (2014-2024)
- Balance Sheet $ (2014-2024)
- Income Statement $ (2014-2024)
- Balance Sheet percent (2014-2024)
- Income Statement percent (2014-2024)
Fifteen-year history of performance by company, with industry averages for the following financial measurements:
- Selling, General, & Administrative percent (2010-2024)
- Net Income percent (2010-2024)
- Return on Assets (2010-2024)
- Long Term Debt/Equity (2010-2024)
- Accounts Receivables Turnover (2010-2024)
- Inventory Turns (2010-2024)
- Cost of Goods Sold percent (2010-2024)
- COGS + SG&A percent (2010-2024)
- Current Ratio (2010-2024)
- Return on Equity (2010-2024)
- Liabilities to Equity (2010-2024)
- Average Collection Period (2010-2024)
- Days Inventory (2010-2024)
2024 Yearbook Companies Net Income as a Percent of Sales
The following table provides Net Income as a percent of sales from 2014-2024 for public companies included in the 2025 Connector Industry Yearbook.
Net Income
In 2024 the connector industry had an average net income of 14.1% of sales. 2018 was a significant year in the United States because it was the year the Tax Cuts and Jobs Act was passed. This act reduced the federal corporate income tax from 35% to 21%. As a result of the worldwide COVID pandemic, the lowest net income as a percent of sales occurred in 2020 at 4.2%. Between 2015 and 2019, net income decreased from 13.1% of sales in 2015 to 10.2% of sales in 2019. Between 2020 and 2024, net income increased from 4.2% in 2020 to 14.1% in 2024.
The following chart provides a history of net income for the Connector Industry from 2010-2024.
TABLE OF CONTENTS
PROLOGUE
CHAPTER 1 - THE WORLD ELECTRONIC CONNECTOR INDUSTRY
- The Last Ten Years (2014-2024)
- Table: Sales by Geographic Region
- Graph: Change by Region 2014 vs 2024
- The Last Five Years (2019-2024)
- Table: Sales by Geographic Region
- Graph: World Connector Industry - Year-To-Year Percent
- Change in Growth 1980-2025F
- Graph: North American Market Year-to-Year Growth 1980-2025F
- Graph: European Market Year-to-Year Growth 1980-2025F
- Graph: Japanese Market Year-to-Year Growth 1980-2025F
- Graph: Chinese Market Year-to-Year Growth 1995-2025F
- Graph: Asia Pacific Market Year-to-Year Growth 1980-2025F
- Graph: ROW Market Year-to-Year Growth 1980-2025F
- Last Year - 2024
- Table: 2022, 2023 and 2024 Percent Change in Growth Region
- Table: 2022, 2023 and 2024 Percent Share of Market by Region
- Equipment Sector Sales - 2022-2024
- Table: 2022-2024 Percent Change in Equipment Sales by Equipment Sector
- Graph: 2023-2024 Percent Change World Connector
- Sales by Equipment Sector
- Table: 2024 World Sales by Equipment Sector
- Graph: 2024 World Connector Market Top 5 Equipment Sectors
- Forecast 2025 and 2030 by Region
- Table: 2025 & 2030 Forecast by End-Use Market
- Graph: 2025 and 2030 End-Use Market Five-Year CAGR Mergers and Acquisitions
- Key Technology Trends
- Lead Times
- Price Trends
CHAPTER 2 - SIGNIFICANT EVENTS
CHAPTER 3 - CONSOLIDATED KEY PERFORMANCE MEASURES
Consolidated Key Performance Measures
- Key Financial Measurements (2014-2024)
- Charts: Key Financial Measurements
- Balance Sheet $ (2014-2024)
- Balance Sheet % (2014-2024)
- Income Statement $ (2014-2024)
- Income Statement % (2014-2024)
Performance History by Company
- Selected Connector Manufacturers
Cost-of-Goods Sold
- Cost of Goods Sold % (2010-2024)
Selling, General & Administrative (SG&A)
- Selling, General, & Administrative % (2010-2024)
COGS+SG&A
- COGS + SG&A % (2010-2024)
Net Income History
- Net Income % (2010-2024)
Current Ratio
- Current Ratio (2010-2024)
Return on Assets
- Return on Assets (2010-2024)
Return on Equity
- Return on Equity (2010-2024)
Long Term Debt/Equity
- Long Term Debt/Equity (2010-2024)
Liabilities to Equity
- Liabilities to Equity (2010-2024)
Accounts Receivable Turnover
- Accounts Receivables Turnover (2010-2024)
Average Collection Period
- Average Collection Period (2010-2024)
Inventory Turns
- Inventory Turns (2010-2024)
Days Inventory
- Days Inventory (2010-2024)
CHAPTER 4 - PERFORMANCE HISTORY OF SELECTED COMPANIES
Performance History of Selected Companies
Amphenol Corporation
- Key Financial Measurements
- Charts: Key Financial Measurements
- Balance Sheet $ (2014-2024)
- Balance Sheet % (2014-2024)
- Income Statement $ (2014-2024)
- Income Statement % (2014-2024)
Cheng Uei Precision Co. Ltd. (Foxlink)
- Key Financial Measurements
- Charts: Key Financial Measurements
- Balance Sheet $ (2014-2024)
- Balance Sheet % (2014-2024)
- Income Statement $ (2014-2024)
- Income Statement % (2014-2024)
FIT Hon Teng Ltd
- Key Financial Measurements
- Charts: Key Financial Measurements
- Balance Sheet $ (2014-2024)
- Balance Sheet % (2014-2024)
- Income Statement $ (2014-2024)
- Income Statement % (2014-2024)
Hirose Electric Co., Ltd
- Key Financial Measurements
- Charts: Key Financial Measurements
- Balance Sheet $ (2014-2024)
- Balance Sheet % (2014-2024)
- Income Statement $ (2014-2024)
- Income Statement % (2014-2024)
Hosiden
- Key Financial Measurements
- Charts: Key Financial Measurements
- Balance Sheet $ (2014-2024)
- Balance Sheet % (2014-2024)
- Income Statement $ (2014-2024)
- Income Statement % (2014-2024)
HUBER+SUHNER
- Key Financial Measurements
- Charts: Key Financial Measurements
- Balance Sheet $ (2014-2024)
- Balance Sheet % (2014-2024)
- Income Statement $ (2014-2024)
- Income Statement % (2014-2024)
Japan Aviation Electronics Industry (JAE), Limited
- Key Financial Measurements
- Charts: Key Financial Measurements
- Balance Sheet $ (2014-2024)
- Balance Sheet % (2014-2024)
- Income Statement $ (2014-2024)
- Income Statement % (2014-2024)
Korea Electric Terminal Co. Ltd.
- Key Financial Measurements
- Charts: Key Financial Measurements
- Balance Sheet $ (2014-2024)
- Balance Sheet % (2014-2024)
- Income Statement $ (2014-2024)
- Income Statement % (2014-2024)
SMK
- Key Financial Measurements
- Charts: Key Financial Measurements
- Balance Sheet $ (2014-2024)
- Balance Sheet % (2014-2024)
- Income Statement $ (2014-2024)
- Income Statement % (2014-2024)
TE Connectivity
- Key Financial Measurements
- Charts: Key Financial Measurements
- Balance Sheet $ (2014-2024)
- Balance Sheet % (2014-2024)
- Income Statement $ (2014-2024)
- Income Statement % (2014-2024)
 半間距連接器市場報告:趨勢、預測和競爭分析(至2035年)
 奈米微型連接器市場預測至2034年—按類型、材料、最終用戶和地區分類的全球分析SCSI連接器市場報告:趨勢、預測和競爭分析(至2035年)平面印刷電路基板連接器市場報告:趨勢、預測與競爭分析(至2035年)插座連接器市場報告:趨勢、預測和競爭分析(至2035年)
 電纜和連接器市場報告:按產品類型、安裝配置、行業和地區分類(2026-2034 年)D-Sub微型連接器市場報告:趨勢、預測和競爭分析(至2035年)鐵路電源連接器市場報告:趨勢、預測和競爭分析(至2035年)
 2026年全球抬頭顯示器(HUD)波形合成器市場報告
 連接器市場規模、佔有率和成長率;全球產業分析;按類型、應用和地區進行分析;以及未來預測(2026-2034 年)。