


 |
市場調查報告書
商品編碼
1641753
全球複合材料測試市場按類型、測試類型和最終用途行業分類 - 機會分析和行業預測(2024-2033 年)Composites Testing Market By Type , By Test Type By End-Use Industry : Global Opportunity Analysis and Industry Forecast, 2024-2033 |
||||||
複合材料測試市場
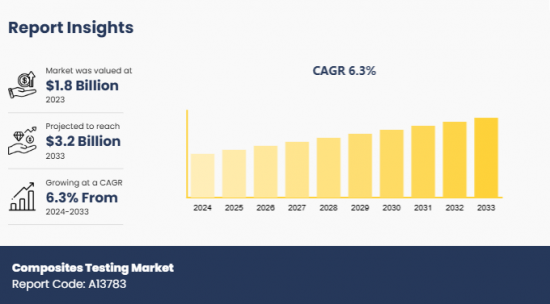
2023 年全球複合材料測試市場規模價值為 18 億美元,預計到 2033 年將達到 32 億美元,2024 年至 2033 年的複合年成長率為 6.3%。
複合材料測試涉及測試複合材料的機械、熱、物理和環境特性,以確保它們滿足各種應用所需的性能標準。複合材料是由兩種或多種具有不同特性的成分組合而成的,與單一元素相比,其性能更為優異。複合材料由於其異向性及對環境條件的敏感性,其行為往往與金屬和聚合物不同,因此進行嚴格的測試極為重要。
由於複合材料重量輕,汽車和航太工業對其的需求不斷增加,推動了這些元素的開發和測試,從而推動了市場成長。此外,複合材料開發程序中的技術創新促進了測試過程,以確保這些過程的可靠性,從而顯著增加了市場的成長。目前的趨勢是整合 AI、ML 和物聯網等工業 4.0 技術,以提高測試流程的準確性。這些技術透過預測模型和即時監控提高了測試程序的效率。
然而,複合材料測試相關技術的高成本限制了注重預算的製造商和研究機構的採用,從而阻礙了市場成長。此外,缺乏標準化的測試程序延遲了新型複合材料的認證和驗收,從而阻礙了市場的發展。相反,擴大使用複合材料來利用可再生資源生產能源,預計將為複合材料測試市場開闢新的途徑。根據國際能源總署預測,到2030年,電力、暖氣和運輸領域的可再生能源消耗預計將增加60%。這將推動對創新測試解決方案的需求,以確定複合材料的承載能力和抗疲勞和天氣相關劣化的有效性。
部分回顧
複合材料測試市場分為類型、測試類型、最終用途行業和地區。根據類型,市場分為陶瓷基複合材料、聚合物基複合材料、金屬基複合材料、纖維增強複合材料等。檢測類型分為破壞性檢測和非破壞性檢驗。根據最終用途行業,市場分為航太、汽車、建築和其他。按地區分析,涵蓋北美、歐洲、亞太地區、拉丁美洲、中東和非洲。
主要發現
按類型分類,纖維增強複合材料部分在 2023 年佔據了最高的市場佔有率。
按測試類型分類,非破壞性檢驗領域在 2023 年佔據了市場主導地位。
基於最終用途產業,航太領域在 2023 年的市場上佔據顯著地位。
按地區分類,預計歐洲將在 2023 年創造最高收益。
本報告可提供客製化(請聯絡銷售人員以了解其他費用和時間表)
- 資本投資明細
- 消費者購買行為分析
- 最終用戶的偏好和痛點
- 產品基準/產品規格及應用
- 產品生命週期
- 供應鏈分析與供應商利潤
- 新參與企業(按地區)
- 科技趨勢分析
- 經銷商利潤分析
- 打入市場策略
- 按產品/細分市場進行市場細分
- 主要公司的新產品開發/產品矩陣
- 監管指南
- 根據客戶興趣提供額外的公司簡介
- 按國家或地區進行的額外分析:市場規模和預測
- 品牌佔有率分析
- 歷史市場資料
- 導入/匯出分析/資料
- Excel 格式的主要企業詳細資料(包括位置、聯絡資訊、供應商/供應商網路等)
- 人均消費趨勢
- 產品消費分析
- SWOT 分析
目錄
第 1 章 簡介
第 2 章執行摘要
第3章 市場狀況
- 市場定義和範圍
- 主要發現
- 主要投資機會
- 關鍵成功策略
- 波特五力分析
- 市場動態
- 驅動程式
- 限制因素
- 機會
第4章 複合材料測試市場按類型
- 市場概況
- 陶瓷基複合材料
- 聚合物基複合材料
- 金屬基複合材料
- 纖維增強複合材料
- 其他
5. 複合材料測試市場依測試類型分類
- 市場概況
- 破壞性測試
- 非破壞性檢驗
6. 複合材料測試市場(依最終用途產業分類)
- 市場概況
- 航太
- 車
- 建造
- 其他
7. 複合材料測試市場(按地區)
- 市場概況
- 北美洲
- 主要市場趨勢和機遇
- 美國複合材料測試市場
- 加拿大複合材料測試市場
- 墨西哥複合材料測試市場
- 歐洲
- 主要市場趨勢和機遇
- 法國複合材料測試市場
- 德國複合材料測試市場
- 義大利複合材料測試市場
- 西班牙複合材料測試市場
- 英國複合材料測試市場
- 其他歐洲國家複合材料測試市場
- 亞太地區
- 主要市場趨勢和機遇
- 中國複合材料測試市場
- 日本複合材料測試市場
- 印度複合材料測試市場
- 韓國複合材料檢測市場
- 澳洲複合材料測試市場
- 其他亞太複合材料測試市場
- 拉丁美洲、中東和非洲
- 主要市場趨勢和機遇
- 巴西複合材料測試市場
- 南非複合材料測試市場
- 沙烏地阿拉伯複合材料測試市場
- 其他拉丁美洲、中東和非洲複合材料測試市場
第8章 競爭格局
- 介紹
- 關鍵成功策略
- 前 10 家公司的產品映射
- 競爭儀錶板
- 競爭熱圖
- 主要企業的定位:2023年
第9章 公司簡介
- Intertek Group Plc
- TA Instruments
- Micro Materials
- Element Materials Technology
- Thermtest Inc.
- Kinectrics
- SGS General Surveillance Company SA
- Henkel AG And Co. KGaA
- Instron Corporation
- R-TECH MATERIALS
Composites Testing Market
The composites testing market was valued at $1.8 billion in 2023 and is projected to reach $3.2 billion by 2033, growing at a CAGR of 6.3% from 2024 to 2033.
Composites testing involves the examination of mechanical, thermal, physical, and environmental properties of composite materials to ensure they cater to the essential performance criteria across diverse applications. A composite is formed by the combination of two or more components with distinguished characteristics, resulting in a material with superior properties as compared to the individual elements. Conducting robust testing is crucial as composites tend to behave differently from metals or polymers owing to their anisotropic properties and sensitivity to environmental conditions.
Increase in demand for composites from the automotive and aerospace industries owing to their lightweight property has boosted the development & testing of these elements, which is driving the growth of the market. In addition, innovations in the development procedures of composites have fueled the testing process to ensure the reliability of these processes, thereby augmenting the market growth notably. To enhance precision in the testing process, the integration of Industry 4.0 technologies such as AI, ML, and the Internet of Things is currently trending. These technologies enhance the efficiency of testing procedures through predictive modeling and real-time monitoring.
However, the high cost of technologies associated with composites testing restricts its adoption among budget-sensitive manufacturers and research institutions, which hinders the growth of the market. Furthermore, lack of standardization in testing procedures delays the certification and acceptance of new composites, restraining the market development. On the contrary, rise in the usage of composites to produce energy from renewable sources is projected to open new avenues for the composites testing market. According to the International Energy Agency, the consumption of renewable energy in the power, heat, and transport sectors is projected to increase by 60% by 2030. This is poised to fuel the need for ingenious testing solutions to examine the load-bearing capacity and effectiveness of composites against fatigue & weather-induced degradation.
Segment Review
The composites testing market is segmented into type, test type, end-use industry, and region. On the basis of type, the market is divided into ceramic matrics composites, polymer matrics composites, metal matrics composites, fiber reinforced composites, and others. As per test type, it is bifurcated into destructive test and non-destructive test. Depending on end-use industry, it is categorized into aerospace, automotive, construction, and others. Region wise, it is analyzed across North America, Europe, Asia-Pacific, and LAMEA.
Key Findings
On the basis of type, the fiber reinforced composites segment held the highest market share in 2023.
As per test type, the non-destructive test segment dominated the market in 2023.
Depending on end-use industry, the aerospace segment acquired a notable stake in the market in 2023.
Region wise, Europe was the highest revenue generator in 2023.
Competition Analysis
The major players in the global composites testing market include Intertek Group plc, TA Instruments, Micro Materials, Element Materials Technology, Thermtest Inc., Kinectrics, SGS General Surveillance Company SA, Henkel AG & Co. KGaA, Instron Corporation, and R-TECH MATERIALS. These major players have adopted various key development strategies such as business expansion, new product launches, and partnerships to strengthen their foothold in the competitive market.
Additional benefits you will get with this purchase are:
- Quarterly Update and* (only available with a corporate license, on listed price)
- 5 additional Company Profile of client Choice pre- or Post-purchase, as a free update.
- Free Upcoming Version on the Purchase of Five and Enterprise User License.
- 16 analyst hours of support* (post-purchase, if you find additional data requirements upon review of the report, you may receive support amounting to 16 analyst hours to solve questions, and post-sale queries)
- 15% Free Customization* (in case the scope or segment of the report does not match your requirements, 15% is equivalent to 3 working days of free work, applicable once)
- Free data Pack on the Five and Enterprise User License. (Excel version of the report)
- Free Updated report if the report is 6-12 months old or older.
- 24-hour priority response*
- Free Industry updates and white papers.
Possible Customization with this report (with additional cost and timeline, please talk to the sales executive to know more)
- Capital Investment breakdown
- Consumer Buying Behavior Analysis
- End user preferences and pain points
- Product Benchmarking / Product specification and applications
- Product Life Cycles
- Supply Chain Analysis & Vendor Margins
- Upcoming/New Entrant by Regions
- Technology Trend Analysis
- Distributor margin Analysis
- Go To Market Strategy
- Market share analysis of players by products/segments
- New Product Development/ Product Matrix of Key Players
- Regulatory Guidelines
- Additional company profiles with specific to client's interest
- Additional country or region analysis- market size and forecast
- Brands Share Analysis
- Historic market data
- Import Export Analysis/Data
- Key player details (including location, contact details, supplier/vendor network etc. in excel format)
- Per Capita Consumption Trends
- Product Consumption Analysis
- SWOT Analysis
Key Market Segments
By Type
- Ceramic Matrics Composites
- Polymer Matrics Composites
- Metal Matrics Composites
- Fiber Reinforced Composites
- Others
By Test Type
- Destructive Test
- Non-Destructive Test
By End-Use Industry
- Aerospace
- Automotive
- Construction
- Others
By Region
- North America
- U.S.
- Canada
- Mexico
- Europe
- France
- Germany
- Italy
- Spain
- UK
- Rest of Europe
- Asia-Pacific
- China
- Japan
- India
- South Korea
- Australia
- Rest of Asia-Pacific
- LAMEA
- Brazil
- South Africa
- Saudi Arabia
- Rest of LAMEA
Key Market Players:
- Intertek Group plc
- TA Instruments
- Micro Materials
- Element Materials Technology
- Thermtest Inc.
- Kinectrics
- SGS General Surveillance Company SA
- Henkel AG & Co. KGaA
- Instron Corporation
- R-TECH MATERIALS
TABLE OF CONTENTS
CHAPTER 1: INTRODUCTION
- 1.1. Report Description
- 1.2. Key Market Segments
- 1.3. Key Benefits
- 1.4. Research Methodology
- 1.4.1. Primary Research
- 1.4.2. Secondary Research
- 1.4.3. Analyst Tools and Models
CHAPTER 2: EXECUTIVE SUMMARY
- 2.1. CXO Perspective
CHAPTER 3: MARKET LANDSCAPE
- 3.1. Market Definition and Scope
- 3.2. Key Findings
- 3.2.1. Top Investment Pockets
- 3.2.2. Top Winning Strategies
- 3.3. Porter's Five Forces Analysis
- 3.3.1. Bargaining Power of Suppliers
- 3.3.2. Threat of New Entrants
- 3.3.3. Threat of Substitutes
- 3.3.4. Competitive Rivalry
- 3.3.5. Bargaining Power among Buyers
- 3.4. Market Dynamics
- 3.4.1. Drivers
- 3.4.2. Restraints
- 3.4.3. Opportunities
CHAPTER 4: COMPOSITES TESTING MARKET, BY TYPE
- 4.1. Market Overview
- 4.1.1 Market Size and Forecast, By Type
- 4.2. Ceramic Matrics Composites
- 4.2.1. Key Market Trends, Growth Factors and Opportunities
- 4.2.2. Market Size and Forecast, By Region
- 4.2.3. Market Share Analysis, By Country
- 4.3. Polymer Matrics Composites
- 4.3.1. Key Market Trends, Growth Factors and Opportunities
- 4.3.2. Market Size and Forecast, By Region
- 4.3.3. Market Share Analysis, By Country
- 4.4. Metal Matrics Composites
- 4.4.1. Key Market Trends, Growth Factors and Opportunities
- 4.4.2. Market Size and Forecast, By Region
- 4.4.3. Market Share Analysis, By Country
- 4.5. Fiber Reinforced Composites
- 4.5.1. Key Market Trends, Growth Factors and Opportunities
- 4.5.2. Market Size and Forecast, By Region
- 4.5.3. Market Share Analysis, By Country
- 4.6. Others
- 4.6.1. Key Market Trends, Growth Factors and Opportunities
- 4.6.2. Market Size and Forecast, By Region
- 4.6.3. Market Share Analysis, By Country
CHAPTER 5: COMPOSITES TESTING MARKET, BY TEST TYPE
- 5.1. Market Overview
- 5.1.1 Market Size and Forecast, By Test Type
- 5.2. Destructive Test
- 5.2.1. Key Market Trends, Growth Factors and Opportunities
- 5.2.2. Market Size and Forecast, By Region
- 5.2.3. Market Share Analysis, By Country
- 5.3. Non-Destructive Test
- 5.3.1. Key Market Trends, Growth Factors and Opportunities
- 5.3.2. Market Size and Forecast, By Region
- 5.3.3. Market Share Analysis, By Country
CHAPTER 6: COMPOSITES TESTING MARKET, BY END-USE INDUSTRY
- 6.1. Market Overview
- 6.1.1 Market Size and Forecast, By End-use Industry
- 6.2. Aerospace
- 6.2.1. Key Market Trends, Growth Factors and Opportunities
- 6.2.2. Market Size and Forecast, By Region
- 6.2.3. Market Share Analysis, By Country
- 6.3. Automotive
- 6.3.1. Key Market Trends, Growth Factors and Opportunities
- 6.3.2. Market Size and Forecast, By Region
- 6.3.3. Market Share Analysis, By Country
- 6.4. Construction
- 6.4.1. Key Market Trends, Growth Factors and Opportunities
- 6.4.2. Market Size and Forecast, By Region
- 6.4.3. Market Share Analysis, By Country
- 6.5. Others
- 6.5.1. Key Market Trends, Growth Factors and Opportunities
- 6.5.2. Market Size and Forecast, By Region
- 6.5.3. Market Share Analysis, By Country
CHAPTER 7: COMPOSITES TESTING MARKET, BY REGION
- 7.1. Market Overview
- 7.1.1 Market Size and Forecast, By Region
- 7.2. North America
- 7.2.1. Key Market Trends and Opportunities
- 7.2.2. Market Size and Forecast, By Type
- 7.2.3. Market Size and Forecast, By Test Type
- 7.2.4. Market Size and Forecast, By End-use Industry
- 7.2.5. Market Size and Forecast, By Country
- 7.2.6. U.S. Composites Testing Market
- 7.2.6.1. Market Size and Forecast, By Type
- 7.2.6.2. Market Size and Forecast, By Test Type
- 7.2.6.3. Market Size and Forecast, By End-use Industry
- 7.2.7. Canada Composites Testing Market
- 7.2.7.1. Market Size and Forecast, By Type
- 7.2.7.2. Market Size and Forecast, By Test Type
- 7.2.7.3. Market Size and Forecast, By End-use Industry
- 7.2.8. Mexico Composites Testing Market
- 7.2.8.1. Market Size and Forecast, By Type
- 7.2.8.2. Market Size and Forecast, By Test Type
- 7.2.8.3. Market Size and Forecast, By End-use Industry
- 7.3. Europe
- 7.3.1. Key Market Trends and Opportunities
- 7.3.2. Market Size and Forecast, By Type
- 7.3.3. Market Size and Forecast, By Test Type
- 7.3.4. Market Size and Forecast, By End-use Industry
- 7.3.5. Market Size and Forecast, By Country
- 7.3.6. France Composites Testing Market
- 7.3.6.1. Market Size and Forecast, By Type
- 7.3.6.2. Market Size and Forecast, By Test Type
- 7.3.6.3. Market Size and Forecast, By End-use Industry
- 7.3.7. Germany Composites Testing Market
- 7.3.7.1. Market Size and Forecast, By Type
- 7.3.7.2. Market Size and Forecast, By Test Type
- 7.3.7.3. Market Size and Forecast, By End-use Industry
- 7.3.8. Italy Composites Testing Market
- 7.3.8.1. Market Size and Forecast, By Type
- 7.3.8.2. Market Size and Forecast, By Test Type
- 7.3.8.3. Market Size and Forecast, By End-use Industry
- 7.3.9. Spain Composites Testing Market
- 7.3.9.1. Market Size and Forecast, By Type
- 7.3.9.2. Market Size and Forecast, By Test Type
- 7.3.9.3. Market Size and Forecast, By End-use Industry
- 7.3.10. UK Composites Testing Market
- 7.3.10.1. Market Size and Forecast, By Type
- 7.3.10.2. Market Size and Forecast, By Test Type
- 7.3.10.3. Market Size and Forecast, By End-use Industry
- 7.3.11. Rest Of Europe Composites Testing Market
- 7.3.11.1. Market Size and Forecast, By Type
- 7.3.11.2. Market Size and Forecast, By Test Type
- 7.3.11.3. Market Size and Forecast, By End-use Industry
- 7.4. Asia-Pacific
- 7.4.1. Key Market Trends and Opportunities
- 7.4.2. Market Size and Forecast, By Type
- 7.4.3. Market Size and Forecast, By Test Type
- 7.4.4. Market Size and Forecast, By End-use Industry
- 7.4.5. Market Size and Forecast, By Country
- 7.4.6. China Composites Testing Market
- 7.4.6.1. Market Size and Forecast, By Type
- 7.4.6.2. Market Size and Forecast, By Test Type
- 7.4.6.3. Market Size and Forecast, By End-use Industry
- 7.4.7. Japan Composites Testing Market
- 7.4.7.1. Market Size and Forecast, By Type
- 7.4.7.2. Market Size and Forecast, By Test Type
- 7.4.7.3. Market Size and Forecast, By End-use Industry
- 7.4.8. India Composites Testing Market
- 7.4.8.1. Market Size and Forecast, By Type
- 7.4.8.2. Market Size and Forecast, By Test Type
- 7.4.8.3. Market Size and Forecast, By End-use Industry
- 7.4.9. South Korea Composites Testing Market
- 7.4.9.1. Market Size and Forecast, By Type
- 7.4.9.2. Market Size and Forecast, By Test Type
- 7.4.9.3. Market Size and Forecast, By End-use Industry
- 7.4.10. Australia Composites Testing Market
- 7.4.10.1. Market Size and Forecast, By Type
- 7.4.10.2. Market Size and Forecast, By Test Type
- 7.4.10.3. Market Size and Forecast, By End-use Industry
- 7.4.11. Rest of Asia-Pacific Composites Testing Market
- 7.4.11.1. Market Size and Forecast, By Type
- 7.4.11.2. Market Size and Forecast, By Test Type
- 7.4.11.3. Market Size and Forecast, By End-use Industry
- 7.5. LAMEA
- 7.5.1. Key Market Trends and Opportunities
- 7.5.2. Market Size and Forecast, By Type
- 7.5.3. Market Size and Forecast, By Test Type
- 7.5.4. Market Size and Forecast, By End-use Industry
- 7.5.5. Market Size and Forecast, By Country
- 7.5.6. Brazil Composites Testing Market
- 7.5.6.1. Market Size and Forecast, By Type
- 7.5.6.2. Market Size and Forecast, By Test Type
- 7.5.6.3. Market Size and Forecast, By End-use Industry
- 7.5.7. South Africa Composites Testing Market
- 7.5.7.1. Market Size and Forecast, By Type
- 7.5.7.2. Market Size and Forecast, By Test Type
- 7.5.7.3. Market Size and Forecast, By End-use Industry
- 7.5.8. Saudi Arabia Composites Testing Market
- 7.5.8.1. Market Size and Forecast, By Type
- 7.5.8.2. Market Size and Forecast, By Test Type
- 7.5.8.3. Market Size and Forecast, By End-use Industry
- 7.5.9. Rest of LAMEA Composites Testing Market
- 7.5.9.1. Market Size and Forecast, By Type
- 7.5.9.2. Market Size and Forecast, By Test Type
- 7.5.9.3. Market Size and Forecast, By End-use Industry
CHAPTER 8: COMPETITIVE LANDSCAPE
- 8.1. Introduction
- 8.2. Top Winning Strategies
- 8.3. Product Mapping Of Top 10 Player
- 8.4. Competitive Dashboard
- 8.5. Competitive Heatmap
- 8.6. Top Player Positioning, 2023
CHAPTER 9: COMPANY PROFILES
- 9.1. Intertek Group Plc
- 9.1.1. Company Overview
- 9.1.2. Key Executives
- 9.1.3. Company Snapshot
- 9.1.4. Operating Business Segments
- 9.1.5. Product Portfolio
- 9.1.6. Business Performance
- 9.1.7. Key Strategic Moves and Developments
- 9.2. TA Instruments
- 9.2.1. Company Overview
- 9.2.2. Key Executives
- 9.2.3. Company Snapshot
- 9.2.4. Operating Business Segments
- 9.2.5. Product Portfolio
- 9.2.6. Business Performance
- 9.2.7. Key Strategic Moves and Developments
- 9.3. Micro Materials
- 9.3.1. Company Overview
- 9.3.2. Key Executives
- 9.3.3. Company Snapshot
- 9.3.4. Operating Business Segments
- 9.3.5. Product Portfolio
- 9.3.6. Business Performance
- 9.3.7. Key Strategic Moves and Developments
- 9.4. Element Materials Technology
- 9.4.1. Company Overview
- 9.4.2. Key Executives
- 9.4.3. Company Snapshot
- 9.4.4. Operating Business Segments
- 9.4.5. Product Portfolio
- 9.4.6. Business Performance
- 9.4.7. Key Strategic Moves and Developments
- 9.5. Thermtest Inc.
- 9.5.1. Company Overview
- 9.5.2. Key Executives
- 9.5.3. Company Snapshot
- 9.5.4. Operating Business Segments
- 9.5.5. Product Portfolio
- 9.5.6. Business Performance
- 9.5.7. Key Strategic Moves and Developments
- 9.6. Kinectrics
- 9.6.1. Company Overview
- 9.6.2. Key Executives
- 9.6.3. Company Snapshot
- 9.6.4. Operating Business Segments
- 9.6.5. Product Portfolio
- 9.6.6. Business Performance
- 9.6.7. Key Strategic Moves and Developments
- 9.7. SGS General Surveillance Company SA
- 9.7.1. Company Overview
- 9.7.2. Key Executives
- 9.7.3. Company Snapshot
- 9.7.4. Operating Business Segments
- 9.7.5. Product Portfolio
- 9.7.6. Business Performance
- 9.7.7. Key Strategic Moves and Developments
- 9.8. Henkel AG And Co. KGaA
- 9.8.1. Company Overview
- 9.8.2. Key Executives
- 9.8.3. Company Snapshot
- 9.8.4. Operating Business Segments
- 9.8.5. Product Portfolio
- 9.8.6. Business Performance
- 9.8.7. Key Strategic Moves and Developments
- 9.9. Instron Corporation
- 9.9.1. Company Overview
- 9.9.2. Key Executives
- 9.9.3. Company Snapshot
- 9.9.4. Operating Business Segments
- 9.9.5. Product Portfolio
- 9.9.6. Business Performance
- 9.9.7. Key Strategic Moves and Developments
- 9.10. R-TECH MATERIALS
- 9.10.1. Company Overview
- 9.10.2. Key Executives
- 9.10.3. Company Snapshot
- 9.10.4. Operating Business Segments
- 9.10.5. Product Portfolio
- 9.10.6. Business Performance
- 9.10.7. Key Strategic Moves and Developments
 2025年材料分析測試設備全球市場報告
 複合材料測試:市場佔有率分析、產業趨勢、成長預測(2025-2030)
 複合材料測試市場:按產品類型、測試方法、應用分類 - 2025-2030 年全球預測
![複合材料測試市場:趨勢、機會與競爭分析 [2024-2030]](/sample/img/cover/42/default_cover_5.png) 複合材料測試市場:趨勢、機會與競爭分析 [2024-2030]
複合材料測試市場:趨勢、機會與競爭分析 [2024-2030]