


 |
市場調查報告書
商品編碼
1513318
疫苗市場:按技術類型、按適應症、按最終用戶:2024-2035 年全球機會分析和產業預測Vaccines Market By Technology Type, By Indication, By End User : Global Opportunity Analysis and Industry Forecast, 2024-2035 |
||||||
價格
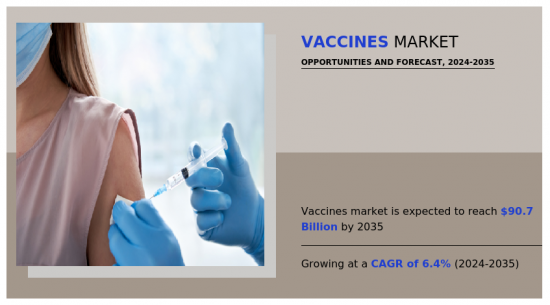
2023年疫苗市值為432億美元,預計2035年將達到907億美元,2024年至2035年的複合年成長率為6.4%。疫苗是一種提供針對特定感染疾病的免疫力的生物製藥。疫苗通常含有減毒或惰性的病原體、其毒素和表面蛋白,以刺激免疫系統識別和記住病原體。當您接種疫苗時,您的免疫系統會透過產生抗體並激活特異性病原體的免疫細胞來做出反應。這在體內建立了一種防禦機制,如果以後暴露於實際的感染疾病,免疫系統可以快速識別並消滅病原體,預防或減輕疾病的嚴重程度。歷史上,疫苗幫助控制和消除了許多致命疾病,使其成為現代醫學最重要的進步之一。
 疫苗市場的成長主要是由需要疫苗接種的疾病盛行率上升所推動的,例如流感、肺炎球菌疾病、HPV和其他感染疾病。例如,美國疾病管制與預防美國(CDC) 估計 2023 年將有 3,100 萬人感染流感。此外,政府對疫苗研發、生產基礎設施和公共免疫計畫的投資對疫苗市場也有重大影響。官民合作關係津貼、補貼、稅收優惠和法律規範獎勵疫苗開發並確保安全性、有效性和品質標準。美國食品藥物管理局(FDA)、歐洲藥品管理局 (EMA) 和世界衛生組織 (WHO) 等監管機構在評估和授權疫苗、影響市場准入和採用方面發揮著至關重要的作用。然而,高昂的開發成本、複雜的製造流程和嚴格的監管要求導致疫苗價格高昂,而負擔能力有限,特別是在低收入和中等收入國家(LMIC),導致市場可能抑製成長。相較之下,生物技術、基因組學和免疫學的進步為透過開發新的和改進的疫苗來擴大疾病預防和控制提供了機會。新出現的感染疾病、抗菌素抗藥性和重新出現的病原體凸顯了對創新疫苗解決方案的需求,以解決未滿足的醫療需求並減少公共衛生威脅。疫苗市場按技術類型、適應症、最終用戶和地區進行細分。依技術類型,疫苗分為重組/結合疫苗、減毒活病毒疫苗、去活化疫苗、類毒素疫苗等。依適應症,肺炎鏈球菌感染、流感、人類乳突病毒、腦膜炎雙球菌病菌感染、輪狀病毒、德國麻疹、麻疹/腮腺炎/德國麻疹、白喉/百日咳/破傷風(DTP)、脊髓灰質炎、肝炎等被歸類為適應症。按最終用戶分類,市場分為兒童、成人和旅行者。按地區分類,我們有北美(美國、加拿大、墨西哥)、歐洲(德國、法國、英國、義大利、西班牙其他歐洲國家地區)、亞太地區(日本、中國、澳洲、印度、韓國、及其他亞太地區),以南美地區(巴西、沙烏地阿拉伯、非洲和其他南美地區)為分析對象。全球疫苗市場的主要主要企業有默克公司、輝瑞公司、賽諾菲公司、印度血清研究所、Bavarian Nordic、CSL Limited、Emergent Bio Solutions Inc.、葛蘭素史克公司、智飛生物公司。特生物技術公司。市場上的主要企業已將臨床試驗、產品上市、產品核可和業務擴張作為擴大產品系列的關鍵策略。
相關人員的主要利益
- 本報告對2023年至2035年疫苗市場分析的細分市場、當前趨勢、估計/趨勢和動態進行了定量分析,以揭示疫苗市場的當前機會。
- 我們提供市場研究以及與市場促進因素、市場限制和市場機會相關的資訊。
- 波特的五力分析強調買家和供應商幫助相關人員做出利潤驅動的商業決策並加強供應商-買家網路的潛力。
- 對疫苗市場區隔的詳細分析有助於識別市場機會。
- 每個地區的主要國家都根據其對全球市場的收益貢獻繪製了地圖。
- 市場參與者定位有助於基準化分析,並提供對市場參與者當前位置的清晰了解。
- 該報告包括對區域和全球疫苗市場趨勢、主要企業、細分市場、應用領域和市場成長策略的分析。其他好處包括:
- 季度更新和*(僅適用於企業許可證)
- 在購買之前或之後免費更新您選擇的 5 個額外公司簡介。
- 購買 5 個用戶和企業用戶授權即可免費獲得下一個版本。
- 16 小時分析師支援*(購買後,如果您的報表審查發現額外的資料需求,您將獲得 16 小時分析師支持,以解決任何問題或售後查詢)
- 15% 免費自訂*(如果報告的範圍或細分不符合您的要求,15% 相當於 3 個工作日的免費工作。)
- 5 個用戶許可證和企業用戶許可證的免費資料包。 (Excel版報告)
- 如果您的報告超過 6-12 個月,我們將免費提供更新的報告。
- 24 小時優先回應*。
- 免費取得最新的行業資訊和白皮書。
- 監管指引
- 根據客戶興趣新增其他公司簡介
- 按國家或地區進行的附加分析 – 市場規模和預測
- 公司簡介的擴充列表
- 歷史市場資料
- 主要參與者的詳細資料(Excel格式,包括位置、聯絡資訊、供應商/供應商網路等)
目錄
第1章簡介
第 2 章執行摘要
第3章市場概況
- 市場定義和範圍
- 主要發現
- 影響因素
- 主要投資機會
- 波特五力分析
- 市場動態
- 促進因素
- 抑制因素
- 機會
第4章疫苗市場:依技術類型
- 概述
- 重組疫苗和結合疫苗
- 活病毒疫苗
- 去活化疫苗
- 類毒素疫苗
- 其他
第5章 疫苗市場:依適應症分類
- 概述
- 肺炎鏈球菌感染
- 流感
- 人類乳突病毒
- 病菌感染
- 輪狀病毒
- 水痘
- 麻疹、腮腺炎、德國麻疹
- 白喉、百日咳和破傷風 (DTP)
- 脊髓灰質炎
- 肝炎
- 其他適應症
第6章 疫苗市場:依最終使用者分類
- 概述
- 小兒科
- 成人
- 遊客
第7章 疫苗市場:依地區
- 概述
- 北美洲
- 美國
- 加拿大
- 墨西哥
- 歐洲
- 德國
- 法國
- 義大利
- 西班牙
- 其他
- 亞太地區
- 日本
- 中國
- 印度
- 澳洲
- 韓國
- 其他
- 拉丁美洲/中東/非洲
- 巴西
- 沙烏地阿拉伯
- 南非
- 其他
第8章 競爭格局
- 介紹
- 關鍵成功策略
- 10家主要企業產品圖譜
- 競爭對手儀表板
- 競爭熱圖
- 2023年主要企業定位
第9章 公司簡介
- CSL Limited
- Emergent Bio Solutions Inc.
- GlaxoSmithKline Plc.
- Merck & Co., Inc.
- Pfizer
- Sanofi
- Serum Institute of India Pvt. Ltd.
- Bavarian Nordic
- Zhi Fei Biological
- Bharat Biotech
Product Code: A00168
The vaccine market was valued at $43.2 billion in 2023 and is projected to reach $90.7 billion by 2035, registering a CAGR of 6.4% from 2024 to 2035. A vaccine is a biological preparation that provides immunity to a particular infectious disease. It typically contains weakened or inactive forms of the pathogen, its toxins, or surface proteins, which stimulate the immune system to recognize and remember the pathogen. When people are vaccinated, their immune system responds by producing antibodies and activating immune cells specific to that pathogen. This creates a defense mechanism within the body, so if a person is later exposed to the actual infectious agent, the immune system can quickly recognize and destroy it, preventing or reducing the severity of the disease. Vaccines have been instrumental in controlling and eradicating many deadly diseases throughout history, making them one of the most significant advancements in modern medicine. Key Benefits for Stakeholders
- This report provides a quantitative analysis of the market segments, current trends, estimations, and dynamics of the vaccines market analysis from 2023 to 2035 to identify the prevailing vaccines market opportunities.
- The market research is offered along with information related to key drivers, restraints, and opportunities.
- Porter's five forces analysis highlights the potency of buyers and suppliers to enable stakeholders make profit-oriented business decisions and strengthen their supplier-buyer network.
- In-depth analysis of the vaccines market segmentation assists to determine the prevailing market opportunities.
- Major countries in each region are mapped according to their revenue contribution to the global market.
- Market player positioning facilitates benchmarking and provides a clear understanding of the present position of the market players.
- The report includes the analysis of the regional as well as global vaccines market trends, key players, market segments, application areas, and market growth strategies. Additional benefits you will get with this purchase are:
- Quarterly Update and* (only available with a corporate license, on listed price)
- 5 additional Company Profile of client Choice pre- or Post-purchase, as a free update.
- Free Upcoming Version on the Purchase of Five and Enterprise User License.
- 16 analyst hours of support* (post-purchase, if you find additional data requirements upon review of the report, you may receive support amounting to 16 analyst hours to solve questions, and post-sale queries)
- 15% Free Customization* (in case the scope or segment of the report does not match your requirements, 15% is equivalent to 3 working days of free work, applicable once)
- Free data Pack on the Five and Enterprise User License. (Excel version of the report)
- Free Updated report if the report is 6-12 months old or older.
- 24-hour priority response*
- Free Industry updates and white papers. Possible Customization with this report (with additional cost and timeline, please talk to the sales executive to know more)
- Regulatory Guidelines
- Additional company profiles with specific to client's interest
- Additional country or region analysis- market size and forecast
- Expanded list for Company Profiles
- Historic market data
- Key player details (including location, contact details, supplier/vendor network etc. in excel format)
Key Market Segments
By Technology Type
- Inactivated Vaccines
- Toxoid Vaccines
- Others
- Recombinant and Conjugate Vaccines
- Live Attenuated Vaccines
By Indication
- Pneumococcal Disease
- Influenza
- Human Papilloma Virus
- Meningococcal Disease
- Rotavirus
- Varicella
- Measles, Mumps, and Rubella
- Diphtheria, Pertussis, and Tetanus (DTP)
- Polio
- Hepatitis
- Other Indications
By End User
- Pediatric
- Adults
- Travelers
By Region
- North America
- U.S.
- Canada
- Mexico
- Europe
- Germany
- France
- UK
- Italy
- Spain
- Rest of Europe
- Asia-Pacific
- Japan
- China
- India
- Australia
- South Korea
- Rest of Asia-Pacific
- LAMEA
- Brazil
- Saudi Arabia
- South Africa
- Rest of LAMEA
Key Market Players:
- CSL Limited
- Emergent Bi
Solutions Inc.
- GlaxoSmithKline Plc.
- Merck & Co., Inc.
- Pfizer
- Sanofi
- Serum Institute of India Pvt. Ltd.
- Bavarian Nordic
- Zhi Fei Biological
- Bharat Biotech
TABLE OF CONTENTS
CHAPTER 1: INTRODUCTION
- 1.1. Report description
- 1.2. Key market segments
- 1.3. Key benefits to the stakeholders
- 1.4. Research methodology
- 1.4.1. Primary research
- 1.4.2. Secondary research
- 1.4.3. Analyst tools and models
CHAPTER 2: EXECUTIVE SUMMARY
- 2.1. CXO perspective
CHAPTER 3: MARKET OVERVIEW
- 3.1. Market definition and scope
- 3.2. Key findings
- 3.2.1. Top impacting factors
- 3.2.2. Top investment pockets
- 3.3. Porter's five forces analysis
- 3.4. Market dynamics
- 3.4.1. Drivers
- 3.4.2. Restraints
- 3.4.3. Opportunities
CHAPTER 4: VACCINES MARKET, BY TECHNOLOGY TYPE
- 4.1. Overview
- 4.1.1. Market size and forecast
- 4.2. Recombinant and Conjugate Vaccines
- 4.2.1. Key market trends, growth factors and opportunities
- 4.2.2. Market size and forecast, by region
- 4.2.3. Market share analysis by country
- 4.3. Live Attenuated Vaccines
- 4.3.1. Key market trends, growth factors and opportunities
- 4.3.2. Market size and forecast, by region
- 4.3.3. Market share analysis by country
- 4.4. Inactivated Vaccines
- 4.4.1. Key market trends, growth factors and opportunities
- 4.4.2. Market size and forecast, by region
- 4.4.3. Market share analysis by country
- 4.5. Toxoid Vaccines
- 4.5.1. Key market trends, growth factors and opportunities
- 4.5.2. Market size and forecast, by region
- 4.5.3. Market share analysis by country
- 4.6. Others
- 4.6.1. Key market trends, growth factors and opportunities
- 4.6.2. Market size and forecast, by region
- 4.6.3. Market share analysis by country
CHAPTER 5: VACCINES MARKET, BY INDICATION
- 5.1. Overview
- 5.1.1. Market size and forecast
- 5.2. Pneumococcal Disease
- 5.2.1. Key market trends, growth factors and opportunities
- 5.2.2. Market size and forecast, by region
- 5.2.3. Market share analysis by country
- 5.3. Influenza
- 5.3.1. Key market trends, growth factors and opportunities
- 5.3.2. Market size and forecast, by region
- 5.3.3. Market share analysis by country
- 5.4. Human Papilloma Virus
- 5.4.1. Key market trends, growth factors and opportunities
- 5.4.2. Market size and forecast, by region
- 5.4.3. Market share analysis by country
- 5.5. Meningococcal Disease
- 5.5.1. Key market trends, growth factors and opportunities
- 5.5.2. Market size and forecast, by region
- 5.5.3. Market share analysis by country
- 5.6. Rotavirus
- 5.6.1. Key market trends, growth factors and opportunities
- 5.6.2. Market size and forecast, by region
- 5.6.3. Market share analysis by country
- 5.7. Varicella
- 5.7.1. Key market trends, growth factors and opportunities
- 5.7.2. Market size and forecast, by region
- 5.7.3. Market share analysis by country
- 5.8. Measles, Mumps, and Rubella
- 5.8.1. Key market trends, growth factors and opportunities
- 5.8.2. Market size and forecast, by region
- 5.8.3. Market share analysis by country
- 5.9. Diphtheria, Pertussis, and Tetanus (DTP)
- 5.9.1. Key market trends, growth factors and opportunities
- 5.9.2. Market size and forecast, by region
- 5.9.3. Market share analysis by country
- 5.10. Polio
- 5.10.1. Key market trends, growth factors and opportunities
- 5.10.2. Market size and forecast, by region
- 5.10.3. Market share analysis by country
- 5.11. Hepatitis
- 5.11.1. Key market trends, growth factors and opportunities
- 5.11.2. Market size and forecast, by region
- 5.11.3. Market share analysis by country
- 5.12. Other Indications
- 5.12.1. Key market trends, growth factors and opportunities
- 5.12.2. Market size and forecast, by region
- 5.12.3. Market share analysis by country
CHAPTER 6: VACCINES MARKET, BY END USER
- 6.1. Overview
- 6.1.1. Market size and forecast
- 6.2. Pediatric
- 6.2.1. Key market trends, growth factors and opportunities
- 6.2.2. Market size and forecast, by region
- 6.2.3. Market share analysis by country
- 6.3. Adults
- 6.3.1. Key market trends, growth factors and opportunities
- 6.3.2. Market size and forecast, by region
- 6.3.3. Market share analysis by country
- 6.4. Travelers
- 6.4.1. Key market trends, growth factors and opportunities
- 6.4.2. Market size and forecast, by region
- 6.4.3. Market share analysis by country
CHAPTER 7: VACCINES MARKET, BY REGION
- 7.1. Overview
- 7.1.1. Market size and forecast By Region
- 7.2. North America
- 7.2.1. Key market trends, growth factors and opportunities
- 7.2.2. Market size and forecast, by Technology Type
- 7.2.3. Market size and forecast, by Indication
- 7.2.4. Market size and forecast, by End User
- 7.2.5. Market size and forecast, by country
- 7.2.5.1. U.S.
- 7.2.5.1.1. Market size and forecast, by Technology Type
- 7.2.5.1.2. Market size and forecast, by Indication
- 7.2.5.1.3. Market size and forecast, by End User
- 7.2.5.2. Canada
- 7.2.5.2.1. Market size and forecast, by Technology Type
- 7.2.5.2.2. Market size and forecast, by Indication
- 7.2.5.2.3. Market size and forecast, by End User
- 7.2.5.3. Mexico
- 7.2.5.3.1. Market size and forecast, by Technology Type
- 7.2.5.3.2. Market size and forecast, by Indication
- 7.2.5.3.3. Market size and forecast, by End User
- 7.3. Europe
- 7.3.1. Key market trends, growth factors and opportunities
- 7.3.2. Market size and forecast, by Technology Type
- 7.3.3. Market size and forecast, by Indication
- 7.3.4. Market size and forecast, by End User
- 7.3.5. Market size and forecast, by country
- 7.3.5.1. Germany
- 7.3.5.1.1. Market size and forecast, by Technology Type
- 7.3.5.1.2. Market size and forecast, by Indication
- 7.3.5.1.3. Market size and forecast, by End User
- 7.3.5.2. France
- 7.3.5.3.2. Market size and forecast, by Indication
- 7.3.5.3.3. Market size and forecast, by End User
- 7.3.5.4. Italy
- 7.3.5.4.1. Market size and forecast, by Technology Type
- 7.3.5.4.2. Market size and forecast, by Indication
- 7.3.5.4.3. Market size and forecast, by End User
- 7.3.5.5. Spain
- 7.3.5.5.1. Market size and forecast, by Technology Type
- 7.3.5.5.2. Market size and forecast, by Indication
- 7.3.5.5.3. Market size and forecast, by End User
- 7.3.5.6. Rest of Europe
- 7.3.5.6.1. Market size and forecast, by Technology Type
- 7.3.5.6.2. Market size and forecast, by Indication
- 7.3.5.6.3. Market size and forecast, by End User
- 7.4. Asia-Pacific
- 7.4.1. Key market trends, growth factors and opportunities
- 7.4.2. Market size and forecast, by Technology Type
- 7.4.3. Market size and forecast, by Indication
- 7.4.4. Market size and forecast, by End User
- 7.4.5. Market size and forecast, by country
- 7.4.5.1. Japan
- 7.4.5.1.1. Market size and forecast, by Technology Type
- 7.4.5.1.2. Market size and forecast, by Indication
- 7.4.5.1.3. Market size and forecast, by End User
- 7.4.5.2. China
- 7.4.5.2.1. Market size and forecast, by Technology Type
- 7.4.5.2.2. Market size and forecast, by Indication
- 7.4.5.2.3. Market size and forecast, by End User
- 7.4.5.3. India
- 7.4.5.3.1. Market size and forecast, by Technology Type
- 7.4.5.3.2. Market size and forecast, by Indication
- 7.4.5.3.3. Market size and forecast, by End User
- 7.4.5.4. Australia
- 7.4.5.4.1. Market size and forecast, by Technology Type
- 7.4.5.4.2. Market size and forecast, by Indication
- 7.4.5.4.3. Market size and forecast, by End User
- 7.4.5.5. South Korea
- 7.4.5.5.1. Market size and forecast, by Technology Type
- 7.4.5.5.2. Market size and forecast, by Indication
- 7.4.5.5.3. Market size and forecast, by End User
- 7.4.5.6. Rest of Asia-Pacific
- 7.4.5.6.1. Market size and forecast, by Technology Type
- 7.4.5.6.2. Market size and forecast, by Indication
- 7.4.5.6.3. Market size and forecast, by End User
- 7.5. LAMEA
- 7.5.1. Key market trends, growth factors and opportunities
- 7.5.2. Market size and forecast, by Technology Type
- 7.5.3. Market size and forecast, by Indication
- 7.5.4. Market size and forecast, by End User
- 7.5.5. Market size and forecast, by country
- 7.5.5.1. Brazil
- 7.5.5.1.1. Market size and forecast, by Technology Type
- 7.5.5.1.2. Market size and forecast, by Indication
- 7.5.5.1.3. Market size and forecast, by End User
- 7.5.5.2. Saudi Arabia
- 7.5.5.2.1. Market size and forecast, by Technology Type
- 7.5.5.2.2. Market size and forecast, by Indication
- 7.5.5.2.3. Market size and forecast, by End User
- 7.5.5.3. South Africa
- 7.5.5.3.1. Market size and forecast, by Technology Type
- 7.5.5.3.2. Market size and forecast, by Indication
- 7.5.5.3.3. Market size and forecast, by End User
- 7.5.5.4. Rest of LAMEA
- 7.5.5.4.1. Market size and forecast, by Technology Type
- 7.5.5.4.2. Market size and forecast, by Indication
- 7.5.5.4.3. Market size and forecast, by End User
CHAPTER 8: COMPETITIVE LANDSCAPE
- 8.1. Introduction
- 8.2. Top winning strategies
- 8.3. Product mapping of top 10 player
- 8.4. Competitive dashboard
- 8.5. Competitive heatmap
- 8.6. Top player positioning, 2023
CHAPTER 9: COMPANY PROFILES
- 9.1. CSL Limited
- 9.1.1. Company overview
- 9.1.2. Key executives
- 9.1.3. Company snapshot
- 9.1.4. Operating business segments
- 9.1.5. Product portfolio
- 9.1.6. Business performance
- 9.1.7. Key strategic moves and developments
- 9.2. Emergent Bio Solutions Inc.
- 9.2.1. Company overview
- 9.2.2. Key executives
- 9.2.3. Company snapshot
- 9.2.4. Operating business segments
- 9.2.5. Product portfolio
- 9.2.6. Business performance
- 9.2.7. Key strategic moves and developments
- 9.3. GlaxoSmithKline Plc.
- 9.3.1. Company overview
- 9.3.2. Key executives
- 9.3.3. Company snapshot
- 9.3.4. Operating business segments
- 9.3.5. Product portfolio
- 9.3.6. Business performance
- 9.3.7. Key strategic moves and developments
- 9.4. Merck & Co., Inc.
- 9.4.1. Company overview
- 9.4.2. Key executives
- 9.4.3. Company snapshot
- 9.4.4. Operating business segments
- 9.4.5. Product portfolio
- 9.4.6. Business performance
- 9.4.7. Key strategic moves and developments
- 9.5. Pfizer
- 9.5.1. Company overview
- 9.5.2. Key executives
- 9.5.3. Company snapshot
- 9.5.4. Operating business segments
- 9.5.5. Product portfolio
- 9.5.6. Business performance
- 9.5.7. Key strategic moves and developments
- 9.6. Sanofi
- 9.6.1. Company overview
- 9.6.2. Key executives
- 9.6.3. Company snapshot
- 9.6.4. Operating business segments
- 9.6.5. Product portfolio
- 9.6.6. Business performance
- 9.6.7. Key strategic moves and developments
- 9.7. Serum Institute of India Pvt. Ltd.
- 9.7.1. Company overview
- 9.7.2. Key executives
- 9.7.3. Company snapshot
- 9.7.4. Operating business segments
- 9.7.5. Product portfolio
- 9.7.6. Business performance
- 9.7.7. Key strategic moves and developments
- 9.8. Bavarian Nordic
- 9.8.1. Company overview
- 9.8.2. Key executives
- 9.8.3. Company snapshot
- 9.8.4. Operating business segments
- 9.8.5. Product portfolio
- 9.8.6. Business performance
- 9.8.7. Key strategic moves and developments
- 9.9. Zhi Fei Biological
- 9.9.1. Company overview
- 9.9.2. Key executives
- 9.9.3. Company snapshot
- 9.9.4. Operating business segments
- 9.9.5. Product portfolio
- 9.9.6. Business performance
- 9.9.7. Key strategic moves and developments
- 9.10. Bharat Biotech
- 9.10.1. Company overview
- 9.10.2. Key executives
- 9.10.3. Company snapshot
- 9.10.4. Operating business segments
- 9.10.5. Product portfolio
- 9.10.6. Business performance
- 9.10.7. Key strategic moves and developments
LIST OF TABLES
- TABLE 01. GLOBAL VACCINES MARKET, BY TECHNOLOGY TYPE, 2023-2035 ($MILLION)
- TABLE 02. VACCINES MARKET FOR RECOMBINANT AND CONJUGATE VACCINES, BY REGION, 2023-2035 ($MILLION)
- TABLE 03. VACCINES MARKET FOR LIVE ATTENUATED VACCINES, BY REGION, 2023-2035 ($MILLION)
- TABLE 04. VACCINES MARKET FOR INACTIVATED VACCINES, BY REGION, 2023-2035 ($MILLION)
- TABLE 05. VACCINES MARKET FOR TOXOID VACCINES, BY REGION, 2023-2035 ($MILLION)
- TABLE 06. VACCINES MARKET FOR OTHERS, BY REGION, 2023-2035 ($MILLION)
- TABLE 07. GLOBAL VACCINES MARKET, BY INDICATION, 2023-2035 ($MILLION)
- TABLE 08. VACCINES MARKET FOR PNEUMOCOCCAL DISEASE, BY REGION, 2023-2035 ($MILLION)
- TABLE 09. VACCINES MARKET FOR INFLUENZA, BY REGION, 2023-2035 ($MILLION)
- TABLE 10. VACCINES MARKET FOR HUMAN PAPILLOMA VIRUS, BY REGION, 2023-2035 ($MILLION)
- TABLE 11. VACCINES MARKET FOR MENINGOCOCCAL DISEASE, BY REGION, 2023-2035 ($MILLION)
- TABLE 12. VACCINES MARKET FOR ROTAVIRUS, BY REGION, 2023-2035 ($MILLION)
- TABLE 13. VACCINES MARKET FOR VARICELLA, BY REGION, 2023-2035 ($MILLION)
- TABLE 14. VACCINES MARKET FOR MEASLES, MUMPS, AND RUBELLA, BY REGION, 2023-2035 ($MILLION)
- TABLE 15. VACCINES MARKET FOR DIPHTHERIA, PERTUSSIS, AND TETANUS (DTP), BY REGION, 2023-2035 ($MILLION)
- TABLE 16. VACCINES MARKET FOR POLIO, BY REGION, 2023-2035 ($MILLION)
- TABLE 17. VACCINES MARKET FOR HEPATITIS, BY REGION, 2023-2035 ($MILLION)
- TABLE 18. VACCINES MARKET FOR OTHER INDICATIONS, BY REGION, 2023-2035 ($MILLION)
- TABLE 19. GLOBAL VACCINES MARKET, BY END USER, 2023-2035 ($MILLION)
- TABLE 20. VACCINES MARKET FOR PEDIATRIC, BY REGION, 2023-2035 ($MILLION)
- TABLE 21. VACCINES MARKET FOR ADULTS, BY REGION, 2023-2035 ($MILLION)
- TABLE 22. VACCINES MARKET FOR TRAVELERS, BY REGION, 2023-2035 ($MILLION)
- TABLE 23. VACCINES MARKET, BY REGION, 2023-2035 ($MILLION)
- TABLE 24. NORTH AMERICA VACCINES MARKET, BY TECHNOLOGY TYPE, 2023-2035 ($MILLION)
- TABLE 25. NORTH AMERICA VACCINES MARKET, BY INDICATION, 2023-2035 ($MILLION)
- TABLE 26. NORTH AMERICA VACCINES MARKET, BY END USER, 2023-2035 ($MILLION)
- TABLE 27. NORTH AMERICA VACCINES MARKET, BY COUNTRY, 2023-2035 ($MILLION)
- TABLE 28. U.S. VACCINES MARKET, BY TECHNOLOGY TYPE, 2023-2035 ($MILLION)
- TABLE 29. U.S. VACCINES MARKET, BY INDICATION, 2023-2035 ($MILLION)
- TABLE 30. U.S. VACCINES MARKET, BY END USER, 2023-2035 ($MILLION)
- TABLE 31. CANADA VACCINES MARKET, BY TECHNOLOGY TYPE, 2023-2035 ($MILLION)
- TABLE 32. CANADA VACCINES MARKET, BY INDICATION, 2023-2035 ($MILLION)
- TABLE 33. CANADA VACCINES MARKET, BY END USER, 2023-2035 ($MILLION)
- TABLE 34. MEXICO VACCINES MARKET, BY TECHNOLOGY TYPE, 2023-2035 ($MILLION)
- TABLE 35. MEXICO VACCINES MARKET, BY INDICATION, 2023-2035 ($MILLION)
- TABLE 36. MEXICO VACCINES MARKET, BY END USER, 2023-2035 ($MILLION)
- TABLE 37. EUROPE VACCINES MARKET, BY TECHNOLOGY TYPE, 2023-2035 ($MILLION)
- TABLE 38. EUROPE VACCINES MARKET, BY INDICATION, 2023-2035 ($MILLION)
- TABLE 39. EUROPE VACCINES MARKET, BY END USER, 2023-2035 ($MILLION)
- TABLE 40. EUROPE VACCINES MARKET, BY COUNTRY, 2023-2035 ($MILLION)
- TABLE 41. GERMANY VACCINES MARKET, BY TECHNOLOGY TYPE, 2023-2035 ($MILLION)
- TABLE 42. GERMANY VACCINES MARKET, BY INDICATION, 2023-2035 ($MILLION)
- TABLE 43. GERMANY VACCINES MARKET, BY END USER, 2023-2035 ($MILLION)
- TABLE 44. FRANCE VACCINES MARKET, BY TECHNOLOGY TYPE, 2023-2035 ($MILLION)
- TABLE 45. FRANCE VACCINES MARKET, BY INDICATION, 2023-2035 ($MILLION)
- TABLE 46. FRANCE VACCINES MARKET, BY END USER, 2023-2035 ($MILLION)
- TABLE 47. UK VACCINES MARKET, BY TECHNOLOGY TYPE, 2023-2035 ($MILLION)
- TABLE 48. UK VACCINES MARKET, BY INDICATION, 2023-2035 ($MILLION)
- TABLE 49. UK VACCINES MARKET, BY END USER, 2023-2035 ($MILLION)
- TABLE 50. ITALY VACCINES MARKET, BY TECHNOLOGY TYPE, 2023-2035 ($MILLION)
- TABLE 51. ITALY VACCINES MARKET, BY INDICATION, 2023-2035 ($MILLION)
- TABLE 52. ITALY VACCINES MARKET, BY END USER, 2023-2035 ($MILLION)
- TABLE 53. SPAIN VACCINES MARKET, BY TECHNOLOGY TYPE, 2023-2035 ($MILLION)
- TABLE 54. SPAIN VACCINES MARKET, BY INDICATION, 2023-2035 ($MILLION)
- TABLE 55. SPAIN VACCINES MARKET, BY END USER, 2023-2035 ($MILLION)
- TABLE 56. REST OF EUROPE VACCINES MARKET, BY TECHNOLOGY TYPE, 2023-2035 ($MILLION)
- TABLE 57. REST OF EUROPE VACCINES MARKET, BY INDICATION, 2023-2035 ($MILLION)
- TABLE 58. REST OF EUROPE VACCINES MARKET, BY END USER, 2023-2035 ($MILLION)
- TABLE 59. ASIA-PACIFIC VACCINES MARKET, BY TECHNOLOGY TYPE, 2023-2035 ($MILLION)
- TABLE 60. ASIA-PACIFIC VACCINES MARKET, BY INDICATION, 2023-2035 ($MILLION)
- TABLE 61. ASIA-PACIFIC VACCINES MARKET, BY END USER, 2023-2035 ($MILLION)
- TABLE 62. ASIA-PACIFIC VACCINES MARKET, BY COUNTRY, 2023-2035 ($MILLION)
- TABLE 63. JAPAN VACCINES MARKET, BY TECHNOLOGY TYPE, 2023-2035 ($MILLION)
- TABLE 64. JAPAN VACCINES MARKET, BY INDICATION, 2023-2035 ($MILLION)
- TABLE 65. JAPAN VACCINES MARKET, BY END USER, 2023-2035 ($MILLION)
- TABLE 66. CHINA VACCINES MARKET, BY TECHNOLOGY TYPE, 2023-2035 ($MILLION)
- TABLE 67. CHINA VACCINES MARKET, BY INDICATION, 2023-2035 ($MILLION)
- TABLE 68. CHINA VACCINES MARKET, BY END USER, 2023-2035 ($MILLION)
- TABLE 69. INDIA VACCINES MARKET, BY TECHNOLOGY TYPE, 2023-2035 ($MILLION)
- TABLE 70. INDIA VACCINES MARKET, BY INDICATION, 2023-2035 ($MILLION)
- TABLE 71. INDIA VACCINES MARKET, BY END USER, 2023-2035 ($MILLION)
- TABLE 72. AUSTRALIA VACCINES MARKET, BY TECHNOLOGY TYPE, 2023-2035 ($MILLION)
- TABLE 73. AUSTRALIA VACCINES MARKET, BY INDICATION, 2023-2035 ($MILLION)
- TABLE 74. AUSTRALIA VACCINES MARKET, BY END USER, 2023-2035 ($MILLION)
- TABLE 75. SOUTH KOREA VACCINES MARKET, BY TECHNOLOGY TYPE, 2023-2035 ($MILLION)
- TABLE 76. SOUTH KOREA VACCINES MARKET, BY INDICATION, 2023-2035 ($MILLION)
- TABLE 77. SOUTH KOREA VACCINES MARKET, BY END USER, 2023-2035 ($MILLION)
- TABLE 78. REST OF ASIA-PACIFIC VACCINES MARKET, BY TECHNOLOGY TYPE, 2023-2035 ($MILLION)
- TABLE 79. REST OF ASIA-PACIFIC VACCINES MARKET, BY INDICATION, 2023-2035 ($MILLION)
- TABLE 80. REST OF ASIA-PACIFIC VACCINES MARKET, BY END USER, 2023-2035 ($MILLION)
- TABLE 81. LAMEA VACCINES MARKET, BY TECHNOLOGY TYPE, 2023-2035 ($MILLION)
- TABLE 82. LAMEA VACCINES MARKET, BY INDICATION, 2023-2035 ($MILLION)
- TABLE 83. LAMEA VACCINES MARKET, BY END USER, 2023-2035 ($MILLION)
- TABLE 84. LAMEA VACCINES MARKET, BY COUNTRY, 2023-2035 ($MILLION)
- TABLE 85. BRAZIL VACCINES MARKET, BY TECHNOLOGY TYPE, 2023-2035 ($MILLION)
- TABLE 86. BRAZIL VACCINES MARKET, BY INDICATION, 2023-2035 ($MILLION)
- TABLE 87. BRAZIL VACCINES MARKET, BY END USER, 2023-2035 ($MILLION)
- TABLE 88. SAUDI ARABIA VACCINES MARKET, BY TECHNOLOGY TYPE, 2023-2035 ($MILLION)
- TABLE 89. SAUDI ARABIA VACCINES MARKET, BY INDICATION, 2023-2035 ($MILLION)
- TABLE 90. SAUDI ARABIA VACCINES MARKET, BY END USER, 2023-2035 ($MILLION)
- TABLE 91. SOUTH AFRICA VACCINES MARKET, BY TECHNOLOGY TYPE, 2023-2035 ($MILLION)
- TABLE 92. SOUTH AFRICA VACCINES MARKET, BY INDICATION, 2023-2035 ($MILLION)
- TABLE 93. SOUTH AFRICA VACCINES MARKET, BY END USER, 2023-2035 ($MILLION)
- TABLE 94. REST OF LAMEA VACCINES MARKET, BY TECHNOLOGY TYPE, 2023-2035 ($MILLION)
- TABLE 95. REST OF LAMEA VACCINES MARKET, BY INDICATION, 2023-2035 ($MILLION)
- TABLE 96. REST OF LAMEA VACCINES MARKET, BY END USER, 2023-2035 ($MILLION)
- TABLE 97. CSL LIMITED: KEY EXECUTIVES
- TABLE 98. CSL LIMITED: COMPANY SNAPSHOT
- TABLE 99. CSL LIMITED: PRODUCT SEGMENTS
- TABLE 100. CSL LIMITED: SERVICE SEGMENTS
- TABLE 101. CSL LIMITED: PRODUCT PORTFOLIO
- TABLE 102. CSL LIMITED: KEY STRATEGIES
- TABLE 103. EMERGENT BIO SOLUTIONS INC.: KEY EXECUTIVES
- TABLE 104. EMERGENT BIO SOLUTIONS INC.: COMPANY SNAPSHOT
- TABLE 105. EMERGENT BIO SOLUTIONS INC.: PRODUCT SEGMENTS
- TABLE 106. EMERGENT BIO SOLUTIONS INC.: SERVICE SEGMENTS
- TABLE 107. EMERGENT BIO SOLUTIONS INC.: PRODUCT PORTFOLIO
- TABLE 108. EMERGENT BIO SOLUTIONS INC.: KEY STRATEGIES
- TABLE 109. GLAXOSMITHKLINE PLC.: KEY EXECUTIVES
- TABLE 110. GLAXOSMITHKLINE PLC.: COMPANY SNAPSHOT
- TABLE 111. GLAXOSMITHKLINE PLC.: PRODUCT SEGMENTS
- TABLE 112. GLAXOSMITHKLINE PLC.: SERVICE SEGMENTS
- TABLE 113. GLAXOSMITHKLINE PLC.: PRODUCT PORTFOLIO
- TABLE 114. GLAXOSMITHKLINE PLC.: KEY STRATEGIES
- TABLE 115. MERCK & CO., INC.: KEY EXECUTIVES
- TABLE 116. MERCK & CO., INC.: COMPANY SNAPSHOT
- TABLE 117. MERCK & CO., INC.: PRODUCT SEGMENTS
- TABLE 118. MERCK & CO., INC.: SERVICE SEGMENTS
- TABLE 119. MERCK & CO., INC.: PRODUCT PORTFOLIO
- TABLE 120. MERCK & CO., INC.: KEY STRATEGIES
- TABLE 121. PFIZER: KEY EXECUTIVES
- TABLE 122. PFIZER: COMPANY SNAPSHOT
- TABLE 123. PFIZER: PRODUCT SEGMENTS
- TABLE 124. PFIZER: SERVICE SEGMENTS
- TABLE 125. PFIZER: PRODUCT PORTFOLIO
- TABLE 126. PFIZER: KEY STRATEGIES
- TABLE 127. SANOFI: KEY EXECUTIVES
- TABLE 128. SANOFI: COMPANY SNAPSHOT
- TABLE 129. SANOFI: PRODUCT SEGMENTS
- TABLE 130. SANOFI: SERVICE SEGMENTS
- TABLE 131. SANOFI: PRODUCT PORTFOLIO
- TABLE 132. SANOFI: KEY STRATEGIES
- TABLE 133. SERUM INSTITUTE OF INDIA PVT. LTD.: KEY EXECUTIVES
- TABLE 134. SERUM INSTITUTE OF INDIA PVT. LTD.: COMPANY SNAPSHOT
- TABLE 135. SERUM INSTITUTE OF INDIA PVT. LTD.: PRODUCT SEGMENTS
- TABLE 136. SERUM INSTITUTE OF INDIA PVT. LTD.: SERVICE SEGMENTS
- TABLE 137. SERUM INSTITUTE OF INDIA PVT. LTD.: PRODUCT PORTFOLIO
- TABLE 138. SERUM INSTITUTE OF INDIA PVT. LTD.: KEY STRATEGIES
- TABLE 139. BAVARIAN NORDIC: KEY EXECUTIVES
- TABLE 140. BAVARIAN NORDIC: COMPANY SNAPSHOT
- TABLE 141. BAVARIAN NORDIC: PRODUCT SEGMENTS
- TABLE 142. BAVARIAN NORDIC: SERVICE SEGMENTS
- TABLE 143. BAVARIAN NORDIC: PRODUCT PORTFOLIO
- TABLE 144. BAVARIAN NORDIC: KEY STRATEGIES
- TABLE 145. ZHI FEI BIOLOGICAL: KEY EXECUTIVES
- TABLE 146. ZHI FEI BIOLOGICAL: COMPANY SNAPSHOT
- TABLE 147. ZHI FEI BIOLOGICAL: PRODUCT SEGMENTS
- TABLE 148. ZHI FEI BIOLOGICAL: SERVICE SEGMENTS
- TABLE 149. ZHI FEI BIOLOGICAL: PRODUCT PORTFOLIO
- TABLE 150. ZHI FEI BIOLOGICAL: KEY STRATEGIES
- TABLE 151. BHARAT BIOTECH: KEY EXECUTIVES
- TABLE 152. BHARAT BIOTECH: COMPANY SNAPSHOT
- TABLE 153. BHARAT BIOTECH: PRODUCT SEGMENTS
- TABLE 154. BHARAT BIOTECH: SERVICE SEGMENTS
- TABLE 155. BHARAT BIOTECH: PRODUCT PORTFOLIO
- TABLE 156. BHARAT BIOTECH: KEY STRATEGIES
LIST OF FIGURES
- FIGURE 01. VACCINES MARKET, 2023-2035
- FIGURE 02. SEGMENTATION OF VACCINES MARKET,2023-2035
- FIGURE 03. TOP IMPACTING FACTORS IN VACCINES MARKET
- FIGURE 04. TOP INVESTMENT POCKETS IN VACCINES MARKET (2024-2035)
- FIGURE 05. BARGAINING POWER OF SUPPLIERS
- FIGURE 06. BARGAINING POWER OF BUYERS
- FIGURE 07. THREAT OF SUBSTITUTION
- FIGURE 08. THREAT OF SUBSTITUTION
- FIGURE 09. COMPETITIVE RIVALRY
- FIGURE 10. GLOBAL VACCINES MARKET:DRIVERS, RESTRAINTS AND OPPORTUNITIES
- FIGURE 11. VACCINES MARKET, BY TECHNOLOGY TYPE, 2023 AND 2035(%)
- FIGURE 12. COMPARATIVE SHARE ANALYSIS OF VACCINES MARKET FOR RECOMBINANT AND CONJUGATE VACCINES, BY COUNTRY 2023 AND 2035(%)
- FIGURE 13. COMPARATIVE SHARE ANALYSIS OF VACCINES MARKET FOR LIVE ATTENUATED VACCINES, BY COUNTRY 2023 AND 2035(%)
- FIGURE 14. COMPARATIVE SHARE ANALYSIS OF VACCINES MARKET FOR INACTIVATED VACCINES, BY COUNTRY 2023 AND 2035(%)
- FIGURE 15. COMPARATIVE SHARE ANALYSIS OF VACCINES MARKET FOR TOXOID VACCINES, BY COUNTRY 2023 AND 2035(%)
- FIGURE 16. COMPARATIVE SHARE ANALYSIS OF VACCINES MARKET FOR OTHERS, BY COUNTRY 2023 AND 2035(%)
- FIGURE 17. VACCINES MARKET, BY INDICATION, 2023 AND 2035(%)
- FIGURE 18. COMPARATIVE SHARE ANALYSIS OF VACCINES MARKET FOR PNEUMOCOCCAL DISEASE, BY COUNTRY 2023 AND 2035(%)
- FIGURE 19. COMPARATIVE SHARE ANALYSIS OF VACCINES MARKET FOR INFLUENZA, BY COUNTRY 2023 AND 2035(%)
- FIGURE 20. COMPARATIVE SHARE ANALYSIS OF VACCINES MARKET FOR HUMAN PAPILLOMA VIRUS, BY COUNTRY 2023 AND 2035(%)
- FIGURE 21. COMPARATIVE SHARE ANALYSIS OF VACCINES MARKET FOR MENINGOCOCCAL DISEASE, BY COUNTRY 2023 AND 2035(%)
- FIGURE 22. COMPARATIVE SHARE ANALYSIS OF VACCINES MARKET FOR ROTAVIRUS, BY COUNTRY 2023 AND 2035(%)
- FIGURE 23. COMPARATIVE SHARE ANALYSIS OF VACCINES MARKET FOR VARICELLA, BY COUNTRY 2023 AND 2035(%)
- FIGURE 24. COMPARATIVE SHARE ANALYSIS OF VACCINES MARKET FOR MEASLES, MUMPS, AND RUBELLA, BY COUNTRY 2023 AND 2035(%)
- FIGURE 25. COMPARATIVE SHARE ANALYSIS OF VACCINES MARKET FOR DIPHTHERIA, PERTUSSIS, AND TETANUS (DTP), BY COUNTRY 2023 AND 2035(%)
- FIGURE 26. COMPARATIVE SHARE ANALYSIS OF VACCINES MARKET FOR POLIO, BY COUNTRY 2023 AND 2035(%)
- FIGURE 27. COMPARATIVE SHARE ANALYSIS OF VACCINES MARKET FOR HEPATITIS, BY COUNTRY 2023 AND 2035(%)
- FIGURE 28. COMPARATIVE SHARE ANALYSIS OF VACCINES MARKET FOR OTHER INDICATIONS, BY COUNTRY 2023 AND 2035(%)
- FIGURE 29. VACCINES MARKET, BY END USER, 2023 AND 2035(%)
- FIGURE 30. COMPARATIVE SHARE ANALYSIS OF VACCINES MARKET FOR PEDIATRIC, BY COUNTRY 2023 AND 2035(%)
- FIGURE 31. COMPARATIVE SHARE ANALYSIS OF VACCINES MARKET FOR ADULTS, BY COUNTRY 2023 AND 2035(%)
- FIGURE 32. COMPARATIVE SHARE ANALYSIS OF VACCINES MARKET FOR TRAVELERS, BY COUNTRY 2023 AND 2035(%)
- FIGURE 33. VACCINES MARKET BY REGION, 2023 AND 2035(%)
- FIGURE 34. U.S. VACCINES MARKET, 2023-2035 ($MILLION)
- FIGURE 35. CANADA VACCINES MARKET, 2023-2035 ($MILLION)
- FIGURE 36. MEXICO VACCINES MARKET, 2023-2035 ($MILLION)
- FIGURE 37. GERMANY VACCINES MARKET, 2023-2035 ($MILLION)
- FIGURE 38. FRANCE VACCINES MARKET, 2023-2035 ($MILLION)
- FIGURE 39. UK VACCINES MARKET, 2023-2035 ($MILLION)
- FIGURE 40. ITALY VACCINES MARKET, 2023-2035 ($MILLION)
- FIGURE 41. SPAIN VACCINES MARKET, 2023-2035 ($MILLION)
- FIGURE 42. REST OF EUROPE VACCINES MARKET, 2023-2035 ($MILLION)
- FIGURE 43. JAPAN VACCINES MARKET, 2023-2035 ($MILLION)
- FIGURE 44. CHINA VACCINES MARKET, 2023-2035 ($MILLION)
- FIGURE 45. INDIA VACCINES MARKET, 2023-2035 ($MILLION)
- FIGURE 46. AUSTRALIA VACCINES MARKET, 2023-2035 ($MILLION)
- FIGURE 47. SOUTH KOREA VACCINES MARKET, 2023-2035 ($MILLION)
- FIGURE 48. REST OF ASIA-PACIFIC VACCINES MARKET, 2023-2035 ($MILLION)
- FIGURE 49. BRAZIL VACCINES MARKET, 2023-2035 ($MILLION)
- FIGURE 50. SAUDI ARABIA VACCINES MARKET, 2023-2035 ($MILLION)
- FIGURE 51. SOUTH AFRICA VACCINES MARKET, 2023-2035 ($MILLION)
- FIGURE 52. REST OF LAMEA VACCINES MARKET, 2023-2035 ($MILLION)
- FIGURE 53. TOP WINNING STRATEGIES, BY YEAR
- FIGURE 54. TOP WINNING STRATEGIES, BY DEVELOPMENT
- FIGURE 55. TOP WINNING STRATEGIES, BY COMPANY
- FIGURE 56. PRODUCT MAPPING OF TOP 10 PLAYERS
- FIGURE 57. COMPETITIVE DASHBOARD
- FIGURE 58. COMPETITIVE HEATMAP: VACCINES MARKET
- FIGURE 59. TOP PLAYER POSITIONING, 2023
02-2729-4219
+886-2-2729-4219
 數位疫苗市場-全球產業規模、佔有率、趨勢、機會及預測,按設備類型、應用、地區及競爭情況細分,2020-2030 年麻疹、腮腺炎、德國麻疹疫苗市場-全球產業規模、佔有率、趨勢、機會和預測,按類型、目標族群、配銷通路、地區和競爭細分,2020-2030 年
 2026 年至 2032 年成人疫苗市場(按疫苗、疫苗類型、技術、最終用戶和地區分類)2026-2032 年食品疫苗市場(按類型、應用和地區)2026-2032 年黃熱病疫苗市場(按治療類型、最終用戶和地區分類)全球清真營養品和疫苗銷售市場規模(按產品類型、應用、分銷管道、地區、範圍和預測)全球生物製藥和疫苗製造市場規模(按產品類型、技術、應用、區域範圍和預測)全球蜱傳腦炎去活化疫苗市場規模(按病毒類型、最終用戶、區域範圍和預測)全球裂谷熱(RVF)疫苗市場按類型、應用、地區和預測:全球豬瘟疫苗市場規模(依產品、應用、區域範圍及預測)
▼