


 |
市場調查報告書
商品編碼
1472383
冷凍鮪魚市場:按類型、按應用分類:2023-2032 年全球機會分析與產業預測Frozen Tuna Market By Type, By Application : Global Opportunity Analysis and Industry Forecast, 2023-2032 |
||||||
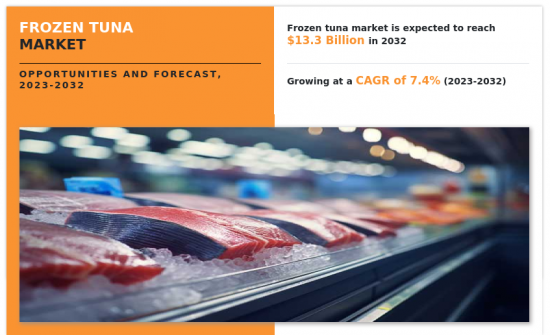
全球冷凍鮪魚市場預計將從2022年的65.79億美元成長到2032年的133.428億美元,2023年至2032年的複合年成長率為7.4%。
「冷凍鮪魚」通常是指經過冷凍保存的鮪魚。鮪魚是一種受歡迎的魚貝類,冷凍是延長保存期限和保持新鮮度的常用方法。快速冷凍鮪魚可防止導致腐敗的細菌和其他微生物的生長。冷凍鮪魚常用於生魚片和壽司等各種菜餚。此外,冷凍可以保留質地和風味,從而保持魚的品質。此外,冷凍金槍魚便於儲存和運輸,因此可以全年使用,即使是當季的新鮮金槍魚。
冷凍鮪魚富含蛋白質、 Omega-3脂肪酸、維生素和礦物質,以其高營養價值而聞名。消費者越來越注重健康,並尋求有助於整體健康的食品。鮪魚中發現的Omega-3脂肪酸尤其以支持心臟健康和認知功能而聞名。隨著消費者越來越意識到包括鮪魚在內的魚貝類的營養價值,他們在飲食中加入了更多的魚類。魚貝類經常被宣傳為紅肉的健康替代品,而鮪魚的高營養價值符合這一趨勢。冷凍鮪魚可以長期保存,為消費者提供便利,使膳食計劃更容易,並減少雜貨購物的頻率。此外,冷凍鮪魚具有多種烹飪用途,使其成為尋求多樣化和方便膳食選擇的消費者的多功能選擇。隨著全球化的發展,消費者可以獲得各種各樣的水產品,包括幾種鮪魚。這擴大了消費者的選擇,增加了他們接觸各種鮪魚產品的機會,有助於新興國家市場的開拓。此外,消費者也關心食品的永續性。強調永續和負責任捕撈的金槍魚漁業和品牌正在吸引具有環保意識的消費者。海洋管理委員會 (MSC) 等認證會影響採購決策並推動對永續採購的冷凍鮪魚的需求。
然而,世界各地的鮪魚族群正面臨過度捕撈的威脅,捕撈率超過了自然繁殖率。預計這將導致鮪魚資源枯竭,破壞海洋生態系統的平衡,並影響依賴鮪魚的其他海洋物種。鮪魚捕撈經常無意中捕獲非目標物種,稱為兼捕。兼捕包括瀕危物種和非商業物種,導致生物多樣性喪失和海洋生態系統崩壞。因此,解決兼捕問題對於永續鮪魚捕撈活動至關重要。某些鮪魚捕撈方法,例如圍網捕撈和延繩釣捕撈,會造成棲息地破壞。例如,在圍網捕撈中使用魚類聚集裝置(FAD)可能會導致非目標物種的夾帶,延繩釣捕撈會對海底造成損害。這些做法大大加劇了海洋棲息地的劣化。各國政府和國際組織實施了嚴格的法規,以促進永續捕撈並減少捕撈對環境的影響。遵守這些法規給冷凍金槍魚市場相關人員不採取永續和負責任的捕撈方式的人帶來了挑戰。 MSC 等認證計劃為永續和管理良好的漁業制定了標準。滿足這些認證要求是冷凍鮪魚市場參與者的限制,但對於獲得消費者信任和進入特定市場非常重要。
相反,由於消費者偏好的變化,全球對冷凍鮪魚的需求正在增加。鮪魚富含優質蛋白質,對於肌肉發育、組織修復和整體健康至關重要。隨著人們越來越重視富含蛋白質的飲食,冷凍鮪魚已成為尋求滿足蛋白質需求的消費者的便利且多功能的選擇。鮪魚富含Omega-3脂肪酸,尤其是 EPA 和 DHA,眾所周知,它們有助於心臟健康。將冷凍鮪魚作為這些必需脂肪酸的天然來源進行行銷,可以吸引具有健康意識的消費者尋找支持心血管健康的食品。鮪魚熱量和脂肪含量低,對於注重體重管理和維持健康飲食的消費者來說是一個不錯的選擇。此外,冷凍鮪魚可以長期保存而不影響其營養價值,非常方便。隨著忙碌的生活方式,消費者正在尋找快速、簡單的飲食解決方案。因此,將冷凍鮪魚推廣為省時且營養豐富的蛋白質來源,將引起尋求無憂健康膳食選擇的消費者的共鳴。消費者對採購永續且負責任的水產品越來越感興趣。因此,冷凍鮪魚市場的品牌有望透過強調環保捕撈方法和透明的供應鏈來提高競爭力。
相關人員的主要利益
- 該報告提供了 2022 年至 2032 年冷凍鮪魚市場分析的細分市場、當前趨勢、估計和趨勢分析的定量分析,並總體上確定了冷凍鮪魚市場的機會。
- 我們提供市場研究以及與市場促進因素、市場限制和市場機會相關的資訊。
- 波特的五力分析揭示了買家和供應商的潛力,幫助相關人員做出利潤驅動的業務決策並加強供應商和買家網路。
- 對冷凍鮪魚市場細分的詳細分析有助於識別市場機會。
- 每個地區的主要國家都根據其對全球市場的收益貢獻繪製了地圖。
- 市場參與者定位有助於對標,並可以清楚了解市場參與者的當前地位。
- 該報告包括對區域和全球冷凍鮪魚市場趨勢、主要企業、細分市場、應用領域和市場成長策略的分析。
可以使用此報告進行報告客製化(需要額外費用和時間表)
- 消費者購買行為分析
- 最終用戶偏好和痛點
- 投資機會
- 按地區分類的新參與企業
- 科技趨勢分析
- 打入市場策略
- 按產品/細分市場細分
- 痛點分析
- 監管指引
- 策略建議
- 針對客戶興趣的其他公司簡介
- 按國家或地區進行的附加分析 – 市場規模和預測
- 十字交叉細分市場分析 - 市場規模與預測
- 公司簡介的擴充列表
- 歷史市場資料
- 主要參與者的詳細資料(Excel格式,包括位置、聯絡資訊、供應商/供應商網路等)
- 全球/區域/國家層級參與者的市場佔有率分析
目錄
第1章簡介
第 2 章執行摘要
第3章市場概況
- 市場定義和範圍
- 主要發現
- 影響因素
- 主要投資機會
- 波特五力分析
- 市場動態
- 促進因素
- 抑制因素
- 機會
- 平均售價
- 市場佔有率分析
- 品牌佔有率分析
- 貿易資料分析
- 產品消費
- 價值鏈分析
- 監管指引
- 關鍵監管分析
- 贖回場景
- 專利情況
第4章冷凍鮪魚市場:依類型
- 概述
- 冷凍長鰭鮪魚
- 冷凍大眼魚/ahi
- 冷凍藍鰭鮪魚
- 冷凍箕鬥傑克
- 冷凍黃鰭鮪魚
第5章冷凍鮪魚市場:依應用分類
- 概述
- 超級市場/大賣場
- 便利商店
- 專賣店
- 網路零售
第6章冷凍鮪魚市場:按地區
- 概述
- 北美洲
- 美國
- 加拿大
- 墨西哥
- 歐洲
- 德國
- 英國
- 俄羅斯
- 丹麥
- 挪威
- 其他
- 亞太地區
- 中國
- 日本
- 印度
- 台灣
- 印尼
- 其他
- 拉丁美洲/中東/非洲
- 巴西
- UAE
- 智利
- 南非
- 其他
第7章 競爭格局
- 介紹
- 關鍵成功策略
- 10家主要企業產品圖譜
- 競爭對手儀表板
- 競爭熱圖
- 2022年主要企業定位
第8章 公司簡介
- Brig-Star LLC
- chicken of the sea
- Dongwon Enterprise Company
- High Liner Foods
- Marine Harvest
- Nippon Suisan Kaisha aka Nissui
- Pescanova SA
- SalMar ASA
- Zoneco Group
- Tassal Group
The global frozen tuna market is anticipated to reach $13,342.8 million by 2032, growing from $6,579.0 million in 2022 at a CAGR of 7.4% from 2023 to 2032.
"Frozen tuna" typically refers to tuna fish that has been frozen for preservation. Tuna is a popular seafood and freezing is a common method used to extend its shelf life & maintain its freshness. The process involves rapidly freezing the tuna to exceptionally low temperatures, which helps to slow down the growth of bacteria and other microorganisms that lead to spoilage. Frozen tuna is often used in various culinary applications, including sashimi and sushi. Moreover, freezing helps to retain the quality of the fish by preserving its texture and flavor. In addition, frozen tuna is convenient for storage and transportation, allowing it to be available year-round even when fresh tuna is in season.
The frozen tuna is recognized for its nutritional value, being rich in protein, omega-3 fatty acids, vitamins, and minerals. Consumers are becoming more health-conscious, seeking foods that contribute to their overall well-being. The omega-3 fatty acids in tuna are particularly known for supporting heart health and cognitive function. As awareness about the nutritional benefits of seafood, including tuna increases, consumers are incorporating more fish into their diets. Seafood is often promoted as a healthy alternative to red meat and tuna's nutritional profile aligns with this trend. Frozen tuna offers convenience to consumers, owing to its ability to be stored for longer periods, allowing for easy meal planning and reducing the frequency of grocery shopping. In addition, frozen tuna is used in various culinary applications, making it a versatile choice for consumers seeking diverse and convenient meal options. With increasing globalization, consumers have access to a wide variety of seafood products, including several types of tuna. This has expanded consumer choices and exposed them to various tuna products, contributing to the development of the market. Moreover, consumers are concerned about the sustainability of their food choices. Tuna fisheries and brands that emphasize sustainable & responsible fishing practices attract environmentally conscious consumers. Certifications such as those from the Marine Stewardship Council (MSC) influence purchasing decisions, fueling the demand for sustainably sourced frozen tuna.
However, tuna populations globally are under threat from overfishing, where the rate of catching tuna exceeds their natural reproduction rate. This is expected to lead to the depletion of tuna stocks, disrupting the balance of marine ecosystems and affecting other marine species dependent on tuna. Tuna fishing often results in the unintentional capture of non-target species, known as bycatch. Bycatch includes endangered or non-commercial species, contributing to biodiversity loss and disrupting marine ecosystems. Hence, addressing bycatch is crucial for sustainable tuna fishing practices. Certain tuna fishing methods, such as purse seining and longlining, cause habitat destruction. For instance, the use of fish aggregating devices (FADs) in purse seining leads to the entanglement of non-target species and longlines cause damage to the ocean floor. These practices notably contribute to the degradation of marine habitats. Governments and international bodies are implementing stringent regulations to promote sustainable fishing practices as well as reduce the environmental impact of the fishing industry. Compliance with these regulations poses challenges for players in the frozen tuna market who do not adhere to sustainable and responsible fishing practices. Certification programs such as the MSC have implemented standards for sustainable and well-managed fisheries. Meeting these certification requirements acts as a constraint for players in the frozen tuna market, however, it is important for gaining consumer trust and access to certain markets.
On the contrary, the demand for frozen tuna is rising globally due to changing consumer preferences. Tuna is a rich source of high-quality protein, which is essential for muscle development, tissue repair, and overall health. With surging emphasis on protein-rich diets, frozen tuna is positioned as a convenient and versatile option for consumers seeking to meet their protein requirements. Tuna is abundant in omega-3 fatty acids, particularly EPA and DHA, which are known for their heart health benefits. Marketing frozen tuna as a natural source of these essential fatty acids attracts health-conscious consumers seeking foods which support cardiovascular well-being. Tuna is low in calories & fat, making it a suitable choice for individuals focused on weight management and maintaining a healthy diet. Furthermore, frozen tuna offers the convenience of longer storage without compromising nutritional value. With busy lifestyles, consumers seek quick & easy meal solutions; thus, promoting frozen tuna as a timesaving and nutritionally dense protein source resonates with individuals looking for hassle-free yet healthy meal options. Consumers are significantly concerned about sustainable and responsibly sourced seafood. Therefore, brands in the frozen tuna market are anticipated to gain a competitive edge by emphasizing eco-friendly fishing practices and transparent supply chains.
The key players profiled in this report include Brig-Star LLC, Chicken of the Sea, Dongwon Enterprise Company, High Liner Foods, Marine Harvest, Nippon Suisan Kaisha aka Nissui, Pescanova SA, SalMar ASA, Zoneco Group, and Tassal Group. The market players are continuously striving to gain one-upmanship in this competitive market using strategies such as collaborations and acquisitions.
Key Benefits For Stakeholders
- This report provides a quantitative analysis of the market segments, current trends, estimations, and dynamics of the frozen tuna market analysis from 2022 to 2032 to identify the prevailing frozen tuna market opportunities.
- The market research is offered along with information related to key drivers, restraints, and opportunities.
- Porter's five forces analysis highlights the potency of buyers and suppliers to enable stakeholders make profit-oriented business decisions and strengthen their supplier-buyer network.
- In-depth analysis of the frozen tuna market segmentation assists to determine the prevailing market opportunities.
- Major countries in each region are mapped according to their revenue contribution to the global market.
- Market player positioning facilitates benchmarking and provides a clear understanding of the present position of the market players.
- The report includes the analysis of the regional as well as global frozen tuna market trends, key players, market segments, application areas, and market growth strategies.
Additional benefits you will get with this purchase are:
- Quarterly Update and* (only available with a corporate license, on listed price)
- 5 additional Company Profile of client Choice pre- or Post-purchase, as a free update.
- Free Upcoming Version on the Purchase of Five and Enterprise User License.
- 16 analyst hours of support* (post-purchase, if you find additional data requirements upon review of the report, you may receive support amounting to 16 analyst hours to solve questions, and post-sale queries)
- 15% Free Customization* (in case the scope or segment of the report does not match your requirements, 15% is equivalent to 3 working days of free work, applicable once)
- Free data Pack on the Five and Enterprise User License. (Excel version of the report)
- Free Updated report if the report is 6-12 months old or older.
- 24-hour priority response*
- Free Industry updates and white papers.
Possible Customization with this report (with additional cost and timeline, please talk to the sales executive to know more)
- Consumer Buying Behavior Analysis
- End user preferences and pain points
- Investment Opportunities
- Upcoming/New Entrant by Regions
- Technology Trend Analysis
- Go To Market Strategy
- Market share analysis of players by products/segments
- Pain Point Analysis
- Regulatory Guidelines
- Strategic Recommedations
- Additional company profiles with specific to client's interest
- Additional country or region analysis- market size and forecast
- Criss-cross segment analysis- market size and forecast
- Expanded list for Company Profiles
- Historic market data
- Key player details (including location, contact details, supplier/vendor network etc. in excel format)
- Market share analysis of players at global/region/country level
Key Market Segments
By Type
- Frozen Albacore
- Frozen Big Eye Ahi
- Frozen Bluefin Tuna
- Frozen Skipjack
- Frozen Yellowfin Tuna
By Application
- Supermarkets/ Hypermarkets
- Convenience Stores
- Specialty Stores
- Online Retail
By Region
- North America
- U.S.
- Canada
- Mexico
- Europe
- Germany
- UK
- Russia
- Denmark
- Norway
- Rest of Europe
- Asia-Pacific
- China
- Japan
- India
- Taiwan
- Indonesia
- Rest of Asia-Pacific
- LAMEA
- Brazil
- UAE
- Chile
- South Africa
- Rest of LAMEA
Key Market Players:
- Brig-Star LLC
- chicken of the sea
- Dongwon Enterprise Company
- High Liner Foods
- Marine Harvest
- Nippon Suisan Kaisha aka Nissui
- Pescanova SA
- SalMar ASA
- Zoneco Group
- Tassal Group
TABLE OF CONTENTS
CHAPTER 1: INTRODUCTION
- 1.1. Report description
- 1.2. Key market segments
- 1.3. Key benefits to the stakeholders
- 1.4. Research methodology
- 1.4.1. Primary research
- 1.4.2. Secondary research
- 1.4.3. Analyst tools and models
CHAPTER 2: EXECUTIVE SUMMARY
- 2.1. CXO perspective
CHAPTER 3: MARKET OVERVIEW
- 3.1. Market definition and scope
- 3.2. Key findings
- 3.2.1. Top impacting factors
- 3.2.2. Top investment pockets
- 3.3. Porter's five forces analysis
- 3.4. Market dynamics
- 3.4.1. Drivers
- 3.4.2. Restraints
- 3.4.3. Opportunities
- 3.5. Average Selling Price
- 3.6. Market Share Analysis
- 3.7. Brand Share Analysis
- 3.8. Trade Data Analysis
- 3.9. Product Consumption
- 3.10. Value Chain Analysis
- 3.11. Regulatory Guidelines
- 3.12. Key Regulation Analysis
- 3.13. Reimbursement Scenario
- 3.14. Patent Landscape
CHAPTER 4: FROZEN TUNA MARKET, BY TYPE
- 4.1. Overview
- 4.1.1. Market size and forecast
- 4.2. Frozen Albacore
- 4.2.1. Key market trends, growth factors and opportunities
- 4.2.2. Market size and forecast, by region
- 4.2.3. Market share analysis by country
- 4.3. Frozen Big Eye Ahi
- 4.3.1. Key market trends, growth factors and opportunities
- 4.3.2. Market size and forecast, by region
- 4.3.3. Market share analysis by country
- 4.4. Frozen Bluefin Tuna
- 4.4.1. Key market trends, growth factors and opportunities
- 4.4.2. Market size and forecast, by region
- 4.4.3. Market share analysis by country
- 4.5. Frozen Skipjack
- 4.5.1. Key market trends, growth factors and opportunities
- 4.5.2. Market size and forecast, by region
- 4.5.3. Market share analysis by country
- 4.6. Frozen Yellowfin Tuna
- 4.6.1. Key market trends, growth factors and opportunities
- 4.6.2. Market size and forecast, by region
- 4.6.3. Market share analysis by country
CHAPTER 5: FROZEN TUNA MARKET, BY APPLICATION
- 5.1. Overview
- 5.1.1. Market size and forecast
- 5.2. Supermarkets/ Hypermarkets
- 5.2.1. Key market trends, growth factors and opportunities
- 5.2.2. Market size and forecast, by region
- 5.2.3. Market share analysis by country
- 5.3. Convenience Stores
- 5.3.1. Key market trends, growth factors and opportunities
- 5.3.2. Market size and forecast, by region
- 5.3.3. Market share analysis by country
- 5.4. Specialty Stores
- 5.4.1. Key market trends, growth factors and opportunities
- 5.4.2. Market size and forecast, by region
- 5.4.3. Market share analysis by country
- 5.5. Online Retail
- 5.5.1. Key market trends, growth factors and opportunities
- 5.5.2. Market size and forecast, by region
- 5.5.3. Market share analysis by country
CHAPTER 6: FROZEN TUNA MARKET, BY REGION
- 6.1. Overview
- 6.1.1. Market size and forecast By Region
- 6.2. North America
- 6.2.1. Key market trends, growth factors and opportunities
- 6.2.2. Market size and forecast, by Type
- 6.2.3. Market size and forecast, by Application
- 6.2.4. Market size and forecast, by country
- 6.2.4.1. U.S.
- 6.2.4.1.1. Market size and forecast, by Type
- 6.2.4.1.2. Market size and forecast, by Application
- 6.2.4.2. Canada
- 6.2.4.2.1. Market size and forecast, by Type
- 6.2.4.2.2. Market size and forecast, by Application
- 6.2.4.3. Mexico
- 6.2.4.3.1. Market size and forecast, by Type
- 6.2.4.3.2. Market size and forecast, by Application
- 6.3. Europe
- 6.3.1. Key market trends, growth factors and opportunities
- 6.3.2. Market size and forecast, by Type
- 6.3.3. Market size and forecast, by Application
- 6.3.4. Market size and forecast, by country
- 6.3.4.1. Germany
- 6.3.4.1.1. Market size and forecast, by Type
- 6.3.4.1.2. Market size and forecast, by Application
- 6.3.4.2. UK
- 6.3.4.2.1. Market size and forecast, by Type
- 6.3.4.2.2. Market size and forecast, by Application
- 6.3.4.3. Russia
- 6.3.4.3.1. Market size and forecast, by Type
- 6.3.4.3.2. Market size and forecast, by Application
- 6.3.4.4. Denmark
- 6.3.4.4.1. Market size and forecast, by Type
- 6.3.4.4.2. Market size and forecast, by Application
- 6.3.4.5. Norway
- 6.3.4.5.1. Market size and forecast, by Type
- 6.3.4.5.2. Market size and forecast, by Application
- 6.3.4.6. Rest of Europe
- 6.3.4.6.1. Market size and forecast, by Type
- 6.3.4.6.2. Market size and forecast, by Application
- 6.4. Asia-Pacific
- 6.4.1. Key market trends, growth factors and opportunities
- 6.4.2. Market size and forecast, by Type
- 6.4.3. Market size and forecast, by Application
- 6.4.4. Market size and forecast, by country
- 6.4.4.1. China
- 6.4.4.1.1. Market size and forecast, by Type
- 6.4.4.1.2. Market size and forecast, by Application
- 6.4.4.2. Japan
- 6.4.4.2.1. Market size and forecast, by Type
- 6.4.4.2.2. Market size and forecast, by Application
- 6.4.4.3. India
- 6.4.4.3.1. Market size and forecast, by Type
- 6.4.4.3.2. Market size and forecast, by Application
- 6.4.4.4. Taiwan
- 6.4.4.4.1. Market size and forecast, by Type
- 6.4.4.4.2. Market size and forecast, by Application
- 6.4.4.5. Indonesia
- 6.4.4.5.1. Market size and forecast, by Type
- 6.4.4.5.2. Market size and forecast, by Application
- 6.4.4.6. Rest of Asia-Pacific
- 6.4.4.6.1. Market size and forecast, by Type
- 6.4.4.6.2. Market size and forecast, by Application
- 6.5. LAMEA
- 6.5.1. Key market trends, growth factors and opportunities
- 6.5.2. Market size and forecast, by Type
- 6.5.3. Market size and forecast, by Application
- 6.5.4. Market size and forecast, by country
- 6.5.4.1. Brazil
- 6.5.4.1.1. Market size and forecast, by Type
- 6.5.4.1.2. Market size and forecast, by Application
- 6.5.4.2. UAE
- 6.5.4.2.1. Market size and forecast, by Type
- 6.5.4.2.2. Market size and forecast, by Application
- 6.5.4.3. Chile
- 6.5.4.3.1. Market size and forecast, by Type
- 6.5.4.3.2. Market size and forecast, by Application
- 6.5.4.4. South Africa
- 6.5.4.4.1. Market size and forecast, by Type
- 6.5.4.4.2. Market size and forecast, by Application
- 6.5.4.5. Rest of LAMEA
- 6.5.4.5.1. Market size and forecast, by Type
- 6.5.4.5.2. Market size and forecast, by Application
CHAPTER 7: COMPETITIVE LANDSCAPE
- 7.1. Introduction
- 7.2. Top winning strategies
- 7.3. Product mapping of top 10 player
- 7.4. Competitive dashboard
- 7.5. Competitive heatmap
- 7.6. Top player positioning, 2022
CHAPTER 8: COMPANY PROFILES
- 8.1. Brig-Star LLC
- 8.1.1. Company overview
- 8.1.2. Key executives
- 8.1.3. Company snapshot
- 8.1.4. Operating business segments
- 8.1.5. Product portfolio
- 8.1.6. Business performance
- 8.1.7. Key strategic moves and developments
- 8.2. chicken of the sea
- 8.2.1. Company overview
- 8.2.2. Key executives
- 8.2.3. Company snapshot
- 8.2.4. Operating business segments
- 8.2.5. Product portfolio
- 8.2.6. Business performance
- 8.2.7. Key strategic moves and developments
- 8.3. Dongwon Enterprise Company
- 8.3.1. Company overview
- 8.3.2. Key executives
- 8.3.3. Company snapshot
- 8.3.4. Operating business segments
- 8.3.5. Product portfolio
- 8.3.6. Business performance
- 8.3.7. Key strategic moves and developments
- 8.4. High Liner Foods
- 8.4.1. Company overview
- 8.4.2. Key executives
- 8.4.3. Company snapshot
- 8.4.4. Operating business segments
- 8.4.5. Product portfolio
- 8.4.6. Business performance
- 8.4.7. Key strategic moves and developments
- 8.5. Marine Harvest
- 8.5.1. Company overview
- 8.5.2. Key executives
- 8.5.3. Company snapshot
- 8.5.4. Operating business segments
- 8.5.5. Product portfolio
- 8.5.6. Business performance
- 8.5.7. Key strategic moves and developments
- 8.6. Nippon Suisan Kaisha aka Nissui
- 8.6.1. Company overview
- 8.6.2. Key executives
- 8.6.3. Company snapshot
- 8.6.4. Operating business segments
- 8.6.5. Product portfolio
- 8.6.6. Business performance
- 8.6.7. Key strategic moves and developments
- 8.7. Pescanova SA
- 8.7.1. Company overview
- 8.7.2. Key executives
- 8.7.3. Company snapshot
- 8.7.4. Operating business segments
- 8.7.5. Product portfolio
- 8.7.6. Business performance
- 8.7.7. Key strategic moves and developments
- 8.8. SalMar ASA
- 8.8.1. Company overview
- 8.8.2. Key executives
- 8.8.3. Company snapshot
- 8.8.4. Operating business segments
- 8.8.5. Product portfolio
- 8.8.6. Business performance
- 8.8.7. Key strategic moves and developments
- 8.9. Zoneco Group
- 8.9.1. Company overview
- 8.9.2. Key executives
- 8.9.3. Company snapshot
- 8.9.4. Operating business segments
- 8.9.5. Product portfolio
- 8.9.6. Business performance
- 8.9.7. Key strategic moves and developments
- 8.10. Tassal Group
- 8.10.1. Company overview
- 8.10.2. Key executives
- 8.10.3. Company snapshot
- 8.10.4. Operating business segments
- 8.10.5. Product portfolio
- 8.10.6. Business performance
- 8.10.7. Key strategic moves and developments
LIST OF TABLES
- TABLE 01. GLOBAL FROZEN TUNA MARKET, BY TYPE, 2022-2032 ($MILLION)
- TABLE 02. FROZEN TUNA MARKET FOR FROZEN ALBACORE, BY REGION, 2022-2032 ($MILLION)
- TABLE 03. FROZEN TUNA MARKET FOR FROZEN BIG EYE AHI, BY REGION, 2022-2032 ($MILLION)
- TABLE 04. FROZEN TUNA MARKET FOR FROZEN BLUEFIN TUNA, BY REGION, 2022-2032 ($MILLION)
- TABLE 05. FROZEN TUNA MARKET FOR FROZEN SKIPJACK, BY REGION, 2022-2032 ($MILLION)
- TABLE 06. FROZEN TUNA MARKET FOR FROZEN YELLOWFIN TUNA, BY REGION, 2022-2032 ($MILLION)
- TABLE 07. GLOBAL FROZEN TUNA MARKET, BY APPLICATION, 2022-2032 ($MILLION)
- TABLE 08. FROZEN TUNA MARKET FOR SUPERMARKETS/ HYPERMARKETS, BY REGION, 2022-2032 ($MILLION)
- TABLE 09. FROZEN TUNA MARKET FOR CONVENIENCE STORES, BY REGION, 2022-2032 ($MILLION)
- TABLE 10. FROZEN TUNA MARKET FOR SPECIALTY STORES, BY REGION, 2022-2032 ($MILLION)
- TABLE 11. FROZEN TUNA MARKET FOR ONLINE RETAIL, BY REGION, 2022-2032 ($MILLION)
- TABLE 12. FROZEN TUNA MARKET, BY REGION, 2022-2032 ($MILLION)
- TABLE 13. NORTH AMERICA FROZEN TUNA MARKET, BY TYPE, 2022-2032 ($MILLION)
- TABLE 14. NORTH AMERICA FROZEN TUNA MARKET, BY APPLICATION, 2022-2032 ($MILLION)
- TABLE 15. NORTH AMERICA FROZEN TUNA MARKET, BY COUNTRY, 2022-2032 ($MILLION)
- TABLE 16. U.S. FROZEN TUNA MARKET, BY TYPE, 2022-2032 ($MILLION)
- TABLE 17. U.S. FROZEN TUNA MARKET, BY APPLICATION, 2022-2032 ($MILLION)
- TABLE 18. CANADA FROZEN TUNA MARKET, BY TYPE, 2022-2032 ($MILLION)
- TABLE 19. CANADA FROZEN TUNA MARKET, BY APPLICATION, 2022-2032 ($MILLION)
- TABLE 20. MEXICO FROZEN TUNA MARKET, BY TYPE, 2022-2032 ($MILLION)
- TABLE 21. MEXICO FROZEN TUNA MARKET, BY APPLICATION, 2022-2032 ($MILLION)
- TABLE 22. EUROPE FROZEN TUNA MARKET, BY TYPE, 2022-2032 ($MILLION)
- TABLE 23. EUROPE FROZEN TUNA MARKET, BY APPLICATION, 2022-2032 ($MILLION)
- TABLE 24. EUROPE FROZEN TUNA MARKET, BY COUNTRY, 2022-2032 ($MILLION)
- TABLE 25. GERMANY FROZEN TUNA MARKET, BY TYPE, 2022-2032 ($MILLION)
- TABLE 26. GERMANY FROZEN TUNA MARKET, BY APPLICATION, 2022-2032 ($MILLION)
- TABLE 27. UK FROZEN TUNA MARKET, BY TYPE, 2022-2032 ($MILLION)
- TABLE 28. UK FROZEN TUNA MARKET, BY APPLICATION, 2022-2032 ($MILLION)
- TABLE 29. RUSSIA FROZEN TUNA MARKET, BY TYPE, 2022-2032 ($MILLION)
- TABLE 30. RUSSIA FROZEN TUNA MARKET, BY APPLICATION, 2022-2032 ($MILLION)
- TABLE 31. DENMARK FROZEN TUNA MARKET, BY TYPE, 2022-2032 ($MILLION)
- TABLE 32. DENMARK FROZEN TUNA MARKET, BY APPLICATION, 2022-2032 ($MILLION)
- TABLE 33. NORWAY FROZEN TUNA MARKET, BY TYPE, 2022-2032 ($MILLION)
- TABLE 34. NORWAY FROZEN TUNA MARKET, BY APPLICATION, 2022-2032 ($MILLION)
- TABLE 35. REST OF EUROPE FROZEN TUNA MARKET, BY TYPE, 2022-2032 ($MILLION)
- TABLE 36. REST OF EUROPE FROZEN TUNA MARKET, BY APPLICATION, 2022-2032 ($MILLION)
- TABLE 37. ASIA-PACIFIC FROZEN TUNA MARKET, BY TYPE, 2022-2032 ($MILLION)
- TABLE 38. ASIA-PACIFIC FROZEN TUNA MARKET, BY APPLICATION, 2022-2032 ($MILLION)
- TABLE 39. ASIA-PACIFIC FROZEN TUNA MARKET, BY COUNTRY, 2022-2032 ($MILLION)
- TABLE 40. CHINA FROZEN TUNA MARKET, BY TYPE, 2022-2032 ($MILLION)
- TABLE 41. CHINA FROZEN TUNA MARKET, BY APPLICATION, 2022-2032 ($MILLION)
- TABLE 42. JAPAN FROZEN TUNA MARKET, BY TYPE, 2022-2032 ($MILLION)
- TABLE 43. JAPAN FROZEN TUNA MARKET, BY APPLICATION, 2022-2032 ($MILLION)
- TABLE 44. INDIA FROZEN TUNA MARKET, BY TYPE, 2022-2032 ($MILLION)
- TABLE 45. INDIA FROZEN TUNA MARKET, BY APPLICATION, 2022-2032 ($MILLION)
- TABLE 46. TAIWAN FROZEN TUNA MARKET, BY TYPE, 2022-2032 ($MILLION)
- TABLE 47. TAIWAN FROZEN TUNA MARKET, BY APPLICATION, 2022-2032 ($MILLION)
- TABLE 48. INDONESIA FROZEN TUNA MARKET, BY TYPE, 2022-2032 ($MILLION)
- TABLE 49. INDONESIA FROZEN TUNA MARKET, BY APPLICATION, 2022-2032 ($MILLION)
- TABLE 50. REST OF ASIA-PACIFIC FROZEN TUNA MARKET, BY TYPE, 2022-2032 ($MILLION)
- TABLE 51. REST OF ASIA-PACIFIC FROZEN TUNA MARKET, BY APPLICATION, 2022-2032 ($MILLION)
- TABLE 52. LAMEA FROZEN TUNA MARKET, BY TYPE, 2022-2032 ($MILLION)
- TABLE 53. LAMEA FROZEN TUNA MARKET, BY APPLICATION, 2022-2032 ($MILLION)
- TABLE 54. LAMEA FROZEN TUNA MARKET, BY COUNTRY, 2022-2032 ($MILLION)
- TABLE 55. BRAZIL FROZEN TUNA MARKET, BY TYPE, 2022-2032 ($MILLION)
- TABLE 56. BRAZIL FROZEN TUNA MARKET, BY APPLICATION, 2022-2032 ($MILLION)
- TABLE 57. UAE FROZEN TUNA MARKET, BY TYPE, 2022-2032 ($MILLION)
- TABLE 58. UAE FROZEN TUNA MARKET, BY APPLICATION, 2022-2032 ($MILLION)
- TABLE 59. CHILE FROZEN TUNA MARKET, BY TYPE, 2022-2032 ($MILLION)
- TABLE 60. CHILE FROZEN TUNA MARKET, BY APPLICATION, 2022-2032 ($MILLION)
- TABLE 61. SOUTH AFRICA FROZEN TUNA MARKET, BY TYPE, 2022-2032 ($MILLION)
- TABLE 62. SOUTH AFRICA FROZEN TUNA MARKET, BY APPLICATION, 2022-2032 ($MILLION)
- TABLE 63. REST OF LAMEA FROZEN TUNA MARKET, BY TYPE, 2022-2032 ($MILLION)
- TABLE 64. REST OF LAMEA FROZEN TUNA MARKET, BY APPLICATION, 2022-2032 ($MILLION)
- TABLE 65. BRIG-STAR LLC: KEY EXECUTIVES
- TABLE 66. BRIG-STAR LLC: COMPANY SNAPSHOT
- TABLE 67. BRIG-STAR LLC: PRODUCT SEGMENTS
- TABLE 68. BRIG-STAR LLC: SERVICE SEGMENTS
- TABLE 69. BRIG-STAR LLC: PRODUCT PORTFOLIO
- TABLE 70. BRIG-STAR LLC: KEY STRATERGIES
- TABLE 71. CHICKEN OF THE SEA: KEY EXECUTIVES
- TABLE 72. CHICKEN OF THE SEA: COMPANY SNAPSHOT
- TABLE 73. CHICKEN OF THE SEA: PRODUCT SEGMENTS
- TABLE 74. CHICKEN OF THE SEA: SERVICE SEGMENTS
- TABLE 75. CHICKEN OF THE SEA: PRODUCT PORTFOLIO
- TABLE 76. CHICKEN OF THE SEA: KEY STRATERGIES
- TABLE 77. DONGWON ENTERPRISE COMPANY: KEY EXECUTIVES
- TABLE 78. DONGWON ENTERPRISE COMPANY: COMPANY SNAPSHOT
- TABLE 79. DONGWON ENTERPRISE COMPANY: PRODUCT SEGMENTS
- TABLE 80. DONGWON ENTERPRISE COMPANY: SERVICE SEGMENTS
- TABLE 81. DONGWON ENTERPRISE COMPANY: PRODUCT PORTFOLIO
- TABLE 82. DONGWON ENTERPRISE COMPANY: KEY STRATERGIES
- TABLE 83. HIGH LINER FOODS: KEY EXECUTIVES
- TABLE 84. HIGH LINER FOODS: COMPANY SNAPSHOT
- TABLE 85. HIGH LINER FOODS: PRODUCT SEGMENTS
- TABLE 86. HIGH LINER FOODS: SERVICE SEGMENTS
- TABLE 87. HIGH LINER FOODS: PRODUCT PORTFOLIO
- TABLE 88. HIGH LINER FOODS: KEY STRATERGIES
- TABLE 89. MARINE HARVEST: KEY EXECUTIVES
- TABLE 90. MARINE HARVEST: COMPANY SNAPSHOT
- TABLE 91. MARINE HARVEST: PRODUCT SEGMENTS
- TABLE 92. MARINE HARVEST: SERVICE SEGMENTS
- TABLE 93. MARINE HARVEST: PRODUCT PORTFOLIO
- TABLE 94. MARINE HARVEST: KEY STRATERGIES
- TABLE 95. NIPPON SUISAN KAISHA AKA NISSUI: KEY EXECUTIVES
- TABLE 96. NIPPON SUISAN KAISHA AKA NISSUI: COMPANY SNAPSHOT
- TABLE 97. NIPPON SUISAN KAISHA AKA NISSUI: PRODUCT SEGMENTS
- TABLE 98. NIPPON SUISAN KAISHA AKA NISSUI: SERVICE SEGMENTS
- TABLE 99. NIPPON SUISAN KAISHA AKA NISSUI: PRODUCT PORTFOLIO
- TABLE 100. NIPPON SUISAN KAISHA AKA NISSUI: KEY STRATERGIES
- TABLE 101. PESCANOVA SA: KEY EXECUTIVES
- TABLE 102. PESCANOVA SA: COMPANY SNAPSHOT
- TABLE 103. PESCANOVA SA: PRODUCT SEGMENTS
- TABLE 104. PESCANOVA SA: SERVICE SEGMENTS
- TABLE 105. PESCANOVA SA: PRODUCT PORTFOLIO
- TABLE 106. PESCANOVA SA: KEY STRATERGIES
- TABLE 107. SALMAR ASA: KEY EXECUTIVES
- TABLE 108. SALMAR ASA: COMPANY SNAPSHOT
- TABLE 109. SALMAR ASA: PRODUCT SEGMENTS
- TABLE 110. SALMAR ASA: SERVICE SEGMENTS
- TABLE 111. SALMAR ASA: PRODUCT PORTFOLIO
- TABLE 112. SALMAR ASA: KEY STRATERGIES
- TABLE 113. ZONECO GROUP: KEY EXECUTIVES
- TABLE 114. ZONECO GROUP: COMPANY SNAPSHOT
- TABLE 115. ZONECO GROUP: PRODUCT SEGMENTS
- TABLE 116. ZONECO GROUP: SERVICE SEGMENTS
- TABLE 117. ZONECO GROUP: PRODUCT PORTFOLIO
- TABLE 118. ZONECO GROUP: KEY STRATERGIES
- TABLE 119. TASSAL GROUP: KEY EXECUTIVES
- TABLE 120. TASSAL GROUP: COMPANY SNAPSHOT
- TABLE 121. TASSAL GROUP: PRODUCT SEGMENTS
- TABLE 122. TASSAL GROUP: SERVICE SEGMENTS
- TABLE 123. TASSAL GROUP: PRODUCT PORTFOLIO
- TABLE 124. TASSAL GROUP: KEY STRATERGIES
LIST OF FIGURES
- FIGURE 01. FROZEN TUNA MARKET, 2022-2032
- FIGURE 02. SEGMENTATION OF FROZEN TUNA MARKET,2022-2032
- FIGURE 03. TOP IMPACTING FACTORS IN FROZEN TUNA MARKET
- FIGURE 04. TOP INVESTMENT POCKETS IN FROZEN TUNA MARKET (2023-2032)
- FIGURE 05. BARGAINING POWER OF SUPPLIERS
- FIGURE 06. BARGAINING POWER OF BUYERS
- FIGURE 07. THREAT OF SUBSTITUTION
- FIGURE 08. THREAT OF SUBSTITUTION
- FIGURE 09. COMPETITIVE RIVALRY
- FIGURE 10. GLOBAL FROZEN TUNA MARKET:DRIVERS, RESTRAINTS AND OPPORTUNITIES
- FIGURE 11. IMPACT OF KEY REGULATION: FROZEN TUNA MARKET
- FIGURE 12. PATENT ANALYSIS BY COMPANY
- FIGURE 13. PATENT ANALYSIS BY COUNTRY
- FIGURE 14. FROZEN TUNA MARKET, BY TYPE, 2022 AND 2032(%)
- FIGURE 15. COMPARATIVE SHARE ANALYSIS OF FROZEN TUNA MARKET FOR FROZEN ALBACORE, BY COUNTRY 2022 AND 2032(%)
- FIGURE 16. COMPARATIVE SHARE ANALYSIS OF FROZEN TUNA MARKET FOR FROZEN BIG EYE AHI, BY COUNTRY 2022 AND 2032(%)
- FIGURE 17. COMPARATIVE SHARE ANALYSIS OF FROZEN TUNA MARKET FOR FROZEN BLUEFIN TUNA, BY COUNTRY 2022 AND 2032(%)
- FIGURE 18. COMPARATIVE SHARE ANALYSIS OF FROZEN TUNA MARKET FOR FROZEN SKIPJACK, BY COUNTRY 2022 AND 2032(%)
- FIGURE 19. COMPARATIVE SHARE ANALYSIS OF FROZEN TUNA MARKET FOR FROZEN YELLOWFIN TUNA, BY COUNTRY 2022 AND 2032(%)
- FIGURE 20. FROZEN TUNA MARKET, BY APPLICATION, 2022 AND 2032(%)
- FIGURE 21. COMPARATIVE SHARE ANALYSIS OF FROZEN TUNA MARKET FOR SUPERMARKETS/ HYPERMARKETS, BY COUNTRY 2022 AND 2032(%)
- FIGURE 22. COMPARATIVE SHARE ANALYSIS OF FROZEN TUNA MARKET FOR CONVENIENCE STORES, BY COUNTRY 2022 AND 2032(%)
- FIGURE 23. COMPARATIVE SHARE ANALYSIS OF FROZEN TUNA MARKET FOR SPECIALTY STORES, BY COUNTRY 2022 AND 2032(%)
- FIGURE 24. COMPARATIVE SHARE ANALYSIS OF FROZEN TUNA MARKET FOR ONLINE RETAIL, BY COUNTRY 2022 AND 2032(%)
- FIGURE 25. FROZEN TUNA MARKET BY REGION, 2022 AND 2032(%)
- FIGURE 26. U.S. FROZEN TUNA MARKET, 2022-2032 ($MILLION)
- FIGURE 27. CANADA FROZEN TUNA MARKET, 2022-2032 ($MILLION)
- FIGURE 28. MEXICO FROZEN TUNA MARKET, 2022-2032 ($MILLION)
- FIGURE 29. GERMANY FROZEN TUNA MARKET, 2022-2032 ($MILLION)
- FIGURE 30. UK FROZEN TUNA MARKET, 2022-2032 ($MILLION)
- FIGURE 31. RUSSIA FROZEN TUNA MARKET, 2022-2032 ($MILLION)
- FIGURE 32. DENMARK FROZEN TUNA MARKET, 2022-2032 ($MILLION)
- FIGURE 33. NORWAY FROZEN TUNA MARKET, 2022-2032 ($MILLION)
- FIGURE 34. REST OF EUROPE FROZEN TUNA MARKET, 2022-2032 ($MILLION)
- FIGURE 35. CHINA FROZEN TUNA MARKET, 2022-2032 ($MILLION)
- FIGURE 36. JAPAN FROZEN TUNA MARKET, 2022-2032 ($MILLION)
- FIGURE 37. INDIA FROZEN TUNA MARKET, 2022-2032 ($MILLION)
- FIGURE 38. TAIWAN FROZEN TUNA MARKET, 2022-2032 ($MILLION)
- FIGURE 39. INDONESIA FROZEN TUNA MARKET, 2022-2032 ($MILLION)
- FIGURE 40. REST OF ASIA-PACIFIC FROZEN TUNA MARKET, 2022-2032 ($MILLION)
- FIGURE 41. BRAZIL FROZEN TUNA MARKET, 2022-2032 ($MILLION)
- FIGURE 42. UAE FROZEN TUNA MARKET, 2022-2032 ($MILLION)
- FIGURE 43. CHILE FROZEN TUNA MARKET, 2022-2032 ($MILLION)
- FIGURE 44. SOUTH AFRICA FROZEN TUNA MARKET, 2022-2032 ($MILLION)
- FIGURE 45. REST OF LAMEA FROZEN TUNA MARKET, 2022-2032 ($MILLION)
- FIGURE 46. TOP WINNING STRATEGIES, BY YEAR
- FIGURE 47. TOP WINNING STRATEGIES, BY DEVELOPMENT
- FIGURE 48. TOP WINNING STRATEGIES, BY COMPANY
- FIGURE 49. PRODUCT MAPPING OF TOP 10 PLAYERS
- FIGURE 50. COMPETITIVE DASHBOARD
- FIGURE 51. COMPETITIVE HEATMAP: FROZEN TUNA MARKET
- FIGURE 52. TOP PLAYER POSITIONING, 2022


