


 |
市場調查報告書
商品編碼
1472353
全球表面消毒市場:按成分、類型和應用:機會分析和產業預測(2023-2032)Surface Disinfection Market By Composition, By Type, By Application : Global Opportunity Analysis and Industry Forecast, 2023-2032 |
||||||
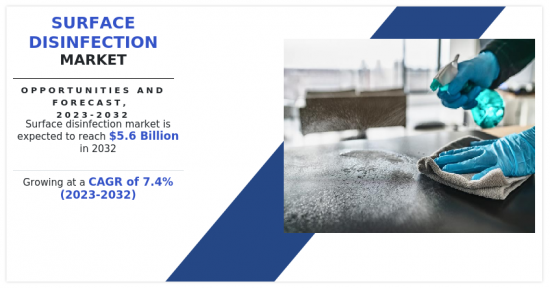
預計2022年全球表面消毒市場規模將達27億美元,2023年至2032年複合年成長率為7.4%,2032年將達56億美元。
表面消毒劑是一種旨在消除或減少表面病原體存在的化學溶液。含有酒精、季銨化合物等活性抗菌劑,能有效殺死或抑制細菌、病毒、真菌的生長。這將防止感染傳播並確保環境衛生。
表面消毒劑市場的成長是由醫療保健支出的增加所推動的,反映了確保醫療機構內安全和無菌環境的動力。根據世界衛生組織(WHO)全球衛生支出資料庫,自2014年以來,全球衛生支出一直在成長,全球GDP中用於公共衛生的比例不斷增加。 2020年,全球衛生支出將達到9兆美元,佔全球國內生產總值(GDP)的10.8%。在全國範圍內,2020 年所有收入群體的醫療支出無論是人均還是佔 GDP 的比重均有所增加。醫院和醫療機構將很大一部分預算用於維持嚴格的衛生標準,以防止病患和醫護人員之間的感染。
醫療保健支出的增加將導致對各種形式的表面消毒劑的需求增加,包括濕紙巾、噴霧劑和液體。這些消毒劑在最大限度地降低院內感染 (HAI) 風險方面發揮關鍵作用,這是一個增加醫療成本並對患者治療結果產生負面影響的重大問題。感染預防和控制的重要性是由許多因素驅動的,包括財務考慮、監管要求以及為患者提供優質醫療保健的承諾。
慢性病的快速增加和人口老化導致醫療保健支出增加。根據世界衛生組織報告,2010年,心血管疾病、癌症、糖尿病和呼吸系統疾病等慢性病佔全球死亡人數的75%,2020年將佔79%。到2030年,專家預測這一比例將成長至84%。隨著醫療機構中患者數量的增加,需要嚴格的消毒方案。表面消毒劑對於擴大感染控制方法至關重要,因為它們能夠抑制微生物的傳播。因此,預計醫療保健支出的增加將在預測期內推動表面消毒劑市場的成長。
阻礙市場成長的是表面消毒劑製造過程中危險化學品的處理。使用具有潛在危險的化學品會引起人們對工人安全、環境影響和監管合規性的擔憂。製造商必須遵守嚴格的安全通訊協定,以保護參與製造過程的工人免受潛在的有害物質接觸。這需要在安全措施、培訓計劃和專用設備方面進行額外投資,從而導致生產成本增加。
此外,在表面消毒劑的製造過程中處理危險化學品對環境的影響也是一個主要問題。不當的處置方法和意外洩漏可能導致土壤和水污染,對生態系統和人類健康構成風險。隨著消費者和監管機構要求各行業採取永續和環保的做法,這些環境方面變得越來越重要。
監管合規在抑制市場成長方面發揮著至關重要的作用。危險化學品的生產、運輸、處置有嚴格的規定。製造商必須應對各種法規環境,以確保其程序符合環境和安全要求。違規可能會導致法律後果、罰款和公司聲譽受損。因此,表面消毒劑製造過程中危險化學品的處理阻礙了市場的成長。
環保表面消毒劑產品的開發正在為表面消毒劑市場創造巨大的成長機會。消費者、企業和監管機構正在優先考慮對環境影響最小的產品,從而增加了對有效和永續的表面消毒劑的需求。環保消毒劑採用生物分解性的成分配製而成,對環境的影響較小,並解決了與使用含有刺激性化學物質的傳統消毒劑相關的問題。
人們對環境議題的認知不斷提高,導致消費行為發生變化,許多人選擇更環保、有助於建立更健康地球的產品。消費者偏好的這些變化為製造商創造了一個市場利基,以創新方式生產符合嚴格環境標準而不影響有效性的表面消毒劑。本公司投資研發,開發利用無毒植物來源的配方,以確保其產品不僅對環境安全,也對人類健康安全。因此,永續表面消毒劑產品的開發代表了預測期內市場擴張的利潤豐厚的成長機會。
表面消毒劑市場按成分、類型、應用和地區細分。依成分分類,市場分為醇類、氯化合物、季銨化合物、過氧化氫、過氧乙酸等。按類型分類,市場分為液體、擦拭巾和噴霧。依用途分為表面用途、儀器用途等。從區域來看,我們對北美、歐洲、亞太地區和拉丁美洲/中東/非洲市場進行了研究。
相關人員的主要利益
- 本報告定量分析了 2022-2032 年表面消毒市場分析的細分市場、當前趨勢、估計/趨勢和動態,並確定了表面消毒市場的強大機會。
- 我們提供市場研究以及與市場促進因素、市場限制和市場機會相關的資訊。
- 波特的五力分析揭示了買家和供應商的潛力,幫助相關人員做出利潤驅動的業務決策並加強供應商和買家網路。
- 對錶面消毒市場細分的詳細分析將有助於確定市場機會。
- 每個地區的主要國家都根據其對全球市場的收益貢獻繪製了地圖。
- 市場公司定位有助於基準化分析並提供對市場公司當前地位的清晰了解。
- 該報告包括對區域和全球表面消毒市場趨勢、主要企業、細分市場、應用領域和市場成長策略的分析。
使用此報告可以進行報告客製化(請聯絡銷售人員以了解額外費用和時間表)
- 製造能力
- 產品基準/產品規格及應用
- 產品生命週期
- 按地區分類的新參與企業
- 按產品/細分市場分類的公司市場細分
- 新品開發/各大廠商產品矩陣
- 監管指引
- 根據客戶興趣新增其他公司簡介
- 按國家或地區進行的附加分析:市場規模和預測
- 公司簡介的擴充列表
- 主要企業詳細資料(Excel 格式,包括位置、聯絡資訊、供應商/供應商網路等)
- SWOT分析
目錄
第1章簡介
第 2 章執行摘要
第3章市場概況
- 市場定義和範圍
- 主要發現
- 影響因素
- 主要投資機會
- 波特五力分析
- 市場動態
- 促進因素
- 抑制因素
- 機會
- 市場佔有率分析
- 價值鏈分析
- 價格分析
- 關鍵監管分析
- 專利情況
- 監管指引
- 主要企業詳情
第4章表面消毒市場:依成分分類
- 概述
- 酒精
- 氯化合物
- 季銨化合物
- 過氧化氫
- 過氧乙酸
- 其他
第5章表面消毒市場:依類型
- 概述
- 液體
- 擦拭巾
- 噴
第6章表面消毒市場:依應用分類
- 概述
- 表面
- 用具
- 其他
第7章表面消毒市場:依地區
- 概述
- 北美洲
- 美國
- 加拿大
- 墨西哥
- 歐洲
- 德國
- 英國
- 法國
- 西班牙
- 義大利
- 其他
- 亞太地區
- 中國
- 印度
- 日本
- 韓國
- 澳洲
- 其他
- 拉丁美洲/中東/非洲
- 巴西
- 沙烏地阿拉伯
- 南非
- 其他
第8章 競爭格局
- 介紹
- 關鍵成功策略
- 10家主要企業產品圖譜
- 競爭對手儀表板
- 競爭熱圖
- 主要企業定位(2022年)
第9章 公司簡介
- BASF SE
- 3M
- Ecolab
- LANXESS
- Lonza
- paxchem ltd.
- Reckitt Benckiser Group plc.
- Spartan Chemical Company, Inc.
- P&G
- Paul Hartmann AG
The global surface disinfection market was valued at $2.7 billion in 2022, and is projected to reach $5.6 billion by 2032, growing at a CAGR of 7.4% from 2023 to 2032.
A surface disinfectant is a chemical solution designed to eliminate or reduce the presence of pathogens on surfaces. It contains active antimicrobial agents, such as alcohol or quaternary ammonium compounds, to effectively kill or inhibit the growth of bacteria, viruses, and fungi. This helps prevent the spread of infections and ensures a hygienic environment.
The growth of the surface disinfectant market is driven by the increased expenditure on healthcare, reflecting a commitment to ensuring safe and sterile environments within medical facilities. According to the Global Health Expenditure Database by the World Health Organization (WHO), the global health expenditure has been on a rise since 2014, with an increasing share of the world's GDP being distributed in public health care. In 2020, global spending on health reached $9 trillion, or 10.8% of global gross domestic product (GDP). Across countries, health spending in 2020 increased in per capita terms and as a share of GDP across all income groups. Hospitals and healthcare institutions allocate a sizable portion of their budgets to maintain stringent hygiene standards, aiming to prevent the transmission of infections among patients and healthcare professionals.
The elevated spending on healthcare translates into a higher demand for surface disinfectants in various forms, including wipes, sprays, and liquid solutions. These disinfectants play a crucial role in minimizing the risk of hospital-acquired infections (HAIs), a critical concern that adds to healthcare costs and negatively impacts patient outcomes. The significance of infection prevention and control is attributed to a number of factors, including financial considerations, regulatory requirements, and a commitment to offering patients high-quality care.
The surge in prevalence of chronic diseases and the rise in aging population contribute to the increase in healthcare expenditure. According to a report by the WHO, chronic diseases such as cardiovascular diseases, cancer, diabetes, and respiratory disease were causes or contributing factors in 75% of global deaths in 2010 and 79% in 2020. By 2030, experts predict that this percentage could grow to as much as 84%. Stringent disinfection procedures are required when the number of patients in healthcare facilities increases. Surface disinfectants are essential to broaden infection control methods owing to their ability to stop the spread of microbes. Thus, an increase in healthcare expenditures is expected to drive the growth of the surface disinfectant market during the forecast period.
The market growth is hindered by the handling of hazardous chemicals during the production of surface disinfectants. The use of potentially harmful chemicals raises concerns regarding worker safety, environmental impact, and regulatory compliance. Manufacturers need to adhere to stringent safety protocols to protect workers involved in the production process from potential exposure to hazardous substances. This requires additional investments in safety measures, training programs, and specialized equipment, contributing to increased production costs.
Moreover, the environmental impact of handling hazardous chemicals during the production of surface disinfectants is a significant concern. Inappropriate disposal practices or accidental releases lead to soil and water contamination, posing risks to ecosystems and human health. This environmental aspect has become increasingly important as consumers and regulatory bodies demand sustainable and eco-friendly practices across industries.
Regulatory compliance plays a pivotal role in restraining market growth. Strict regulations govern the production, transportation, and disposal of hazardous chemicals. Manufacturers must navigate through various regulatory environments to make sure their procedures comply with environmental and safety requirements. Non-compliance results in legal consequences, fines, and damage to a company's reputation. Thus, handling of hazardous chemicals during production of surface disinfectants hinders market growth.
The development of eco-friendly surface disinfectant products offers significant growth opportunity for the surface disinfectant market. Consumers, businesses, and regulatory bodies are prioritizing products that have minimal impact on the environment, fostering a demand for surface disinfectants that are both effective and sustainable. Eco-friendly disinfectants are formulated with biodegradable ingredients, which reduce their ecological footprint and address concerns associated with the use of traditional disinfectants containing harsh chemicals.
The increased awareness of environmental issues has led to a change in consumer behavior, with many individuals opting for products that contribute to a greener and healthier planet. This shift in consumer preferences has created a market niche for manufacturers to innovate and produce surface disinfectants that meet stringent environmental standards without compromising on efficacy. Companies invest in R&D to create formulations that utilize plant-based, non-toxic ingredients, ensuring that their products are not only safe for the environment but also for human health. Thus, development of sustainable surface disinfectant products presents a lucrative growth opportunity for the expansion of the market during the forecast period.
The surface disinfectant market is segmented on the basis of composition, type, application, and region. On the basis of composition, the market is segregated into alcohols, chlorine compounds, quaternary ammonium compounds, hydrogen peroxide, peracetic acid, and others. On the basis of type, the market is classified into liquids, wipes, and sprays. On the basis of the application, the market is divided into surface, instrument, and others. Region-wise, the market is studied across North America, Europe, Asia-Pacific, and LAMEA.
The major players operating in the global surface disinfectant market are 3M, BASF SE, Ecolab, LANXESS, Lonza, P&G, PAUL HARTMANN AG, PaxChem Ltd., Reckitt Benckiser Group plc., and Spartan Chemical Company, Inc. Other players include Amity International, Carenowmedical, CleanWell, LLC., Codi Group, Medline Industries, LP, Nuvik UK Ltd, Parker Laboratories, Inc., STERIS plc, The Clorox Company, and Whiteley.
Key Benefits For Stakeholders
- This report provides a quantitative analysis of the market segments, current trends, estimations, and dynamics of the surface disinfection market analysis from 2022 to 2032 to identify the prevailing surface disinfection market opportunities.
- The market research is offered along with information related to key drivers, restraints, and opportunities.
- Porter's five forces analysis highlights the potency of buyers and suppliers to enable stakeholders make profit-oriented business decisions and strengthen their supplier-buyer network.
- In-depth analysis of the surface disinfection market segmentation assists to determine the prevailing market opportunities.
- Major countries in each region are mapped according to their revenue contribution to the global market.
- Market player positioning facilitates benchmarking and provides a clear understanding of the present position of the market players.
- The report includes the analysis of the regional as well as global surface disinfection market trends, key players, market segments, application areas, and market growth strategies.
Additional benefits you will get with this purchase are:
- Quarterly Update and* (only available with a corporate license, on listed price)
- 5 additional Company Profile of client Choice pre- or Post-purchase, as a free update.
- Free Upcoming Version on the Purchase of Five and Enterprise User License.
- 16 analyst hours of support* (post-purchase, if you find additional data requirements upon review of the report, you may receive support amounting to 16 analyst hours to solve questions, and post-sale queries)
- 15% Free Customization* (in case the scope or segment of the report does not match your requirements, 15% is equivalent to 3 working days of free work, applicable once)
- Free data Pack on the Five and Enterprise User License. (Excel version of the report)
- Free Updated report if the report is 6-12 months old or older.
- 24-hour priority response*
- Free Industry updates and white papers.
Possible Customization with this report (with additional cost and timeline, please talk to the sales executive to know more)
- Manufacturing Capacity
- Product Benchmarking / Product specification and applications
- Product Life Cycles
- Upcoming/New Entrant by Regions
- Market share analysis of players by products/segments
- New Product Development/ Product Matrix of Key Players
- Regulatory Guidelines
- Additional company profiles with specific to client's interest
- Additional country or region analysis- market size and forecast
- Expanded list for Company Profiles
- Key player details (including location, contact details, supplier/vendor network etc. in excel format)
- SWOT Analysis
Key Market Segments
By Composition
- Alcohols
- Chlorine Compounds
- Quaternary Ammonium Compounds
- Hydrogen Peroxide
- Peracetic Acid
- Others
By Type
- Liquids
- Wipes
- Sprays
By Application
- Surface
- Instrument
- Others
By Region
- North America
- U.S.
- Canada
- Mexico
- Europe
- Germany
- UK
- France
- Spain
- Italy
- Rest of Europe
- Asia-Pacific
- China
- India
- Japan
- South Korea
- Australia
- Rest of Asia-Pacific
- LAMEA
- Brazil
- Saudi Arabia
- South Africa
- Rest of LAMEA
Key Market Players:
- BASF SE
- 3M
- Ecolab
- LANXESS
- Lonza
- paxchem ltd.
- Reckitt Benckiser Group plc.
- Spartan Chemical Company, Inc.
- P&G
- Paul Hartmann AG
TABLE OF CONTENTS
CHAPTER 1: INTRODUCTION
- 1.1. Report description
- 1.2. Key market segments
- 1.3. Key benefits to the stakeholders
- 1.4. Research methodology
- 1.4.1. Primary research
- 1.4.2. Secondary research
- 1.4.3. Analyst tools and models
CHAPTER 2: EXECUTIVE SUMMARY
- 2.1. CXO perspective
CHAPTER 3: MARKET OVERVIEW
- 3.1. Market definition and scope
- 3.2. Key findings
- 3.2.1. Top impacting factors
- 3.2.2. Top investment pockets
- 3.3. Porter's five forces analysis
- 3.4. Market dynamics
- 3.4.1. Drivers
- 3.4.2. Restraints
- 3.4.3. Opportunities
- 3.5. Market Share Analysis
- 3.6. Value Chain Analysis
- 3.7. Pricing Analysis
- 3.8. Key Regulation Analysis
- 3.9. Patent Landscape
- 3.10. Regulatory Guidelines
- 3.11. Key Players Details
CHAPTER 4: SURFACE DISINFECTION MARKET, BY COMPOSITION
- 4.1. Overview
- 4.1.1. Market size and forecast
- 4.2. Alcohols
- 4.2.1. Key market trends, growth factors and opportunities
- 4.2.2. Market size and forecast, by region
- 4.2.3. Market share analysis by country
- 4.3. Chlorine Compounds
- 4.3.1. Key market trends, growth factors and opportunities
- 4.3.2. Market size and forecast, by region
- 4.3.3. Market share analysis by country
- 4.4. Quaternary Ammonium Compounds
- 4.4.1. Key market trends, growth factors and opportunities
- 4.4.2. Market size and forecast, by region
- 4.4.3. Market share analysis by country
- 4.5. Hydrogen Peroxide
- 4.5.1. Key market trends, growth factors and opportunities
- 4.5.2. Market size and forecast, by region
- 4.5.3. Market share analysis by country
- 4.6. Peracetic Acid
- 4.6.1. Key market trends, growth factors and opportunities
- 4.6.2. Market size and forecast, by region
- 4.6.3. Market share analysis by country
- 4.7. Others
- 4.7.1. Key market trends, growth factors and opportunities
- 4.7.2. Market size and forecast, by region
- 4.7.3. Market share analysis by country
CHAPTER 5: SURFACE DISINFECTION MARKET, BY TYPE
- 5.1. Overview
- 5.1.1. Market size and forecast
- 5.2. Liquids
- 5.2.1. Key market trends, growth factors and opportunities
- 5.2.2. Market size and forecast, by region
- 5.2.3. Market share analysis by country
- 5.3. Wipes
- 5.3.1. Key market trends, growth factors and opportunities
- 5.3.2. Market size and forecast, by region
- 5.3.3. Market share analysis by country
- 5.4. Sprays
- 5.4.1. Key market trends, growth factors and opportunities
- 5.4.2. Market size and forecast, by region
- 5.4.3. Market share analysis by country
CHAPTER 6: SURFACE DISINFECTION MARKET, BY APPLICATION
- 6.1. Overview
- 6.1.1. Market size and forecast
- 6.2. Surface
- 6.2.1. Key market trends, growth factors and opportunities
- 6.2.2. Market size and forecast, by region
- 6.2.3. Market share analysis by country
- 6.3. Instrument
- 6.3.1. Key market trends, growth factors and opportunities
- 6.3.2. Market size and forecast, by region
- 6.3.3. Market share analysis by country
- 6.4. Others
- 6.4.1. Key market trends, growth factors and opportunities
- 6.4.2. Market size and forecast, by region
- 6.4.3. Market share analysis by country
CHAPTER 7: SURFACE DISINFECTION MARKET, BY REGION
- 7.1. Overview
- 7.1.1. Market size and forecast By Region
- 7.2. North America
- 7.2.1. Key market trends, growth factors and opportunities
- 7.2.2. Market size and forecast, by Composition
- 7.2.3. Market size and forecast, by Type
- 7.2.4. Market size and forecast, by Application
- 7.2.5. Market size and forecast, by country
- 7.2.5.1. U.S.
- 7.2.5.1.1. Market size and forecast, by Composition
- 7.2.5.1.2. Market size and forecast, by Type
- 7.2.5.1.3. Market size and forecast, by Application
- 7.2.5.2. Canada
- 7.2.5.2.1. Market size and forecast, by Composition
- 7.2.5.2.2. Market size and forecast, by Type
- 7.2.5.2.3. Market size and forecast, by Application
- 7.2.5.3. Mexico
- 7.2.5.3.1. Market size and forecast, by Composition
- 7.2.5.3.2. Market size and forecast, by Type
- 7.2.5.3.3. Market size and forecast, by Application
- 7.3. Europe
- 7.3.1. Key market trends, growth factors and opportunities
- 7.3.2. Market size and forecast, by Composition
- 7.3.3. Market size and forecast, by Type
- 7.3.4. Market size and forecast, by Application
- 7.3.5. Market size and forecast, by country
- 7.3.5.1. Germany
- 7.3.5.1.1. Market size and forecast, by Composition
- 7.3.5.1.2. Market size and forecast, by Type
- 7.3.5.1.3. Market size and forecast, by Application
- 7.3.5.2. UK
- 7.3.5.2.1. Market size and forecast, by Composition
- 7.3.5.2.2. Market size and forecast, by Type
- 7.3.5.2.3. Market size and forecast, by Application
- 7.3.5.3. France
- 7.3.5.3.1. Market size and forecast, by Composition
- 7.3.5.3.2. Market size and forecast, by Type
- 7.3.5.3.3. Market size and forecast, by Application
- 7.3.5.4. Spain
- 7.3.5.4.1. Market size and forecast, by Composition
- 7.3.5.4.2. Market size and forecast, by Type
- 7.3.5.4.3. Market size and forecast, by Application
- 7.3.5.5. Italy
- 7.3.5.5.1. Market size and forecast, by Composition
- 7.3.5.5.2. Market size and forecast, by Type
- 7.3.5.5.3. Market size and forecast, by Application
- 7.3.5.6. Rest of Europe
- 7.3.5.6.1. Market size and forecast, by Composition
- 7.3.5.6.2. Market size and forecast, by Type
- 7.3.5.6.3. Market size and forecast, by Application
- 7.4. Asia-Pacific
- 7.4.1. Key market trends, growth factors and opportunities
- 7.4.2. Market size and forecast, by Composition
- 7.4.3. Market size and forecast, by Type
- 7.4.4. Market size and forecast, by Application
- 7.4.5. Market size and forecast, by country
- 7.4.5.1. China
- 7.4.5.1.1. Market size and forecast, by Composition
- 7.4.5.1.2. Market size and forecast, by Type
- 7.4.5.1.3. Market size and forecast, by Application
- 7.4.5.2. India
- 7.4.5.2.1. Market size and forecast, by Composition
- 7.4.5.2.2. Market size and forecast, by Type
- 7.4.5.2.3. Market size and forecast, by Application
- 7.4.5.3. Japan
- 7.4.5.3.1. Market size and forecast, by Composition
- 7.4.5.3.2. Market size and forecast, by Type
- 7.4.5.3.3. Market size and forecast, by Application
- 7.4.5.4. South Korea
- 7.4.5.4.1. Market size and forecast, by Composition
- 7.4.5.4.2. Market size and forecast, by Type
- 7.4.5.4.3. Market size and forecast, by Application
- 7.4.5.5. Australia
- 7.4.5.5.1. Market size and forecast, by Composition
- 7.4.5.5.2. Market size and forecast, by Type
- 7.4.5.5.3. Market size and forecast, by Application
- 7.4.5.6. Rest of Asia-Pacific
- 7.4.5.6.1. Market size and forecast, by Composition
- 7.4.5.6.2. Market size and forecast, by Type
- 7.4.5.6.3. Market size and forecast, by Application
- 7.5. LAMEA
- 7.5.1. Key market trends, growth factors and opportunities
- 7.5.2. Market size and forecast, by Composition
- 7.5.3. Market size and forecast, by Type
- 7.5.4. Market size and forecast, by Application
- 7.5.5. Market size and forecast, by country
- 7.5.5.1. Brazil
- 7.5.5.1.1. Market size and forecast, by Composition
- 7.5.5.1.2. Market size and forecast, by Type
- 7.5.5.1.3. Market size and forecast, by Application
- 7.5.5.2. Saudi Arabia
- 7.5.5.2.1. Market size and forecast, by Composition
- 7.5.5.2.2. Market size and forecast, by Type
- 7.5.5.2.3. Market size and forecast, by Application
- 7.5.5.3. South Africa
- 7.5.5.3.1. Market size and forecast, by Composition
- 7.5.5.3.2. Market size and forecast, by Type
- 7.5.5.3.3. Market size and forecast, by Application
- 7.5.5.4. Rest of LAMEA
- 7.5.5.4.1. Market size and forecast, by Composition
- 7.5.5.4.2. Market size and forecast, by Type
- 7.5.5.4.3. Market size and forecast, by Application
CHAPTER 8: COMPETITIVE LANDSCAPE
- 8.1. Introduction
- 8.2. Top winning strategies
- 8.3. Product mapping of top 10 player
- 8.4. Competitive dashboard
- 8.5. Competitive heatmap
- 8.6. Top player positioning, 2022
CHAPTER 9: COMPANY PROFILES
- 9.1. BASF SE
- 9.1.1. Company overview
- 9.1.2. Key executives
- 9.1.3. Company snapshot
- 9.1.4. Operating business segments
- 9.1.5. Product portfolio
- 9.1.6. Business performance
- 9.1.7. Key strategic moves and developments
- 9.2. 3M
- 9.2.1. Company overview
- 9.2.2. Key executives
- 9.2.3. Company snapshot
- 9.2.4. Operating business segments
- 9.2.5. Product portfolio
- 9.2.6. Business performance
- 9.2.7. Key strategic moves and developments
- 9.3. Ecolab
- 9.3.1. Company overview
- 9.3.2. Key executives
- 9.3.3. Company snapshot
- 9.3.4. Operating business segments
- 9.3.5. Product portfolio
- 9.3.6. Business performance
- 9.3.7. Key strategic moves and developments
- 9.4. LANXESS
- 9.4.1. Company overview
- 9.4.2. Key executives
- 9.4.3. Company snapshot
- 9.4.4. Operating business segments
- 9.4.5. Product portfolio
- 9.4.6. Business performance
- 9.4.7. Key strategic moves and developments
- 9.5. Lonza
- 9.5.1. Company overview
- 9.5.2. Key executives
- 9.5.3. Company snapshot
- 9.5.4. Operating business segments
- 9.5.5. Product portfolio
- 9.5.6. Business performance
- 9.5.7. Key strategic moves and developments
- 9.6. paxchem ltd.
- 9.6.1. Company overview
- 9.6.2. Key executives
- 9.6.3. Company snapshot
- 9.6.4. Operating business segments
- 9.6.5. Product portfolio
- 9.6.6. Business performance
- 9.6.7. Key strategic moves and developments
- 9.7. Reckitt Benckiser Group plc.
- 9.7.1. Company overview
- 9.7.2. Key executives
- 9.7.3. Company snapshot
- 9.7.4. Operating business segments
- 9.7.5. Product portfolio
- 9.7.6. Business performance
- 9.7.7. Key strategic moves and developments
- 9.8. Spartan Chemical Company, Inc.
- 9.8.1. Company overview
- 9.8.2. Key executives
- 9.8.3. Company snapshot
- 9.8.4. Operating business segments
- 9.8.5. Product portfolio
- 9.8.6. Business performance
- 9.8.7. Key strategic moves and developments
- 9.9. P&G
- 9.9.1. Company overview
- 9.9.2. Key executives
- 9.9.3. Company snapshot
- 9.9.4. Operating business segments
- 9.9.5. Product portfolio
- 9.9.6. Business performance
- 9.9.7. Key strategic moves and developments
- 9.10. Paul Hartmann AG
- 9.10.1. Company overview
- 9.10.2. Key executives
- 9.10.3. Company snapshot
- 9.10.4. Operating business segments
- 9.10.5. Product portfolio
- 9.10.6. Business performance
- 9.10.7. Key strategic moves and developments
LIST OF TABLES
- TABLE 01. GLOBAL SURFACE DISINFECTION MARKET, BY COMPOSITION, 2022-2032 ($MILLION)
- TABLE 02. GLOBAL SURFACE DISINFECTION MARKET, BY COMPOSITION, 2022-2032 (KILOTON)
- TABLE 03. SURFACE DISINFECTION MARKET FOR ALCOHOLS, BY REGION, 2022-2032 ($MILLION)
- TABLE 04. SURFACE DISINFECTION MARKET FOR ALCOHOLS, BY REGION, 2022-2032 (KILOTON)
- TABLE 05. SURFACE DISINFECTION MARKET FOR CHLORINE COMPOUNDS, BY REGION, 2022-2032 ($MILLION)
- TABLE 06. SURFACE DISINFECTION MARKET FOR CHLORINE COMPOUNDS, BY REGION, 2022-2032 (KILOTON)
- TABLE 07. SURFACE DISINFECTION MARKET FOR QUATERNARY AMMONIUM COMPOUNDS, BY REGION, 2022-2032 ($MILLION)
- TABLE 08. SURFACE DISINFECTION MARKET FOR QUATERNARY AMMONIUM COMPOUNDS, BY REGION, 2022-2032 (KILOTON)
- TABLE 09. SURFACE DISINFECTION MARKET FOR HYDROGEN PEROXIDE, BY REGION, 2022-2032 ($MILLION)
- TABLE 10. SURFACE DISINFECTION MARKET FOR HYDROGEN PEROXIDE, BY REGION, 2022-2032 (KILOTON)
- TABLE 11. SURFACE DISINFECTION MARKET FOR PERACETIC ACID, BY REGION, 2022-2032 ($MILLION)
- TABLE 12. SURFACE DISINFECTION MARKET FOR PERACETIC ACID, BY REGION, 2022-2032 (KILOTON)
- TABLE 13. SURFACE DISINFECTION MARKET FOR OTHERS, BY REGION, 2022-2032 ($MILLION)
- TABLE 14. SURFACE DISINFECTION MARKET FOR OTHERS, BY REGION, 2022-2032 (KILOTON)
- TABLE 15. GLOBAL SURFACE DISINFECTION MARKET, BY TYPE, 2022-2032 ($MILLION)
- TABLE 16. GLOBAL SURFACE DISINFECTION MARKET, BY TYPE, 2022-2032 (KILOTON)
- TABLE 17. SURFACE DISINFECTION MARKET FOR LIQUIDS, BY REGION, 2022-2032 ($MILLION)
- TABLE 18. SURFACE DISINFECTION MARKET FOR LIQUIDS, BY REGION, 2022-2032 (KILOTON)
- TABLE 19. SURFACE DISINFECTION MARKET FOR WIPES, BY REGION, 2022-2032 ($MILLION)
- TABLE 20. SURFACE DISINFECTION MARKET FOR WIPES, BY REGION, 2022-2032 (KILOTON)
- TABLE 21. SURFACE DISINFECTION MARKET FOR SPRAYS, BY REGION, 2022-2032 ($MILLION)
- TABLE 22. SURFACE DISINFECTION MARKET FOR SPRAYS, BY REGION, 2022-2032 (KILOTON)
- TABLE 23. GLOBAL SURFACE DISINFECTION MARKET, BY APPLICATION, 2022-2032 ($MILLION)
- TABLE 24. GLOBAL SURFACE DISINFECTION MARKET, BY APPLICATION, 2022-2032 (KILOTON)
- TABLE 25. SURFACE DISINFECTION MARKET FOR SURFACE, BY REGION, 2022-2032 ($MILLION)
- TABLE 26. SURFACE DISINFECTION MARKET FOR SURFACE, BY REGION, 2022-2032 (KILOTON)
- TABLE 27. SURFACE DISINFECTION MARKET FOR INSTRUMENT, BY REGION, 2022-2032 ($MILLION)
- TABLE 28. SURFACE DISINFECTION MARKET FOR INSTRUMENT, BY REGION, 2022-2032 (KILOTON)
- TABLE 29. SURFACE DISINFECTION MARKET FOR OTHERS, BY REGION, 2022-2032 ($MILLION)
- TABLE 30. SURFACE DISINFECTION MARKET FOR OTHERS, BY REGION, 2022-2032 (KILOTON)
- TABLE 31. SURFACE DISINFECTION MARKET, BY REGION, 2022-2032 ($MILLION)
- TABLE 32. SURFACE DISINFECTION MARKET, BY REGION, 2022-2032 (KILOTON)
- TABLE 33. NORTH AMERICA SURFACE DISINFECTION MARKET, BY COMPOSITION, 2022-2032 ($MILLION)
- TABLE 34. NORTH AMERICA SURFACE DISINFECTION MARKET, BY COMPOSITION, 2022-2032 (KILOTON)
- TABLE 35. NORTH AMERICA SURFACE DISINFECTION MARKET, BY TYPE, 2022-2032 ($MILLION)
- TABLE 36. NORTH AMERICA SURFACE DISINFECTION MARKET, BY TYPE, 2022-2032 (KILOTON)
- TABLE 37. NORTH AMERICA SURFACE DISINFECTION MARKET, BY APPLICATION, 2022-2032 ($MILLION)
- TABLE 38. NORTH AMERICA SURFACE DISINFECTION MARKET, BY APPLICATION, 2022-2032 (KILOTON)
- TABLE 39. NORTH AMERICA SURFACE DISINFECTION MARKET, BY COUNTRY, 2022-2032 ($MILLION)
- TABLE 40. NORTH AMERICA SURFACE DISINFECTION MARKET, BY COUNTRY, 2022-2032 (KILOTON)
- TABLE 41. U.S. SURFACE DISINFECTION MARKET, BY COMPOSITION, 2022-2032 ($MILLION)
- TABLE 42. U.S. SURFACE DISINFECTION MARKET, BY COMPOSITION, 2022-2032 (KILOTON)
- TABLE 43. U.S. SURFACE DISINFECTION MARKET, BY TYPE, 2022-2032 ($MILLION)
- TABLE 44. U.S. SURFACE DISINFECTION MARKET, BY TYPE, 2022-2032 (KILOTON)
- TABLE 45. U.S. SURFACE DISINFECTION MARKET, BY APPLICATION, 2022-2032 ($MILLION)
- TABLE 46. U.S. SURFACE DISINFECTION MARKET, BY APPLICATION, 2022-2032 (KILOTON)
- TABLE 47. CANADA SURFACE DISINFECTION MARKET, BY COMPOSITION, 2022-2032 ($MILLION)
- TABLE 48. CANADA SURFACE DISINFECTION MARKET, BY COMPOSITION, 2022-2032 (KILOTON)
- TABLE 49. CANADA SURFACE DISINFECTION MARKET, BY TYPE, 2022-2032 ($MILLION)
- TABLE 50. CANADA SURFACE DISINFECTION MARKET, BY TYPE, 2022-2032 (KILOTON)
- TABLE 51. CANADA SURFACE DISINFECTION MARKET, BY APPLICATION, 2022-2032 ($MILLION)
- TABLE 52. CANADA SURFACE DISINFECTION MARKET, BY APPLICATION, 2022-2032 (KILOTON)
- TABLE 53. MEXICO SURFACE DISINFECTION MARKET, BY COMPOSITION, 2022-2032 ($MILLION)
- TABLE 54. MEXICO SURFACE DISINFECTION MARKET, BY COMPOSITION, 2022-2032 (KILOTON)
- TABLE 55. MEXICO SURFACE DISINFECTION MARKET, BY TYPE, 2022-2032 ($MILLION)
- TABLE 56. MEXICO SURFACE DISINFECTION MARKET, BY TYPE, 2022-2032 (KILOTON)
- TABLE 57. MEXICO SURFACE DISINFECTION MARKET, BY APPLICATION, 2022-2032 ($MILLION)
- TABLE 58. MEXICO SURFACE DISINFECTION MARKET, BY APPLICATION, 2022-2032 (KILOTON)
- TABLE 59. EUROPE SURFACE DISINFECTION MARKET, BY COMPOSITION, 2022-2032 ($MILLION)
- TABLE 60. EUROPE SURFACE DISINFECTION MARKET, BY COMPOSITION, 2022-2032 (KILOTON)
- TABLE 61. EUROPE SURFACE DISINFECTION MARKET, BY TYPE, 2022-2032 ($MILLION)
- TABLE 62. EUROPE SURFACE DISINFECTION MARKET, BY TYPE, 2022-2032 (KILOTON)
- TABLE 63. EUROPE SURFACE DISINFECTION MARKET, BY APPLICATION, 2022-2032 ($MILLION)
- TABLE 64. EUROPE SURFACE DISINFECTION MARKET, BY APPLICATION, 2022-2032 (KILOTON)
- TABLE 65. EUROPE SURFACE DISINFECTION MARKET, BY COUNTRY, 2022-2032 ($MILLION)
- TABLE 66. EUROPE SURFACE DISINFECTION MARKET, BY COUNTRY, 2022-2032 (KILOTON)
- TABLE 67. GERMANY SURFACE DISINFECTION MARKET, BY COMPOSITION, 2022-2032 ($MILLION)
- TABLE 68. GERMANY SURFACE DISINFECTION MARKET, BY COMPOSITION, 2022-2032 (KILOTON)
- TABLE 69. GERMANY SURFACE DISINFECTION MARKET, BY TYPE, 2022-2032 ($MILLION)
- TABLE 70. GERMANY SURFACE DISINFECTION MARKET, BY TYPE, 2022-2032 (KILOTON)
- TABLE 71. GERMANY SURFACE DISINFECTION MARKET, BY APPLICATION, 2022-2032 ($MILLION)
- TABLE 72. GERMANY SURFACE DISINFECTION MARKET, BY APPLICATION, 2022-2032 (KILOTON)
- TABLE 73. UK SURFACE DISINFECTION MARKET, BY COMPOSITION, 2022-2032 ($MILLION)
- TABLE 74. UK SURFACE DISINFECTION MARKET, BY COMPOSITION, 2022-2032 (KILOTON)
- TABLE 75. UK SURFACE DISINFECTION MARKET, BY TYPE, 2022-2032 ($MILLION)
- TABLE 76. UK SURFACE DISINFECTION MARKET, BY TYPE, 2022-2032 (KILOTON)
- TABLE 77. UK SURFACE DISINFECTION MARKET, BY APPLICATION, 2022-2032 ($MILLION)
- TABLE 78. UK SURFACE DISINFECTION MARKET, BY APPLICATION, 2022-2032 (KILOTON)
- TABLE 79. FRANCE SURFACE DISINFECTION MARKET, BY COMPOSITION, 2022-2032 ($MILLION)
- TABLE 80. FRANCE SURFACE DISINFECTION MARKET, BY COMPOSITION, 2022-2032 (KILOTON)
- TABLE 81. FRANCE SURFACE DISINFECTION MARKET, BY TYPE, 2022-2032 ($MILLION)
- TABLE 82. FRANCE SURFACE DISINFECTION MARKET, BY TYPE, 2022-2032 (KILOTON)
- TABLE 83. FRANCE SURFACE DISINFECTION MARKET, BY APPLICATION, 2022-2032 ($MILLION)
- TABLE 84. FRANCE SURFACE DISINFECTION MARKET, BY APPLICATION, 2022-2032 (KILOTON)
- TABLE 85. SPAIN SURFACE DISINFECTION MARKET, BY COMPOSITION, 2022-2032 ($MILLION)
- TABLE 86. SPAIN SURFACE DISINFECTION MARKET, BY COMPOSITION, 2022-2032 (KILOTON)
- TABLE 87. SPAIN SURFACE DISINFECTION MARKET, BY TYPE, 2022-2032 ($MILLION)
- TABLE 88. SPAIN SURFACE DISINFECTION MARKET, BY TYPE, 2022-2032 (KILOTON)
- TABLE 89. SPAIN SURFACE DISINFECTION MARKET, BY APPLICATION, 2022-2032 ($MILLION)
- TABLE 90. SPAIN SURFACE DISINFECTION MARKET, BY APPLICATION, 2022-2032 (KILOTON)
- TABLE 91. ITALY SURFACE DISINFECTION MARKET, BY COMPOSITION, 2022-2032 ($MILLION)
- TABLE 92. ITALY SURFACE DISINFECTION MARKET, BY COMPOSITION, 2022-2032 (KILOTON)
- TABLE 93. ITALY SURFACE DISINFECTION MARKET, BY TYPE, 2022-2032 ($MILLION)
- TABLE 94. ITALY SURFACE DISINFECTION MARKET, BY TYPE, 2022-2032 (KILOTON)
- TABLE 95. ITALY SURFACE DISINFECTION MARKET, BY APPLICATION, 2022-2032 ($MILLION)
- TABLE 96. ITALY SURFACE DISINFECTION MARKET, BY APPLICATION, 2022-2032 (KILOTON)
- TABLE 97. REST OF EUROPE SURFACE DISINFECTION MARKET, BY COMPOSITION, 2022-2032 ($MILLION)
- TABLE 98. REST OF EUROPE SURFACE DISINFECTION MARKET, BY COMPOSITION, 2022-2032 (KILOTON)
- TABLE 99. REST OF EUROPE SURFACE DISINFECTION MARKET, BY TYPE, 2022-2032 ($MILLION)
- TABLE 100. REST OF EUROPE SURFACE DISINFECTION MARKET, BY TYPE, 2022-2032 (KILOTON)
- TABLE 101. REST OF EUROPE SURFACE DISINFECTION MARKET, BY APPLICATION, 2022-2032 ($MILLION)
- TABLE 102. REST OF EUROPE SURFACE DISINFECTION MARKET, BY APPLICATION, 2022-2032 (KILOTON)
- TABLE 103. ASIA-PACIFIC SURFACE DISINFECTION MARKET, BY COMPOSITION, 2022-2032 ($MILLION)
- TABLE 104. ASIA-PACIFIC SURFACE DISINFECTION MARKET, BY COMPOSITION, 2022-2032 (KILOTON)
- TABLE 105. ASIA-PACIFIC SURFACE DISINFECTION MARKET, BY TYPE, 2022-2032 ($MILLION)
- TABLE 106. ASIA-PACIFIC SURFACE DISINFECTION MARKET, BY TYPE, 2022-2032 (KILOTON)
- TABLE 107. ASIA-PACIFIC SURFACE DISINFECTION MARKET, BY APPLICATION, 2022-2032 ($MILLION)
- TABLE 108. ASIA-PACIFIC SURFACE DISINFECTION MARKET, BY APPLICATION, 2022-2032 (KILOTON)
- TABLE 109. ASIA-PACIFIC SURFACE DISINFECTION MARKET, BY COUNTRY, 2022-2032 ($MILLION)
- TABLE 110. ASIA-PACIFIC SURFACE DISINFECTION MARKET, BY COUNTRY, 2022-2032 (KILOTON)
- TABLE 111. CHINA SURFACE DISINFECTION MARKET, BY COMPOSITION, 2022-2032 ($MILLION)
- TABLE 112. CHINA SURFACE DISINFECTION MARKET, BY COMPOSITION, 2022-2032 (KILOTON)
- TABLE 113. CHINA SURFACE DISINFECTION MARKET, BY TYPE, 2022-2032 ($MILLION)
- TABLE 114. CHINA SURFACE DISINFECTION MARKET, BY TYPE, 2022-2032 (KILOTON)
- TABLE 115. CHINA SURFACE DISINFECTION MARKET, BY APPLICATION, 2022-2032 ($MILLION)
- TABLE 116. CHINA SURFACE DISINFECTION MARKET, BY APPLICATION, 2022-2032 (KILOTON)
- TABLE 117. INDIA SURFACE DISINFECTION MARKET, BY COMPOSITION, 2022-2032 ($MILLION)
- TABLE 118. INDIA SURFACE DISINFECTION MARKET, BY COMPOSITION, 2022-2032 (KILOTON)
- TABLE 119. INDIA SURFACE DISINFECTION MARKET, BY TYPE, 2022-2032 ($MILLION)
- TABLE 120. INDIA SURFACE DISINFECTION MARKET, BY TYPE, 2022-2032 (KILOTON)
- TABLE 121. INDIA SURFACE DISINFECTION MARKET, BY APPLICATION, 2022-2032 ($MILLION)
- TABLE 122. INDIA SURFACE DISINFECTION MARKET, BY APPLICATION, 2022-2032 (KILOTON)
- TABLE 123. JAPAN SURFACE DISINFECTION MARKET, BY COMPOSITION, 2022-2032 ($MILLION)
- TABLE 124. JAPAN SURFACE DISINFECTION MARKET, BY COMPOSITION, 2022-2032 (KILOTON)
- TABLE 125. JAPAN SURFACE DISINFECTION MARKET, BY TYPE, 2022-2032 ($MILLION)
- TABLE 126. JAPAN SURFACE DISINFECTION MARKET, BY TYPE, 2022-2032 (KILOTON)
- TABLE 127. JAPAN SURFACE DISINFECTION MARKET, BY APPLICATION, 2022-2032 ($MILLION)
- TABLE 128. JAPAN SURFACE DISINFECTION MARKET, BY APPLICATION, 2022-2032 (KILOTON)
- TABLE 129. SOUTH KOREA SURFACE DISINFECTION MARKET, BY COMPOSITION, 2022-2032 ($MILLION)
- TABLE 130. SOUTH KOREA SURFACE DISINFECTION MARKET, BY COMPOSITION, 2022-2032 (KILOTON)
- TABLE 131. SOUTH KOREA SURFACE DISINFECTION MARKET, BY TYPE, 2022-2032 ($MILLION)
- TABLE 132. SOUTH KOREA SURFACE DISINFECTION MARKET, BY TYPE, 2022-2032 (KILOTON)
- TABLE 133. SOUTH KOREA SURFACE DISINFECTION MARKET, BY APPLICATION, 2022-2032 ($MILLION)
- TABLE 134. SOUTH KOREA SURFACE DISINFECTION MARKET, BY APPLICATION, 2022-2032 (KILOTON)
- TABLE 135. AUSTRALIA SURFACE DISINFECTION MARKET, BY COMPOSITION, 2022-2032 ($MILLION)
- TABLE 136. AUSTRALIA SURFACE DISINFECTION MARKET, BY COMPOSITION, 2022-2032 (KILOTON)
- TABLE 137. AUSTRALIA SURFACE DISINFECTION MARKET, BY TYPE, 2022-2032 ($MILLION)
- TABLE 138. AUSTRALIA SURFACE DISINFECTION MARKET, BY TYPE, 2022-2032 (KILOTON)
- TABLE 139. AUSTRALIA SURFACE DISINFECTION MARKET, BY APPLICATION, 2022-2032 ($MILLION)
- TABLE 140. AUSTRALIA SURFACE DISINFECTION MARKET, BY APPLICATION, 2022-2032 (KILOTON)
- TABLE 141. REST OF ASIA-PACIFIC SURFACE DISINFECTION MARKET, BY COMPOSITION, 2022-2032 ($MILLION)
- TABLE 142. REST OF ASIA-PACIFIC SURFACE DISINFECTION MARKET, BY COMPOSITION, 2022-2032 (KILOTON)
- TABLE 143. REST OF ASIA-PACIFIC SURFACE DISINFECTION MARKET, BY TYPE, 2022-2032 ($MILLION)
- TABLE 144. REST OF ASIA-PACIFIC SURFACE DISINFECTION MARKET, BY TYPE, 2022-2032 (KILOTON)
- TABLE 145. REST OF ASIA-PACIFIC SURFACE DISINFECTION MARKET, BY APPLICATION, 2022-2032 ($MILLION)
- TABLE 146. REST OF ASIA-PACIFIC SURFACE DISINFECTION MARKET, BY APPLICATION, 2022-2032 (KILOTON)
- TABLE 147. LAMEA SURFACE DISINFECTION MARKET, BY COMPOSITION, 2022-2032 ($MILLION)
- TABLE 148. LAMEA SURFACE DISINFECTION MARKET, BY COMPOSITION, 2022-2032 (KILOTON)
- TABLE 149. LAMEA SURFACE DISINFECTION MARKET, BY TYPE, 2022-2032 ($MILLION)
- TABLE 150. LAMEA SURFACE DISINFECTION MARKET, BY TYPE, 2022-2032 (KILOTON)
- TABLE 151. LAMEA SURFACE DISINFECTION MARKET, BY APPLICATION, 2022-2032 ($MILLION)
- TABLE 152. LAMEA SURFACE DISINFECTION MARKET, BY APPLICATION, 2022-2032 (KILOTON)
- TABLE 153. LAMEA SURFACE DISINFECTION MARKET, BY COUNTRY, 2022-2032 ($MILLION)
- TABLE 154. LAMEA SURFACE DISINFECTION MARKET, BY COUNTRY, 2022-2032 (KILOTON)
- TABLE 155. BRAZIL SURFACE DISINFECTION MARKET, BY COMPOSITION, 2022-2032 ($MILLION)
- TABLE 156. BRAZIL SURFACE DISINFECTION MARKET, BY COMPOSITION, 2022-2032 (KILOTON)
- TABLE 157. BRAZIL SURFACE DISINFECTION MARKET, BY TYPE, 2022-2032 ($MILLION)
- TABLE 158. BRAZIL SURFACE DISINFECTION MARKET, BY TYPE, 2022-2032 (KILOTON)
- TABLE 159. BRAZIL SURFACE DISINFECTION MARKET, BY APPLICATION, 2022-2032 ($MILLION)
- TABLE 160. BRAZIL SURFACE DISINFECTION MARKET, BY APPLICATION, 2022-2032 (KILOTON)
- TABLE 161. SAUDI ARABIA SURFACE DISINFECTION MARKET, BY COMPOSITION, 2022-2032 ($MILLION)
- TABLE 162. SAUDI ARABIA SURFACE DISINFECTION MARKET, BY COMPOSITION, 2022-2032 (KILOTON)
- TABLE 163. SAUDI ARABIA SURFACE DISINFECTION MARKET, BY TYPE, 2022-2032 ($MILLION)
- TABLE 164. SAUDI ARABIA SURFACE DISINFECTION MARKET, BY TYPE, 2022-2032 (KILOTON)
- TABLE 165. SAUDI ARABIA SURFACE DISINFECTION MARKET, BY APPLICATION, 2022-2032 ($MILLION)
- TABLE 166. SAUDI ARABIA SURFACE DISINFECTION MARKET, BY APPLICATION, 2022-2032 (KILOTON)
- TABLE 167. SOUTH AFRICA SURFACE DISINFECTION MARKET, BY COMPOSITION, 2022-2032 ($MILLION)
- TABLE 168. SOUTH AFRICA SURFACE DISINFECTION MARKET, BY COMPOSITION, 2022-2032 (KILOTON)
- TABLE 169. SOUTH AFRICA SURFACE DISINFECTION MARKET, BY TYPE, 2022-2032 ($MILLION)
- TABLE 170. SOUTH AFRICA SURFACE DISINFECTION MARKET, BY TYPE, 2022-2032 (KILOTON)
- TABLE 171. SOUTH AFRICA SURFACE DISINFECTION MARKET, BY APPLICATION, 2022-2032 ($MILLION)
- TABLE 172. SOUTH AFRICA SURFACE DISINFECTION MARKET, BY APPLICATION, 2022-2032 (KILOTON)
- TABLE 173. REST OF LAMEA SURFACE DISINFECTION MARKET, BY COMPOSITION, 2022-2032 ($MILLION)
- TABLE 174. REST OF LAMEA SURFACE DISINFECTION MARKET, BY COMPOSITION, 2022-2032 (KILOTON)
- TABLE 175. REST OF LAMEA SURFACE DISINFECTION MARKET, BY TYPE, 2022-2032 ($MILLION)
- TABLE 176. REST OF LAMEA SURFACE DISINFECTION MARKET, BY TYPE, 2022-2032 (KILOTON)
- TABLE 177. REST OF LAMEA SURFACE DISINFECTION MARKET, BY APPLICATION, 2022-2032 ($MILLION)
- TABLE 178. REST OF LAMEA SURFACE DISINFECTION MARKET, BY APPLICATION, 2022-2032 (KILOTON)
- TABLE 179. BASF SE: KEY EXECUTIVES
- TABLE 180. BASF SE: COMPANY SNAPSHOT
- TABLE 181. BASF SE: PRODUCT SEGMENTS
- TABLE 182. BASF SE: SERVICE SEGMENTS
- TABLE 183. BASF SE: PRODUCT PORTFOLIO
- TABLE 184. BASF SE: KEY STRATERGIES
- TABLE 185. 3M: KEY EXECUTIVES
- TABLE 186. 3M: COMPANY SNAPSHOT
- TABLE 187. 3M: PRODUCT SEGMENTS
- TABLE 188. 3M: SERVICE SEGMENTS
- TABLE 189. 3M: PRODUCT PORTFOLIO
- TABLE 190. 3M: KEY STRATERGIES
- TABLE 191. ECOLAB: KEY EXECUTIVES
- TABLE 192. ECOLAB: COMPANY SNAPSHOT
- TABLE 193. ECOLAB: PRODUCT SEGMENTS
- TABLE 194. ECOLAB: SERVICE SEGMENTS
- TABLE 195. ECOLAB: PRODUCT PORTFOLIO
- TABLE 196. ECOLAB: KEY STRATERGIES
- TABLE 197. LANXESS: KEY EXECUTIVES
- TABLE 198. LANXESS: COMPANY SNAPSHOT
- TABLE 199. LANXESS: PRODUCT SEGMENTS
- TABLE 200. LANXESS: SERVICE SEGMENTS
- TABLE 201. LANXESS: PRODUCT PORTFOLIO
- TABLE 202. LANXESS: KEY STRATERGIES
- TABLE 203. LONZA: KEY EXECUTIVES
- TABLE 204. LONZA: COMPANY SNAPSHOT
- TABLE 205. LONZA: PRODUCT SEGMENTS
- TABLE 206. LONZA: SERVICE SEGMENTS
- TABLE 207. LONZA: PRODUCT PORTFOLIO
- TABLE 208. LONZA: KEY STRATERGIES
- TABLE 209. PAXCHEM LTD.: KEY EXECUTIVES
- TABLE 210. PAXCHEM LTD.: COMPANY SNAPSHOT
- TABLE 211. PAXCHEM LTD.: PRODUCT SEGMENTS
- TABLE 212. PAXCHEM LTD.: SERVICE SEGMENTS
- TABLE 213. PAXCHEM LTD.: PRODUCT PORTFOLIO
- TABLE 214. PAXCHEM LTD.: KEY STRATERGIES
- TABLE 215. RECKITT BENCKISER GROUP PLC.: KEY EXECUTIVES
- TABLE 216. RECKITT BENCKISER GROUP PLC.: COMPANY SNAPSHOT
- TABLE 217. RECKITT BENCKISER GROUP PLC.: PRODUCT SEGMENTS
- TABLE 218. RECKITT BENCKISER GROUP PLC.: SERVICE SEGMENTS
- TABLE 219. RECKITT BENCKISER GROUP PLC.: PRODUCT PORTFOLIO
- TABLE 220. RECKITT BENCKISER GROUP PLC.: KEY STRATERGIES
- TABLE 221. SPARTAN CHEMICAL COMPANY, INC.: KEY EXECUTIVES
- TABLE 222. SPARTAN CHEMICAL COMPANY, INC.: COMPANY SNAPSHOT
- TABLE 223. SPARTAN CHEMICAL COMPANY, INC.: PRODUCT SEGMENTS
- TABLE 224. SPARTAN CHEMICAL COMPANY, INC.: SERVICE SEGMENTS
- TABLE 225. SPARTAN CHEMICAL COMPANY, INC.: PRODUCT PORTFOLIO
- TABLE 226. SPARTAN CHEMICAL COMPANY, INC.: KEY STRATERGIES
- TABLE 227. P&G: KEY EXECUTIVES
- TABLE 228. P&G: COMPANY SNAPSHOT
- TABLE 229. P&G: PRODUCT SEGMENTS
- TABLE 230. P&G: SERVICE SEGMENTS
- TABLE 231. P&G: PRODUCT PORTFOLIO
- TABLE 232. P&G: KEY STRATERGIES
- TABLE 233. PAUL HARTMANN AG: KEY EXECUTIVES
- TABLE 234. PAUL HARTMANN AG: COMPANY SNAPSHOT
- TABLE 235. PAUL HARTMANN AG: PRODUCT SEGMENTS
- TABLE 236. PAUL HARTMANN AG: SERVICE SEGMENTS
- TABLE 237. PAUL HARTMANN AG: PRODUCT PORTFOLIO
- TABLE 238. PAUL HARTMANN AG: KEY STRATERGIES
LIST OF FIGURES
- FIGURE 01. SURFACE DISINFECTION MARKET, 2022-2032
- FIGURE 02. SEGMENTATION OF SURFACE DISINFECTION MARKET,2022-2032
- FIGURE 03. TOP IMPACTING FACTORS IN SURFACE DISINFECTION MARKET
- FIGURE 04. TOP INVESTMENT POCKETS IN SURFACE DISINFECTION MARKET (2023-2032)
- FIGURE 05. BARGAINING POWER OF SUPPLIERS
- FIGURE 06. BARGAINING POWER OF BUYERS
- FIGURE 07. THREAT OF SUBSTITUTION
- FIGURE 08. THREAT OF SUBSTITUTION
- FIGURE 09. COMPETITIVE RIVALRY
- FIGURE 10. GLOBAL SURFACE DISINFECTION MARKET:DRIVERS, RESTRAINTS AND OPPORTUNITIES
- FIGURE 11. PRICING ANALYSIS: SURFACE DISINFECTION MARKET 2022 AND 2032
- FIGURE 12. IMPACT OF KEY REGULATION: SURFACE DISINFECTION MARKET
- FIGURE 13. PATENT ANALYSIS BY COMPANY
- FIGURE 14. PATENT ANALYSIS BY COUNTRY
- FIGURE 15. SURFACE DISINFECTION MARKET, BY COMPOSITION, 2022 AND 2032(%)
- FIGURE 16. COMPARATIVE SHARE ANALYSIS OF SURFACE DISINFECTION MARKET FOR ALCOHOLS, BY COUNTRY 2022 AND 2032(%)
- FIGURE 17. COMPARATIVE SHARE ANALYSIS OF SURFACE DISINFECTION MARKET FOR CHLORINE COMPOUNDS, BY COUNTRY 2022 AND 2032(%)
- FIGURE 18. COMPARATIVE SHARE ANALYSIS OF SURFACE DISINFECTION MARKET FOR QUATERNARY AMMONIUM COMPOUNDS, BY COUNTRY 2022 AND 2032(%)
- FIGURE 19. COMPARATIVE SHARE ANALYSIS OF SURFACE DISINFECTION MARKET FOR HYDROGEN PEROXIDE, BY COUNTRY 2022 AND 2032(%)
- FIGURE 20. COMPARATIVE SHARE ANALYSIS OF SURFACE DISINFECTION MARKET FOR PERACETIC ACID, BY COUNTRY 2022 AND 2032(%)
- FIGURE 21. COMPARATIVE SHARE ANALYSIS OF SURFACE DISINFECTION MARKET FOR OTHERS, BY COUNTRY 2022 AND 2032(%)
- FIGURE 22. SURFACE DISINFECTION MARKET, BY TYPE, 2022 AND 2032(%)
- FIGURE 23. COMPARATIVE SHARE ANALYSIS OF SURFACE DISINFECTION MARKET FOR LIQUIDS, BY COUNTRY 2022 AND 2032(%)
- FIGURE 24. COMPARATIVE SHARE ANALYSIS OF SURFACE DISINFECTION MARKET FOR WIPES, BY COUNTRY 2022 AND 2032(%)
- FIGURE 25. COMPARATIVE SHARE ANALYSIS OF SURFACE DISINFECTION MARKET FOR SPRAYS, BY COUNTRY 2022 AND 2032(%)
- FIGURE 26. SURFACE DISINFECTION MARKET, BY APPLICATION, 2022 AND 2032(%)
- FIGURE 27. COMPARATIVE SHARE ANALYSIS OF SURFACE DISINFECTION MARKET FOR SURFACE, BY COUNTRY 2022 AND 2032(%)
- FIGURE 28. COMPARATIVE SHARE ANALYSIS OF SURFACE DISINFECTION MARKET FOR INSTRUMENT, BY COUNTRY 2022 AND 2032(%)
- FIGURE 29. COMPARATIVE SHARE ANALYSIS OF SURFACE DISINFECTION MARKET FOR OTHERS, BY COUNTRY 2022 AND 2032(%)
- FIGURE 30. SURFACE DISINFECTION MARKET BY REGION, 2022 AND 2032(%)
- FIGURE 31. U.S. SURFACE DISINFECTION MARKET, 2022-2032 ($MILLION)
- FIGURE 32. CANADA SURFACE DISINFECTION MARKET, 2022-2032 ($MILLION)
- FIGURE 33. MEXICO SURFACE DISINFECTION MARKET, 2022-2032 ($MILLION)
- FIGURE 34. GERMANY SURFACE DISINFECTION MARKET, 2022-2032 ($MILLION)
- FIGURE 35. UK SURFACE DISINFECTION MARKET, 2022-2032 ($MILLION)
- FIGURE 36. FRANCE SURFACE DISINFECTION MARKET, 2022-2032 ($MILLION)
- FIGURE 37. SPAIN SURFACE DISINFECTION MARKET, 2022-2032 ($MILLION)
- FIGURE 38. ITALY SURFACE DISINFECTION MARKET, 2022-2032 ($MILLION)
- FIGURE 39. REST OF EUROPE SURFACE DISINFECTION MARKET, 2022-2032 ($MILLION)
- FIGURE 40. CHINA SURFACE DISINFECTION MARKET, 2022-2032 ($MILLION)
- FIGURE 41. INDIA SURFACE DISINFECTION MARKET, 2022-2032 ($MILLION)
- FIGURE 42. JAPAN SURFACE DISINFECTION MARKET, 2022-2032 ($MILLION)
- FIGURE 43. SOUTH KOREA SURFACE DISINFECTION MARKET, 2022-2032 ($MILLION)
- FIGURE 44. AUSTRALIA SURFACE DISINFECTION MARKET, 2022-2032 ($MILLION)
- FIGURE 45. REST OF ASIA-PACIFIC SURFACE DISINFECTION MARKET, 2022-2032 ($MILLION)
- FIGURE 46. BRAZIL SURFACE DISINFECTION MARKET, 2022-2032 ($MILLION)
- FIGURE 47. SAUDI ARABIA SURFACE DISINFECTION MARKET, 2022-2032 ($MILLION)
- FIGURE 48. SOUTH AFRICA SURFACE DISINFECTION MARKET, 2022-2032 ($MILLION)
- FIGURE 49. REST OF LAMEA SURFACE DISINFECTION MARKET, 2022-2032 ($MILLION)
- FIGURE 50. TOP WINNING STRATEGIES, BY YEAR
- FIGURE 51. TOP WINNING STRATEGIES, BY DEVELOPMENT
- FIGURE 52. TOP WINNING STRATEGIES, BY COMPANY
- FIGURE 53. PRODUCT MAPPING OF TOP 10 PLAYERS
- FIGURE 54. COMPETITIVE DASHBOARD
- FIGURE 55. COMPETITIVE HEATMAP: SURFACE DISINFECTION MARKET
- FIGURE 56. TOP PLAYER POSITIONING, 2022
 全球紫外線消毒設備市場規模(按產品類型、最終用戶、應用、區域範圍和預測)
 2025年全球紫外線C(UVC)消毒產品市場報告
 臭氧水消毒系統市場按設備類型、技術、安裝模式、所用材料類型、功能、關鍵性能參數、應用、最終用途分類 - 2025-2030 年全球預測2025 年全球紫外線滅菌設備市場報告
 紫外線消毒設備市場規模、佔有率和成長分析(按組件、額定功率、營運模式、技術、行銷管道、應用、最終用戶和地區)- 產業預測 2025-2032
 紫外線消毒設備市場分析:趨勢、預測與競爭分析(至2030年)全球紫外線消毒設備市場:按額定功率、類型、組件、最終用戶、應用分類 - 預測 2025-2030
 紫外線消毒設備市場:2024-2033 年全球產業分析、規模、佔有率、成長、趨勢、預測
 到 2030 年亞太地區紫外線消毒設備市場預測 - 區域分析 - 按組件、額定功率、應用和最終用戶
 北美紫外線消毒設備市場預測至 2030 年 - 區域分析 - 按組件、額定功率、應用和最終用戶