


 |
市場調查報告書
商品編碼
1472264
線路避雷器市場:按類型、應用、電壓、最終用戶分類:2023-2032 年全球機會分析與產業預測Line Arresters Market By Type, By Application, By Voltage, By End User : Global Opportunity Analysis and Industry Forecast, 2023-2032 |
||||||
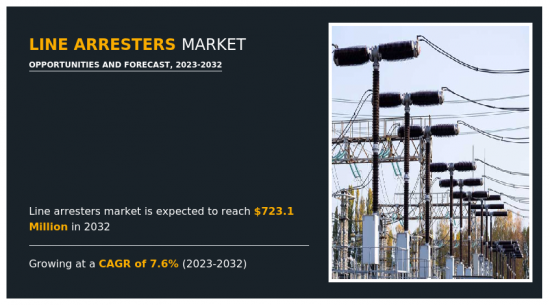
2022年,全球線路避雷器市值為3.604億美元,預計2023年至2032年複合年成長率為7.6%,到2032年將達到7.231億美元。
避雷器又稱避雷器或突波避雷器,是電力系統中用於保護設備和基礎設施免受雷擊、開關操作和其他外部因素引起的瞬態過電壓的保護裝置。這些設備旨在轉移或限制對地的過大電壓尖峰,防止損壞敏感設備、絕緣體和電網中的其他組件。它們通常安裝在輸配電線路、變電站和其他關鍵基礎設施點,以提供有效的電壓突波保護並維持電網完整性。
避雷器透過將過高的電壓尖峰引導遠離敏感設備並將其安全接地,在減少雷電突波的影響方面發揮重要作用。這些設備策略性地放置在電力線路沿線的戰略點上,以在雷電能量到達下游設備之前攔截並消散雷電能量。透過提供可靠的雷擊突波屏障,線路避雷器可以保護電氣基礎設施、最大限度地減少停機時間並降低設備損壞的風險和相關成本。此外,面對日益增加的環境風險,公用事業和工業面臨確保電力系統可靠性和彈性的壓力。因此,對具有先進突波保護功能的線路避雷器的需求激增,相關人員紛紛尋求創新解決方案來減少雷擊和其他瞬態過電壓的影響。所有這些因素都在推動預測期內對線路避雷器市場的需求。
然而,監管合規性仍然是線路避雷器市場新參與企業的進入障礙。與測試、認證和合規相關的高昂成本阻礙了小型製造商和新興企業進入市場,從而限制了競爭和創新。缺乏競爭導致線路避雷器的價格上漲,抑制了市場的成長和普及,特別是在監管要求嚴格的地區。所有這些因素都阻礙了線路避雷器市場的成長。
隨著電力系統日益數位化和自動化,可靠的突波保護解決方案對於保護敏感電子設備和控制系統免受電壓干擾的重要性日益增加。線路避雷器具有先進的監控和診斷功能,可實現主動維護和對瞬態過電壓的快速響應,從而提高電網運作的整體彈性和可靠性。此外,將智慧電網技術與線路避雷器整合可以促進對電網資產的即時監控和控制,從而可以在潛在的漏洞升級為全電網故障之前檢測到並加以緩解。所有這些因素預計將在預測期內為線路避雷器市場創造新的成長機會。
避雷器市場按類型、電壓、應用、最終用戶和地區細分。根據類型,市場分為無間隙避雷器和外間隙避雷器。根據電壓,市場分為中、高、低。依用途可分為輸電線路和配電線路。依最終用戶分類,市場分為變電站、通訊等。從區域來看,我們對北美、歐洲、亞太地區和拉丁美洲/中東/非洲的市場進行了分析。
依類型分為無間隙型避雷器和外置間隙型避雷器。到 2022 年,無間隙線路避雷器細分市場將佔全球線路避雷器市場佔有率的三分之二以上,預計在預測期內將保持其主導地位。材料科學和製造技術的進步促進了性能特性改進的無間隙線路避雷器的開發。例如,金屬氧化物壓敏電阻 (MOV) 和矽橡膠外殼等現代聚合物材料可提供卓越的電氣絕緣性、熱穩定性和機械強度。這些材料使無間隙線路避雷器能夠承受更高的能量水平並延長其使用壽命,從而降低維護要求並降低生命週期成本。
根據電壓,市場分為中、高、低。到 2022 年,中型細分市場將佔全球線路避雷器市場佔有率的一半,預計在預測期內將保持其主導地位。環境因素會影響中壓線路避雷器的選擇。隨著世界對永續性和環境管理的關注日益增加,電力公司正在尋求能夠最大限度地減少對環境影響的解決方案。現代避雷器設計採用環保材料和製造程序,以滿足永續性目標和法規要求。
依應用,市場分為輸電線路和配電線路。到 2022 年,輸電線路領域將佔全球線路避雷器市場佔有率的近五分之三,預計在預測期內將保持其主導地位。對電網可靠性和彈性的日益重視導致線路避雷器的廣泛採用。這些元件透過提供對暫態電壓突波的強大保護來幫助提高整體電力傳輸系統的可靠性。透過在電力線路沿線的戰略位置安裝避雷器,公共產業可以最大限度地減少停機時間,提高系統性能,並降低大範圍停電的可能性。
根據最終用戶,市場分為變電站、通訊等。到 2022 年,變電站領域將佔全球線路避雷器市場佔有率的近四分之三,預計在預測期內將保持其主導地位。電力需求的快速成長需要擴大和加強輸配電網路。根據國際能源總署(IEA)預測,未來三年全球電力需求預計將進一步增加,到2026年年平均成長率為3.4%。隨著這些網路的發展,它們變得更容易受到雷擊、開關突波和其他可能損壞設備或中斷電源的瞬態過電壓的影響。
從區域來看,我們對北美、歐洲、亞太地區和拉丁美洲/中東/非洲的市場進行了分析。 2022年,亞太地區佔全球線路避雷器市場佔有率的一半以下,預計在預測期內將保持其主導地位。旨在提高電力基礎設施可靠性和彈性的政府措施和法規正在推動亞太地區對避雷器的需求。國際能源總署(IEA)預計,到2026年,中國將佔全球電力需求成長的最大佔有率,印度將成為主要國家中成長最快的國家。該地區各國政府正在投資電網升級和現代化,以提高其容量和可靠性,而避雷器是保護電網免受電壓突波和其他干擾的重要組成部分。
主要發現
- 按類型分類,無間隙線路避雷器領域預計在預測期內成長最快,複合年成長率為 7.7%。
- 按電壓分類,中壓細分市場預計在預測期內將以最快的複合年成長率成長。
- 從應用來看,輸電線路領域預計在預測期內成長最快,複合年成長率為 7.8%。
- 從最終用戶來看,變電站部分預計在預測期內將以最快的複合年成長率成長。
- 按地區分類,亞太地區在 2022 年的銷售額中所佔佔有率最高。
相關人員的主要利益
- 本報告對 2022 年至 2032 年線路避雷器市場分析的細分市場、當前趨勢、估計/趨勢和動態進行了定量分析,以確定線路避雷器市場的強大機會。
- 它提供市場研究以及與市場促進因素、市場限制和市場機會相關的資訊。
- 波特的五力分析強調買家和供應商幫助相關人員做出利潤驅動的商業決策並加強供應商-買家網路的力量。
- 對線路避雷器市場細分的詳細分析有助於識別市場機會。
- 我們根據每個地區的主要國家對全球市場的收益貢獻繪製了地圖。
- 市場參與企業定位有助於基準化分析,並提供對市場參與企業當前地位的清晰了解。
- 該報告包括對區域和全球避雷器市場趨勢、主要企業、細分市場、應用細分和市場成長策略的分析。
可使用此報告進行客製化(需要額外費用和時間表)
- 產品中所含原料分析(%)
- 裝置量分析
- 產品基準/產品規格及應用
- 產品生命週期
- 科技趨勢分析
- 按產品/細分市場對參與企業進行市場區隔分析
- 新產品開發/主要參與企業產品矩陣
- 監管指引
- 根據客戶興趣新增其他公司簡介
- 按國家或地區進行的附加分析 – 市場規模和預測
- 擴大公司簡介列表
- 歷史市場資料
- 主要參與企業的詳細資料(Excel格式,包括位置、聯絡資訊、供應商/供應商網路等)
- 客戶/消費者/原料供應商名單 - 價值鏈分析
- 全球/區域/國家層級參與企業的市場佔有率分析
- SWOT分析
目錄
第1章簡介
第 2 章執行摘要
第3章市場概況
- 市場定義和範圍
- 主要發現
- 影響因素
- 關鍵投資機會
- 波特五力分析
- 市場動態
- 促進因素
- 抑制因素
- 機會
- 價值鏈分析
- 關鍵監管分析
第 4 章 避雷器市場:按類型
- 概述
- 無間隙線路避雷器
- 外置間隙式線路避雷器
第5章避雷器市場:依應用分類
- 概述
- 電源線
- 配電線
第6章 避雷器市場:依電壓分類
- 概述
- 中壓
- 高電壓
- 低電壓
第7章 避雷器市場:依最終使用者分類
- 概述
- 變電站
- 通訊
- 其他
第8章避雷器市場:按地區
- 概述
- 北美洲
- 美國
- 加拿大
- 墨西哥
- 歐洲
- 德國
- 義大利
- 英國
- 西班牙
- 法國
- 其他
- 亞太地區
- 中國
- 日本
- 印度
- 韓國
- 澳洲
- 其他
- 拉丁美洲/中東/非洲
- 巴西
- 南非
- 沙烏地阿拉伯
- 其他
第9章 競爭格局
- 介紹
- 關鍵成功策略
- 10家主要企業產品圖譜
- 競爭對手儀表板
- 競爭熱圖
- 2022年主要企業定位
第10章 公司簡介
- Siemens Energy
- Hitachi
- Raychem RPG Private Limited.
- TOSHIBA CORPORATION
- MAPPEC
- Tridelta Meidensha GmbH
- Hubbell Inc.
- TE Connectivity
- Elmac Technologies
- KA Factor Group Inc..
- MacLean Power Systems.
The global line arresters market was valued at $360.4 million in 2022, and is projected to reach $723.1 million by 2032, growing at a CAGR of 7.6% from 2023 to 2032.
Line arresters also known as surge arresters or lightning arresters which are protective devices used in electrical power systems to safeguard equipment and infrastructure from transient overvoltage caused by lightning strikes, switching operations, or other external factors. These devices are designed to divert or limit excessive voltage spikes to ground, thereby preventing damage to sensitive equipment, insulation, and other components within the electrical network. They are commonly installed at strategic points along power transmission and distribution lines, as well as within substations and other critical infrastructure, to provide effective protection against voltage surges and maintain the integrity of the electrical grid.
Line arresters play a crucial role in mitigating the impact of lightning-induced surges by diverting excessive voltage spikes away from sensitive equipment and grounding them safely. These devices are strategically installed at key points along power lines to intercept and dissipate the energy of lightning strikes before it reaches downstream equipment. By providing a reliable barrier against lightning-induced surges, line arresters help safeguard electrical infrastructure, minimize downtime, and reduce the risk of equipment damage and associated costs. In addition, utilities and industries are under increasing pressure to ensure the reliability and resilience of their electrical systems in the face of growing environmental risks. As a result, the demand for line arresters with advanced surge protection capabilities has surged, with stakeholders seeking innovative solutions to mitigate the impact of lightning strikes and other transient overvoltage. All these factors drive the demand for the line arresters market during the forecast period.
However, regulatory compliance acts as a barrier to entry for new entrants into the line arrester market. The high costs associated with testing, certification, and compliance efforts deter smaller manufacturers or startups from entering the market, limiting competition and innovation. This lack of competition leads to higher prices for line arresters and inhibits market growth and adoption, particularly in regions with stringent regulatory requirements. All these factors hamper the line arresters market growth.
The increase in digitization and automation of power systems has heightened the importance of reliable surge protection solutions to safeguard sensitive electronic equipment and control systems from voltage disturbances. Line arresters with advanced monitoring and diagnostic capabilities enable proactive maintenance and rapid response to transient overvoltage, enhancing the overall resilience and reliability of grid operations. In addition, the integration of line arresters with smart grid technologies facilitates real-time monitoring and control of grid assets, enabling operators to detect and mitigate potential vulnerabilities before they escalate into grid-wide failures. All these factors are anticipated to offer new growth opportunities for the line arresters market during the forecast period.
The line arresters market is segmented on the basis of type, voltage, application, end user, and region. On the basis of type, the market is bifurcated into a non-gapped line arrester, and externally gapped line arrester. On the basis of voltage, the market is divided into medium, high, and low. On the basis of application, the market is bifurcated into transmission line, and distribution line. On the basis of end user, the market is segmented into power substations, telecommunications, and others. Region-wise, the market is analyzed across North America, Europe, Asia-Pacific, and LAMEA.
On the basis of type, the market is bifurcated into a non-gapped line arrester, and externally gapped line arrester. The non-gapped line arrester segment accounted for more than two-thirds of global line arresters market share in 2022 and is expected to maintain its dominance during the forecast period. Advancements in materials science and manufacturing techniques have facilitated the development of non-gapped line arresters with enhanced performance characteristics. For instance, modern polymer-based materials, such as metal-oxide varistors (MOVs) and silicone rubber housings, offer superior electrical insulation, thermal stability, and mechanical strength compared to traditional porcelain or glass insulators used in gapped arresters. These materials enable non-gapped line arresters to withstand higher energy levels and provide extended service life, resulting in lower maintenance requirements and reduced lifecycle costs.
Based on voltage, the market is divided into medium, high, and low. The medium segment accounted for half of global line arresters market share in 2022 and is expected to maintain its dominance during the forecast period. Environmental considerations influence the selection of medium voltage line arresters. As the global focus on sustainability and environmental stewardship intensifies, utilities seek solutions that minimize environmental impact. Modern arrester designs incorporate environmentally friendly materials and manufacturing processes, aligning with sustainability goals and regulatory requirements.
On the basis of application, the market is bifurcated into transmission line, and distribution line. The transmission line segment accounted for less than three-fifths of global line arresters market share in 2022 and is expected to maintain its dominance during the forecast period. The rise in emphasis on grid reliability and resilience has led to the widespread adoption of line arresters. These devices help enhance the overall reliability of the transmission system by providing a robust defense against transient voltage surges. By installing line arresters at strategic locations along transmission lines, utilities that minimize downtime, improve system performance, and reduce the likelihood of widespread outages.
Based on end user, the market is segmented into power substations, telecommunications, and others The power substations segment accounted for less than three-fourths of global line arresters market share in 2022 and is expected to maintain its dominance during the forecast period. The surge in demand for electricity necessitates the expansion and enhancement of power transmission and distribution networks. According to the International Energy Agency (IEA), global electricity demand is expected to rise at a faster rate over the next three years, growing by an average of 3.4% annually through 2026. As these networks grow, they become more susceptible to lightning strikes, switching surges, and other transient overvoltage events that damage equipment and disrupt power supply.
Region-wise, the market is analyzed across North America, Europe, Asia-Pacific, and LAMEA. Asia-Pacific accounted for less than half of the global line arresters market share in 2022 and is expected to maintain its dominance during the forecast period. Government initiatives and regulations aimed at improving the reliability and resilience of the power infrastructure drive the demand for line arresters in the Asia-Pacific region. According to the International Energy Agency (IEA), China provides the largest share of global electricity demand growth in terms of volume and India posts the fastest growth rate through 2026 among major economies. Governments across the region are investing in upgrading and modernizing their electrical grids to enhance their capacity and reliability, and line arresters are an essential component of these efforts to safeguard the infrastructure against voltage surges and other disturbances.
Key players in the line arresters market include Elmac Technologies, Hitachi, Hubbell, KA Factor Group Inc., MacLean Power Systems, MAPPEC, Raychem RPG Private Limited., Siemens Energy, TE Connectivity, Toshiba International Corporation Pty Ltd., and Tridelta Meidensha GmbH. Apart from these major players, there are other key players in the line arresters market. These include ABB Ltd, Bel Fuse Inc., Crompton Greaves Ltd, Eaton Corporation, Legrand SA, Mitsubishi Electric Corporation, Prysmian Group, and Schneider Electric SE.
Key findings of the study
- On the basis of type, the non-gapped line arrester segment is anticipated to grow at the fastest CAGR of 7.7% during the forecast period.
- By voltage, the medium segment is anticipated to grow at the fastest CAGR during the forecast period.
- On the basis of application, the transmission line segment is anticipated to grow at the fastest CAGR of 7.8% during the forecast period.
- By end-user, the power substations segment is anticipated to grow at the fastest CAGR during the forecast period.
- Region-wise, Asia-Pacific has the highest share in 2022 in terms of revenue.
Key Benefits for Stakeholders
- This report provides a quantitative analysis of the market segments, current trends, estimations, and dynamics of the line arresters market analysis from 2022 to 2032 to identify the prevailing line arresters market opportunities.
- The market research is offered along with information related to key drivers, restraints, and opportunities.
- Porter's five forces analysis highlights the potency of buyers and suppliers to enable stakeholders make profit-oriented business decisions and strengthen their supplier-buyer network.
- In-depth analysis of the line arresters market segmentation assists to determine the prevailing market opportunities.
- Major countries in each region are mapped according to their revenue contribution to the global market.
- Market player positioning facilitates benchmarking and provides a clear understanding of the present position of the market players.
- The report includes the analysis of the regional as well as global line arresters market trends, key players, market segments, application areas, and market growth strategies.
Additional benefits you will get with this purchase are:
- Quarterly Update and* (only available with a corporate license, on listed price)
- 5 additional Company Profile of client Choice pre- or Post-purchase, as a free update.
- Free Upcoming Version on the Purchase of Five and Enterprise User License.
- 16 analyst hours of support* (post-purchase, if you find additional data requirements upon review of the report, you may receive support amounting to 16 analyst hours to solve questions, and post-sale queries)
- 15% Free Customization* (in case the scope or segment of the report does not match your requirements, 15% is equivalent to 3 working days of free work, applicable once)
- Free data Pack on the Five and Enterprise User License. (Excel version of the report)
- Free Updated report if the report is 6-12 months old or older.
- 24-hour priority response*
- Free Industry updates and white papers.
Possible Customization with this report (with additional cost and timeline, please talk to the sales executive to know more)
- Analysis of raw material in a product (by %)
- Installed Base analysis
- Product Benchmarking / Product specification and applications
- Product Life Cycles
- Technology Trend Analysis
- Market share analysis of players by products/segments
- New Product Development/ Product Matrix of Key Players
- Regulatory Guidelines
- Additional company profiles with specific to client's interest
- Additional country or region analysis- market size and forecast
- Expanded list for Company Profiles
- Historic market data
- Key player details (including location, contact details, supplier/vendor network etc. in excel format)
- List of customers/consumers/raw material suppliers- value chain analysis
- Market share analysis of players at global/region/country level
- SWOT Analysis
Key Market Segments
By Type
- Non Gapped Line Arrester
- Externally Gapped Line Arrester
By Application
- Transmission Line
- Distribution Line
By Voltage
- Medium
- High
- Low
By End User
- Power Substations
- Telecommunications
- Others
By Region
- North America
- U.S.
- Canada
- Mexico
- Europe
- Germany
- Italy
- UK
- Spain
- France
- Rest of Europe
- Asia-Pacific
- China
- Japan
- India
- South Korea
- Australia
- Rest of Asia-Pacific
- LAMEA
- Brazil
- South Africa
- Saudi Arabia
- Rest of LAMEA
Key Market Players:
- Siemens Energy
- Hitachi
- Raychem RPG Private Limited.
- TOSHIBA CORPORATION
- MAPPEC
- Tridelta Meidensha GmbH
- Hubbell Inc.
- TE Connectivity
- Elmac Technologies
- KA Factor Group Inc..
- MacLean Power Systems.
TABLE OF CONTENTS
CHAPTER 1: INTRODUCTION
- 1.1. Report description
- 1.2. Key market segments
- 1.3. Key benefits to the stakeholders
- 1.4. Research methodology
- 1.4.1. Primary research
- 1.4.2. Secondary research
- 1.4.3. Analyst tools and models
CHAPTER 2: EXECUTIVE SUMMARY
- 2.1. CXO perspective
CHAPTER 3: MARKET OVERVIEW
- 3.1. Market definition and scope
- 3.2. Key findings
- 3.2.1. Top impacting factors
- 3.2.2. Top investment pockets
- 3.3. Porter's five forces analysis
- 3.4. Market dynamics
- 3.4.1. Drivers
- 3.4.2. Restraints
- 3.4.3. Opportunities
- 3.5. Value Chain Analysis
- 3.6. Key Regulation Analysis
CHAPTER 4: LINE ARRESTERS MARKET, BY TYPE
- 4.1. Overview
- 4.1.1. Market size and forecast
- 4.2. Non Gapped Line Arrester
- 4.2.1. Key market trends, growth factors and opportunities
- 4.2.2. Market size and forecast, by region
- 4.2.3. Market share analysis by country
- 4.3. Externally Gapped Line Arrester
- 4.3.1. Key market trends, growth factors and opportunities
- 4.3.2. Market size and forecast, by region
- 4.3.3. Market share analysis by country
CHAPTER 5: LINE ARRESTERS MARKET, BY APPLICATION
- 5.1. Overview
- 5.1.1. Market size and forecast
- 5.2. Transmission Line
- 5.2.1. Key market trends, growth factors and opportunities
- 5.2.2. Market size and forecast, by region
- 5.2.3. Market share analysis by country
- 5.3. Distribution Line
- 5.3.1. Key market trends, growth factors and opportunities
- 5.3.2. Market size and forecast, by region
- 5.3.3. Market share analysis by country
CHAPTER 6: LINE ARRESTERS MARKET, BY VOLTAGE
- 6.1. Overview
- 6.1.1. Market size and forecast
- 6.2. Medium
- 6.2.1. Key market trends, growth factors and opportunities
- 6.2.2. Market size and forecast, by region
- 6.2.3. Market share analysis by country
- 6.3. High
- 6.3.1. Key market trends, growth factors and opportunities
- 6.3.2. Market size and forecast, by region
- 6.3.3. Market share analysis by country
- 6.4. Low
- 6.4.1. Key market trends, growth factors and opportunities
- 6.4.2. Market size and forecast, by region
- 6.4.3. Market share analysis by country
CHAPTER 7: LINE ARRESTERS MARKET, BY END USER
- 7.1. Overview
- 7.1.1. Market size and forecast
- 7.2. Power Substations
- 7.2.1. Key market trends, growth factors and opportunities
- 7.2.2. Market size and forecast, by region
- 7.2.3. Market share analysis by country
- 7.3. Telecommunications
- 7.3.1. Key market trends, growth factors and opportunities
- 7.3.2. Market size and forecast, by region
- 7.3.3. Market share analysis by country
- 7.4. Others
- 7.4.1. Key market trends, growth factors and opportunities
- 7.4.2. Market size and forecast, by region
- 7.4.3. Market share analysis by country
CHAPTER 8: LINE ARRESTERS MARKET, BY REGION
- 8.1. Overview
- 8.1.1. Market size and forecast By Region
- 8.2. North America
- 8.2.1. Key market trends, growth factors and opportunities
- 8.2.2. Market size and forecast, by Type
- 8.2.3. Market size and forecast, by Application
- 8.2.4. Market size and forecast, by Voltage
- 8.2.5. Market size and forecast, by End User
- 8.2.6. Market size and forecast, by country
- 8.2.6.1. U.S.
- 8.2.6.1.1. Market size and forecast, by Type
- 8.2.6.1.2. Market size and forecast, by Application
- 8.2.6.1.3. Market size and forecast, by Voltage
- 8.2.6.1.4. Market size and forecast, by End User
- 8.2.6.2. Canada
- 8.2.6.2.1. Market size and forecast, by Type
- 8.2.6.2.2. Market size and forecast, by Application
- 8.2.6.2.3. Market size and forecast, by Voltage
- 8.2.6.2.4. Market size and forecast, by End User
- 8.2.6.3. Mexico
- 8.2.6.3.1. Market size and forecast, by Type
- 8.2.6.3.2. Market size and forecast, by Application
- 8.2.6.3.3. Market size and forecast, by Voltage
- 8.2.6.3.4. Market size and forecast, by End User
- 8.3. Europe
- 8.3.1. Key market trends, growth factors and opportunities
- 8.3.2. Market size and forecast, by Type
- 8.3.3. Market size and forecast, by Application
- 8.3.4. Market size and forecast, by Voltage
- 8.3.5. Market size and forecast, by End User
- 8.3.6. Market size and forecast, by country
- 8.3.6.1. Germany
- 8.3.6.1.1. Market size and forecast, by Type
- 8.3.6.1.2. Market size and forecast, by Application
- 8.3.6.1.3. Market size and forecast, by Voltage
- 8.3.6.1.4. Market size and forecast, by End User
- 8.3.6.2. Italy
- 8.3.6.2.1. Market size and forecast, by Type
- 8.3.6.2.2. Market size and forecast, by Application
- 8.3.6.2.3. Market size and forecast, by Voltage
- 8.3.6.2.4. Market size and forecast, by End User
- 8.3.6.3. UK
- 8.3.6.3.1. Market size and forecast, by Type
- 8.3.6.3.2. Market size and forecast, by Application
- 8.3.6.3.3. Market size and forecast, by Voltage
- 8.3.6.3.4. Market size and forecast, by End User
- 8.3.6.4. Spain
- 8.3.6.4.1. Market size and forecast, by Type
- 8.3.6.4.2. Market size and forecast, by Application
- 8.3.6.4.3. Market size and forecast, by Voltage
- 8.3.6.4.4. Market size and forecast, by End User
- 8.3.6.5. France
- 8.3.6.5.1. Market size and forecast, by Type
- 8.3.6.5.2. Market size and forecast, by Application
- 8.3.6.5.3. Market size and forecast, by Voltage
- 8.3.6.5.4. Market size and forecast, by End User
- 8.3.6.6. Rest of Europe
- 8.3.6.6.1. Market size and forecast, by Type
- 8.3.6.6.2. Market size and forecast, by Application
- 8.3.6.6.3. Market size and forecast, by Voltage
- 8.3.6.6.4. Market size and forecast, by End User
- 8.4. Asia-Pacific
- 8.4.1. Key market trends, growth factors and opportunities
- 8.4.2. Market size and forecast, by Type
- 8.4.3. Market size and forecast, by Application
- 8.4.4. Market size and forecast, by Voltage
- 8.4.5. Market size and forecast, by End User
- 8.4.6. Market size and forecast, by country
- 8.4.6.1. China
- 8.4.6.1.1. Market size and forecast, by Type
- 8.4.6.1.2. Market size and forecast, by Application
- 8.4.6.1.3. Market size and forecast, by Voltage
- 8.4.6.1.4. Market size and forecast, by End User
- 8.4.6.2. Japan
- 8.4.6.2.1. Market size and forecast, by Type
- 8.4.6.2.2. Market size and forecast, by Application
- 8.4.6.2.3. Market size and forecast, by Voltage
- 8.4.6.2.4. Market size and forecast, by End User
- 8.4.6.3. India
- 8.4.6.3.1. Market size and forecast, by Type
- 8.4.6.3.2. Market size and forecast, by Application
- 8.4.6.3.3. Market size and forecast, by Voltage
- 8.4.6.3.4. Market size and forecast, by End User
- 8.4.6.4. South Korea
- 8.4.6.4.1. Market size and forecast, by Type
- 8.4.6.4.2. Market size and forecast, by Application
- 8.4.6.4.3. Market size and forecast, by Voltage
- 8.4.6.4.4. Market size and forecast, by End User
- 8.4.6.5. Australia
- 8.4.6.5.1. Market size and forecast, by Type
- 8.4.6.5.2. Market size and forecast, by Application
- 8.4.6.5.3. Market size and forecast, by Voltage
- 8.4.6.5.4. Market size and forecast, by End User
- 8.4.6.6. Rest of Asia-Pacific
- 8.4.6.6.1. Market size and forecast, by Type
- 8.4.6.6.2. Market size and forecast, by Application
- 8.4.6.6.3. Market size and forecast, by Voltage
- 8.4.6.6.4. Market size and forecast, by End User
- 8.5. LAMEA
- 8.5.1. Key market trends, growth factors and opportunities
- 8.5.2. Market size and forecast, by Type
- 8.5.3. Market size and forecast, by Application
- 8.5.4. Market size and forecast, by Voltage
- 8.5.5. Market size and forecast, by End User
- 8.5.6. Market size and forecast, by country
- 8.5.6.1. Brazil
- 8.5.6.1.1. Market size and forecast, by Type
- 8.5.6.1.2. Market size and forecast, by Application
- 8.5.6.1.3. Market size and forecast, by Voltage
- 8.5.6.1.4. Market size and forecast, by End User
- 8.5.6.2. South Africa
- 8.5.6.2.1. Market size and forecast, by Type
- 8.5.6.2.2. Market size and forecast, by Application
- 8.5.6.2.3. Market size and forecast, by Voltage
- 8.5.6.2.4. Market size and forecast, by End User
- 8.5.6.3. Saudi Arabia
- 8.5.6.3.1. Market size and forecast, by Type
- 8.5.6.3.2. Market size and forecast, by Application
- 8.5.6.3.3. Market size and forecast, by Voltage
- 8.5.6.3.4. Market size and forecast, by End User
- 8.5.6.4. Rest of LAMEA
- 8.5.6.4.1. Market size and forecast, by Type
- 8.5.6.4.2. Market size and forecast, by Application
- 8.5.6.4.3. Market size and forecast, by Voltage
- 8.5.6.4.4. Market size and forecast, by End User
CHAPTER 9: COMPETITIVE LANDSCAPE
- 9.1. Introduction
- 9.2. Top winning strategies
- 9.3. Product mapping of top 10 player
- 9.4. Competitive dashboard
- 9.5. Competitive heatmap
- 9.6. Top player positioning, 2022
CHAPTER 10: COMPANY PROFILES
- 10.1. Siemens Energy
- 10.1.1. Company overview
- 10.1.2. Key executives
- 10.1.3. Company snapshot
- 10.1.4. Operating business segments
- 10.1.5. Product portfolio
- 10.1.6. Business performance
- 10.1.7. Key strategic moves and developments
- 10.2. Hitachi
- 10.2.1. Company overview
- 10.2.2. Key executives
- 10.2.3. Company snapshot
- 10.2.4. Operating business segments
- 10.2.5. Product portfolio
- 10.2.6. Business performance
- 10.2.7. Key strategic moves and developments
- 10.3. Raychem RPG Private Limited.
- 10.3.1. Company overview
- 10.3.2. Key executives
- 10.3.3. Company snapshot
- 10.3.4. Operating business segments
- 10.3.5. Product portfolio
- 10.3.6. Business performance
- 10.3.7. Key strategic moves and developments
- 10.4. TOSHIBA CORPORATION
- 10.4.1. Company overview
- 10.4.2. Key executives
- 10.4.3. Company snapshot
- 10.4.4. Operating business segments
- 10.4.5. Product portfolio
- 10.4.6. Business performance
- 10.4.7. Key strategic moves and developments
- 10.5. MAPPEC
- 10.5.1. Company overview
- 10.5.2. Key executives
- 10.5.3. Company snapshot
- 10.5.4. Operating business segments
- 10.5.5. Product portfolio
- 10.5.6. Business performance
- 10.5.7. Key strategic moves and developments
- 10.6. Tridelta Meidensha GmbH
- 10.6.1. Company overview
- 10.6.2. Key executives
- 10.6.3. Company snapshot
- 10.6.4. Operating business segments
- 10.6.5. Product portfolio
- 10.6.6. Business performance
- 10.6.7. Key strategic moves and developments
- 10.7. Hubbell Inc.
- 10.7.1. Company overview
- 10.7.2. Key executives
- 10.7.3. Company snapshot
- 10.7.4. Operating business segments
- 10.7.5. Product portfolio
- 10.7.6. Business performance
- 10.7.7. Key strategic moves and developments
- 10.8. TE Connectivity
- 10.8.1. Company overview
- 10.8.2. Key executives
- 10.8.3. Company snapshot
- 10.8.4. Operating business segments
- 10.8.5. Product portfolio
- 10.8.6. Business performance
- 10.8.7. Key strategic moves and developments
- 10.9. Elmac Technologies
- 10.9.1. Company overview
- 10.9.2. Key executives
- 10.9.3. Company snapshot
- 10.9.4. Operating business segments
- 10.9.5. Product portfolio
- 10.9.6. Business performance
- 10.9.7. Key strategic moves and developments
- 10.10. KA Factor Group Inc..
- 10.10.1. Company overview
- 10.10.2. Key executives
- 10.10.3. Company snapshot
- 10.10.4. Operating business segments
- 10.10.5. Product portfolio
- 10.10.6. Business performance
- 10.10.7. Key strategic moves and developments
- 10.11. MacLean Power Systems.
- 10.11.1. Company overview
- 10.11.2. Key executives
- 10.11.3. Company snapshot
- 10.11.4. Operating business segments
- 10.11.5. Product portfolio
- 10.11.6. Business performance
- 10.11.7. Key strategic moves and developments
LIST OF TABLES
- TABLE 01. GLOBAL LINE ARRESTERS MARKET, BY TYPE, 2022-2032 ($THOUSAND)
- TABLE 02. LINE ARRESTERS MARKET FOR NON GAPPED LINE ARRESTER, BY REGION, 2022-2032 ($THOUSAND)
- TABLE 03. LINE ARRESTERS MARKET FOR EXTERNALLY GAPPED LINE ARRESTER, BY REGION, 2022-2032 ($THOUSAND)
- TABLE 04. GLOBAL LINE ARRESTERS MARKET, BY APPLICATION, 2022-2032 ($THOUSAND)
- TABLE 05. LINE ARRESTERS MARKET FOR TRANSMISSION LINE, BY REGION, 2022-2032 ($THOUSAND)
- TABLE 06. LINE ARRESTERS MARKET FOR DISTRIBUTION LINE, BY REGION, 2022-2032 ($THOUSAND)
- TABLE 07. GLOBAL LINE ARRESTERS MARKET, BY VOLTAGE, 2022-2032 ($THOUSAND)
- TABLE 08. LINE ARRESTERS MARKET FOR MEDIUM, BY REGION, 2022-2032 ($THOUSAND)
- TABLE 09. LINE ARRESTERS MARKET FOR HIGH, BY REGION, 2022-2032 ($THOUSAND)
- TABLE 10. LINE ARRESTERS MARKET FOR LOW, BY REGION, 2022-2032 ($THOUSAND)
- TABLE 11. GLOBAL LINE ARRESTERS MARKET, BY END USER, 2022-2032 ($THOUSAND)
- TABLE 12. LINE ARRESTERS MARKET FOR POWER SUBSTATIONS, BY REGION, 2022-2032 ($THOUSAND)
- TABLE 13. LINE ARRESTERS MARKET FOR TELECOMMUNICATIONS, BY REGION, 2022-2032 ($THOUSAND)
- TABLE 14. LINE ARRESTERS MARKET FOR OTHERS, BY REGION, 2022-2032 ($THOUSAND)
- TABLE 15. LINE ARRESTERS MARKET, BY REGION, 2022-2032 ($THOUSAND)
- TABLE 16. NORTH AMERICA LINE ARRESTERS MARKET, BY TYPE, 2022-2032 ($THOUSAND)
- TABLE 17. NORTH AMERICA LINE ARRESTERS MARKET, BY APPLICATION, 2022-2032 ($THOUSAND)
- TABLE 18. NORTH AMERICA LINE ARRESTERS MARKET, BY VOLTAGE, 2022-2032 ($THOUSAND)
- TABLE 19. NORTH AMERICA LINE ARRESTERS MARKET, BY END USER, 2022-2032 ($THOUSAND)
- TABLE 20. NORTH AMERICA LINE ARRESTERS MARKET, BY COUNTRY, 2022-2032 ($THOUSAND)
- TABLE 21. U.S. LINE ARRESTERS MARKET, BY TYPE, 2022-2032 ($THOUSAND)
- TABLE 22. U.S. LINE ARRESTERS MARKET, BY APPLICATION, 2022-2032 ($THOUSAND)
- TABLE 23. U.S. LINE ARRESTERS MARKET, BY VOLTAGE, 2022-2032 ($THOUSAND)
- TABLE 24. U.S. LINE ARRESTERS MARKET, BY END USER, 2022-2032 ($THOUSAND)
- TABLE 25. CANADA LINE ARRESTERS MARKET, BY TYPE, 2022-2032 ($THOUSAND)
- TABLE 26. CANADA LINE ARRESTERS MARKET, BY APPLICATION, 2022-2032 ($THOUSAND)
- TABLE 27. CANADA LINE ARRESTERS MARKET, BY VOLTAGE, 2022-2032 ($THOUSAND)
- TABLE 28. CANADA LINE ARRESTERS MARKET, BY END USER, 2022-2032 ($THOUSAND)
- TABLE 29. MEXICO LINE ARRESTERS MARKET, BY TYPE, 2022-2032 ($THOUSAND)
- TABLE 30. MEXICO LINE ARRESTERS MARKET, BY APPLICATION, 2022-2032 ($THOUSAND)
- TABLE 31. MEXICO LINE ARRESTERS MARKET, BY VOLTAGE, 2022-2032 ($THOUSAND)
- TABLE 32. MEXICO LINE ARRESTERS MARKET, BY END USER, 2022-2032 ($THOUSAND)
- TABLE 33. EUROPE LINE ARRESTERS MARKET, BY TYPE, 2022-2032 ($THOUSAND)
- TABLE 34. EUROPE LINE ARRESTERS MARKET, BY APPLICATION, 2022-2032 ($THOUSAND)
- TABLE 35. EUROPE LINE ARRESTERS MARKET, BY VOLTAGE, 2022-2032 ($THOUSAND)
- TABLE 36. EUROPE LINE ARRESTERS MARKET, BY END USER, 2022-2032 ($THOUSAND)
- TABLE 37. EUROPE LINE ARRESTERS MARKET, BY COUNTRY, 2022-2032 ($THOUSAND)
- TABLE 38. GERMANY LINE ARRESTERS MARKET, BY TYPE, 2022-2032 ($THOUSAND)
- TABLE 39. GERMANY LINE ARRESTERS MARKET, BY APPLICATION, 2022-2032 ($THOUSAND)
- TABLE 40. GERMANY LINE ARRESTERS MARKET, BY VOLTAGE, 2022-2032 ($THOUSAND)
- TABLE 41. GERMANY LINE ARRESTERS MARKET, BY END USER, 2022-2032 ($THOUSAND)
- TABLE 42. ITALY LINE ARRESTERS MARKET, BY TYPE, 2022-2032 ($THOUSAND)
- TABLE 43. ITALY LINE ARRESTERS MARKET, BY APPLICATION, 2022-2032 ($THOUSAND)
- TABLE 44. ITALY LINE ARRESTERS MARKET, BY VOLTAGE, 2022-2032 ($THOUSAND)
- TABLE 45. ITALY LINE ARRESTERS MARKET, BY END USER, 2022-2032 ($THOUSAND)
- TABLE 46. UK LINE ARRESTERS MARKET, BY TYPE, 2022-2032 ($THOUSAND)
- TABLE 47. UK LINE ARRESTERS MARKET, BY APPLICATION, 2022-2032 ($THOUSAND)
- TABLE 48. UK LINE ARRESTERS MARKET, BY VOLTAGE, 2022-2032 ($THOUSAND)
- TABLE 49. UK LINE ARRESTERS MARKET, BY END USER, 2022-2032 ($THOUSAND)
- TABLE 50. SPAIN LINE ARRESTERS MARKET, BY TYPE, 2022-2032 ($THOUSAND)
- TABLE 51. SPAIN LINE ARRESTERS MARKET, BY APPLICATION, 2022-2032 ($THOUSAND)
- TABLE 52. SPAIN LINE ARRESTERS MARKET, BY VOLTAGE, 2022-2032 ($THOUSAND)
- TABLE 53. SPAIN LINE ARRESTERS MARKET, BY END USER, 2022-2032 ($THOUSAND)
- TABLE 54. FRANCE LINE ARRESTERS MARKET, BY TYPE, 2022-2032 ($THOUSAND)
- TABLE 55. FRANCE LINE ARRESTERS MARKET, BY APPLICATION, 2022-2032 ($THOUSAND)
- TABLE 56. FRANCE LINE ARRESTERS MARKET, BY VOLTAGE, 2022-2032 ($THOUSAND)
- TABLE 57. FRANCE LINE ARRESTERS MARKET, BY END USER, 2022-2032 ($THOUSAND)
- TABLE 58. REST OF EUROPE LINE ARRESTERS MARKET, BY TYPE, 2022-2032 ($THOUSAND)
- TABLE 59. REST OF EUROPE LINE ARRESTERS MARKET, BY APPLICATION, 2022-2032 ($THOUSAND)
- TABLE 60. REST OF EUROPE LINE ARRESTERS MARKET, BY VOLTAGE, 2022-2032 ($THOUSAND)
- TABLE 61. REST OF EUROPE LINE ARRESTERS MARKET, BY END USER, 2022-2032 ($THOUSAND)
- TABLE 62. ASIA-PACIFIC LINE ARRESTERS MARKET, BY TYPE, 2022-2032 ($THOUSAND)
- TABLE 63. ASIA-PACIFIC LINE ARRESTERS MARKET, BY APPLICATION, 2022-2032 ($THOUSAND)
- TABLE 64. ASIA-PACIFIC LINE ARRESTERS MARKET, BY VOLTAGE, 2022-2032 ($THOUSAND)
- TABLE 65. ASIA-PACIFIC LINE ARRESTERS MARKET, BY END USER, 2022-2032 ($THOUSAND)
- TABLE 66. ASIA-PACIFIC LINE ARRESTERS MARKET, BY COUNTRY, 2022-2032 ($THOUSAND)
- TABLE 67. CHINA LINE ARRESTERS MARKET, BY TYPE, 2022-2032 ($THOUSAND)
- TABLE 68. CHINA LINE ARRESTERS MARKET, BY APPLICATION, 2022-2032 ($THOUSAND)
- TABLE 69. CHINA LINE ARRESTERS MARKET, BY VOLTAGE, 2022-2032 ($THOUSAND)
- TABLE 70. CHINA LINE ARRESTERS MARKET, BY END USER, 2022-2032 ($THOUSAND)
- TABLE 71. JAPAN LINE ARRESTERS MARKET, BY TYPE, 2022-2032 ($THOUSAND)
- TABLE 72. JAPAN LINE ARRESTERS MARKET, BY APPLICATION, 2022-2032 ($THOUSAND)
- TABLE 73. JAPAN LINE ARRESTERS MARKET, BY VOLTAGE, 2022-2032 ($THOUSAND)
- TABLE 74. JAPAN LINE ARRESTERS MARKET, BY END USER, 2022-2032 ($THOUSAND)
- TABLE 75. INDIA LINE ARRESTERS MARKET, BY TYPE, 2022-2032 ($THOUSAND)
- TABLE 76. INDIA LINE ARRESTERS MARKET, BY APPLICATION, 2022-2032 ($THOUSAND)
- TABLE 77. INDIA LINE ARRESTERS MARKET, BY VOLTAGE, 2022-2032 ($THOUSAND)
- TABLE 78. INDIA LINE ARRESTERS MARKET, BY END USER, 2022-2032 ($THOUSAND)
- TABLE 79. SOUTH KOREA LINE ARRESTERS MARKET, BY TYPE, 2022-2032 ($THOUSAND)
- TABLE 80. SOUTH KOREA LINE ARRESTERS MARKET, BY APPLICATION, 2022-2032 ($THOUSAND)
- TABLE 81. SOUTH KOREA LINE ARRESTERS MARKET, BY VOLTAGE, 2022-2032 ($THOUSAND)
- TABLE 82. SOUTH KOREA LINE ARRESTERS MARKET, BY END USER, 2022-2032 ($THOUSAND)
- TABLE 83. AUSTRALIA LINE ARRESTERS MARKET, BY TYPE, 2022-2032 ($THOUSAND)
- TABLE 84. AUSTRALIA LINE ARRESTERS MARKET, BY APPLICATION, 2022-2032 ($THOUSAND)
- TABLE 85. AUSTRALIA LINE ARRESTERS MARKET, BY VOLTAGE, 2022-2032 ($THOUSAND)
- TABLE 86. AUSTRALIA LINE ARRESTERS MARKET, BY END USER, 2022-2032 ($THOUSAND)
- TABLE 87. REST OF ASIA-PACIFIC LINE ARRESTERS MARKET, BY TYPE, 2022-2032 ($THOUSAND)
- TABLE 88. REST OF ASIA-PACIFIC LINE ARRESTERS MARKET, BY APPLICATION, 2022-2032 ($THOUSAND)
- TABLE 89. REST OF ASIA-PACIFIC LINE ARRESTERS MARKET, BY VOLTAGE, 2022-2032 ($THOUSAND)
- TABLE 90. REST OF ASIA-PACIFIC LINE ARRESTERS MARKET, BY END USER, 2022-2032 ($THOUSAND)
- TABLE 91. LAMEA LINE ARRESTERS MARKET, BY TYPE, 2022-2032 ($THOUSAND)
- TABLE 92. LAMEA LINE ARRESTERS MARKET, BY APPLICATION, 2022-2032 ($THOUSAND)
- TABLE 93. LAMEA LINE ARRESTERS MARKET, BY VOLTAGE, 2022-2032 ($THOUSAND)
- TABLE 94. LAMEA LINE ARRESTERS MARKET, BY END USER, 2022-2032 ($THOUSAND)
- TABLE 95. LAMEA LINE ARRESTERS MARKET, BY COUNTRY, 2022-2032 ($THOUSAND)
- TABLE 96. BRAZIL LINE ARRESTERS MARKET, BY TYPE, 2022-2032 ($THOUSAND)
- TABLE 97. BRAZIL LINE ARRESTERS MARKET, BY APPLICATION, 2022-2032 ($THOUSAND)
- TABLE 98. BRAZIL LINE ARRESTERS MARKET, BY VOLTAGE, 2022-2032 ($THOUSAND)
- TABLE 99. BRAZIL LINE ARRESTERS MARKET, BY END USER, 2022-2032 ($THOUSAND)
- TABLE 100. SOUTH AFRICA LINE ARRESTERS MARKET, BY TYPE, 2022-2032 ($THOUSAND)
- TABLE 101. SOUTH AFRICA LINE ARRESTERS MARKET, BY APPLICATION, 2022-2032 ($THOUSAND)
- TABLE 102. SOUTH AFRICA LINE ARRESTERS MARKET, BY VOLTAGE, 2022-2032 ($THOUSAND)
- TABLE 103. SOUTH AFRICA LINE ARRESTERS MARKET, BY END USER, 2022-2032 ($THOUSAND)
- TABLE 104. SAUDI ARABIA LINE ARRESTERS MARKET, BY TYPE, 2022-2032 ($THOUSAND)
- TABLE 105. SAUDI ARABIA LINE ARRESTERS MARKET, BY APPLICATION, 2022-2032 ($THOUSAND)
- TABLE 106. SAUDI ARABIA LINE ARRESTERS MARKET, BY VOLTAGE, 2022-2032 ($THOUSAND)
- TABLE 107. SAUDI ARABIA LINE ARRESTERS MARKET, BY END USER, 2022-2032 ($THOUSAND)
- TABLE 108. REST OF LAMEA LINE ARRESTERS MARKET, BY TYPE, 2022-2032 ($THOUSAND)
- TABLE 109. REST OF LAMEA LINE ARRESTERS MARKET, BY APPLICATION, 2022-2032 ($THOUSAND)
- TABLE 110. REST OF LAMEA LINE ARRESTERS MARKET, BY VOLTAGE, 2022-2032 ($THOUSAND)
- TABLE 111. REST OF LAMEA LINE ARRESTERS MARKET, BY END USER, 2022-2032 ($THOUSAND)
- TABLE 112. SIEMENS ENERGY: KEY EXECUTIVES
- TABLE 113. SIEMENS ENERGY: COMPANY SNAPSHOT
- TABLE 114. SIEMENS ENERGY: PRODUCT SEGMENTS
- TABLE 115. SIEMENS ENERGY: SERVICE SEGMENTS
- TABLE 116. SIEMENS ENERGY: PRODUCT PORTFOLIO
- TABLE 117. SIEMENS ENERGY: KEY STRATERGIES
- TABLE 118. HITACHI: KEY EXECUTIVES
- TABLE 119. HITACHI: COMPANY SNAPSHOT
- TABLE 120. HITACHI: PRODUCT SEGMENTS
- TABLE 121. HITACHI: SERVICE SEGMENTS
- TABLE 122. HITACHI: PRODUCT PORTFOLIO
- TABLE 123. HITACHI: KEY STRATERGIES
- TABLE 124. RAYCHEM RPG PRIVATE LIMITED.: KEY EXECUTIVES
- TABLE 125. RAYCHEM RPG PRIVATE LIMITED.: COMPANY SNAPSHOT
- TABLE 126. RAYCHEM RPG PRIVATE LIMITED.: PRODUCT SEGMENTS
- TABLE 127. RAYCHEM RPG PRIVATE LIMITED.: SERVICE SEGMENTS
- TABLE 128. RAYCHEM RPG PRIVATE LIMITED.: PRODUCT PORTFOLIO
- TABLE 129. RAYCHEM RPG PRIVATE LIMITED.: KEY STRATERGIES
- TABLE 130. TOSHIBA CORPORATION: KEY EXECUTIVES
- TABLE 131. TOSHIBA CORPORATION: COMPANY SNAPSHOT
- TABLE 132. TOSHIBA CORPORATION: PRODUCT SEGMENTS
- TABLE 133. TOSHIBA CORPORATION: SERVICE SEGMENTS
- TABLE 134. TOSHIBA CORPORATION: PRODUCT PORTFOLIO
- TABLE 135. TOSHIBA CORPORATION: KEY STRATERGIES
- TABLE 136. MAPPEC: KEY EXECUTIVES
- TABLE 137. MAPPEC: COMPANY SNAPSHOT
- TABLE 138. MAPPEC: PRODUCT SEGMENTS
- TABLE 139. MAPPEC: SERVICE SEGMENTS
- TABLE 140. MAPPEC: PRODUCT PORTFOLIO
- TABLE 141. MAPPEC: KEY STRATERGIES
- TABLE 142. TRIDELTA MEIDENSHA GMBH: KEY EXECUTIVES
- TABLE 143. TRIDELTA MEIDENSHA GMBH: COMPANY SNAPSHOT
- TABLE 144. TRIDELTA MEIDENSHA GMBH: PRODUCT SEGMENTS
- TABLE 145. TRIDELTA MEIDENSHA GMBH: SERVICE SEGMENTS
- TABLE 146. TRIDELTA MEIDENSHA GMBH: PRODUCT PORTFOLIO
- TABLE 147. TRIDELTA MEIDENSHA GMBH: KEY STRATERGIES
- TABLE 148. HUBBELL INC.: KEY EXECUTIVES
- TABLE 149. HUBBELL INC.: COMPANY SNAPSHOT
- TABLE 150. HUBBELL INC.: PRODUCT SEGMENTS
- TABLE 151. HUBBELL INC.: SERVICE SEGMENTS
- TABLE 152. HUBBELL INC.: PRODUCT PORTFOLIO
- TABLE 153. HUBBELL INC.: KEY STRATERGIES
- TABLE 154. TE CONNECTIVITY: KEY EXECUTIVES
- TABLE 155. TE CONNECTIVITY: COMPANY SNAPSHOT
- TABLE 156. TE CONNECTIVITY: PRODUCT SEGMENTS
- TABLE 157. TE CONNECTIVITY: SERVICE SEGMENTS
- TABLE 158. TE CONNECTIVITY: PRODUCT PORTFOLIO
- TABLE 159. TE CONNECTIVITY: KEY STRATERGIES
- TABLE 160. ELMAC TECHNOLOGIES: KEY EXECUTIVES
- TABLE 161. ELMAC TECHNOLOGIES: COMPANY SNAPSHOT
- TABLE 162. ELMAC TECHNOLOGIES: PRODUCT SEGMENTS
- TABLE 163. ELMAC TECHNOLOGIES: SERVICE SEGMENTS
- TABLE 164. ELMAC TECHNOLOGIES: PRODUCT PORTFOLIO
- TABLE 165. ELMAC TECHNOLOGIES: KEY STRATERGIES
- TABLE 166. KA FACTOR GROUP INC..: KEY EXECUTIVES
- TABLE 167. KA FACTOR GROUP INC..: COMPANY SNAPSHOT
- TABLE 168. KA FACTOR GROUP INC..: PRODUCT SEGMENTS
- TABLE 169. KA FACTOR GROUP INC..: SERVICE SEGMENTS
- TABLE 170. KA FACTOR GROUP INC..: PRODUCT PORTFOLIO
- TABLE 171. KA FACTOR GROUP INC..: KEY STRATERGIES
- TABLE 172. MACLEAN POWER SYSTEMS.: KEY EXECUTIVES
- TABLE 173. MACLEAN POWER SYSTEMS.: COMPANY SNAPSHOT
- TABLE 174. MACLEAN POWER SYSTEMS.: PRODUCT SEGMENTS
- TABLE 175. MACLEAN POWER SYSTEMS.: SERVICE SEGMENTS
- TABLE 176. MACLEAN POWER SYSTEMS.: PRODUCT PORTFOLIO
- TABLE 177. MACLEAN POWER SYSTEMS.: KEY STRATERGIES
LIST OF FIGURES
- FIGURE 01. LINE ARRESTERS MARKET, 2022-2032
- FIGURE 02. SEGMENTATION OF LINE ARRESTERS MARKET,2022-2032
- FIGURE 03. TOP IMPACTING FACTORS IN LINE ARRESTERS MARKET
- FIGURE 04. TOP INVESTMENT POCKETS IN LINE ARRESTERS MARKET (2023-2032)
- FIGURE 05. BARGAINING POWER OF SUPPLIERS
- FIGURE 06. BARGAINING POWER OF BUYERS
- FIGURE 07. THREAT OF SUBSTITUTION
- FIGURE 08. THREAT OF SUBSTITUTION
- FIGURE 09. COMPETITIVE RIVALRY
- FIGURE 10. GLOBAL LINE ARRESTERS MARKET:DRIVERS, RESTRAINTS AND OPPORTUNITIES
- FIGURE 11. IMPACT OF KEY REGULATION: LINE ARRESTERS MARKET
- FIGURE 12. LINE ARRESTERS MARKET, BY TYPE, 2022 AND 2032(%)
- FIGURE 13. COMPARATIVE SHARE ANALYSIS OF LINE ARRESTERS MARKET FOR NON GAPPED LINE ARRESTER, BY COUNTRY 2022 AND 2032(%)
- FIGURE 14. COMPARATIVE SHARE ANALYSIS OF LINE ARRESTERS MARKET FOR EXTERNALLY GAPPED LINE ARRESTER, BY COUNTRY 2022 AND 2032(%)
- FIGURE 15. LINE ARRESTERS MARKET, BY APPLICATION, 2022 AND 2032(%)
- FIGURE 16. COMPARATIVE SHARE ANALYSIS OF LINE ARRESTERS MARKET FOR TRANSMISSION LINE, BY COUNTRY 2022 AND 2032(%)
- FIGURE 17. COMPARATIVE SHARE ANALYSIS OF LINE ARRESTERS MARKET FOR DISTRIBUTION LINE, BY COUNTRY 2022 AND 2032(%)
- FIGURE 18. LINE ARRESTERS MARKET, BY VOLTAGE, 2022 AND 2032(%)
- FIGURE 19. COMPARATIVE SHARE ANALYSIS OF LINE ARRESTERS MARKET FOR MEDIUM, BY COUNTRY 2022 AND 2032(%)
- FIGURE 20. COMPARATIVE SHARE ANALYSIS OF LINE ARRESTERS MARKET FOR HIGH, BY COUNTRY 2022 AND 2032(%)
- FIGURE 21. COMPARATIVE SHARE ANALYSIS OF LINE ARRESTERS MARKET FOR LOW, BY COUNTRY 2022 AND 2032(%)
- FIGURE 22. LINE ARRESTERS MARKET, BY END USER, 2022 AND 2032(%)
- FIGURE 23. COMPARATIVE SHARE ANALYSIS OF LINE ARRESTERS MARKET FOR POWER SUBSTATIONS, BY COUNTRY 2022 AND 2032(%)
- FIGURE 24. COMPARATIVE SHARE ANALYSIS OF LINE ARRESTERS MARKET FOR TELECOMMUNICATIONS, BY COUNTRY 2022 AND 2032(%)
- FIGURE 25. COMPARATIVE SHARE ANALYSIS OF LINE ARRESTERS MARKET FOR OTHERS, BY COUNTRY 2022 AND 2032(%)
- FIGURE 26. LINE ARRESTERS MARKET BY REGION, 2022 AND 2032(%)
- FIGURE 27. U.S. LINE ARRESTERS MARKET, 2022-2032 ($THOUSAND)
- FIGURE 28. CANADA LINE ARRESTERS MARKET, 2022-2032 ($THOUSAND)
- FIGURE 29. MEXICO LINE ARRESTERS MARKET, 2022-2032 ($THOUSAND)
- FIGURE 30. GERMANY LINE ARRESTERS MARKET, 2022-2032 ($THOUSAND)
- FIGURE 31. ITALY LINE ARRESTERS MARKET, 2022-2032 ($THOUSAND)
- FIGURE 32. UK LINE ARRESTERS MARKET, 2022-2032 ($THOUSAND)
- FIGURE 33. SPAIN LINE ARRESTERS MARKET, 2022-2032 ($THOUSAND)
- FIGURE 34. FRANCE LINE ARRESTERS MARKET, 2022-2032 ($THOUSAND)
- FIGURE 35. REST OF EUROPE LINE ARRESTERS MARKET, 2022-2032 ($THOUSAND)
- FIGURE 36. CHINA LINE ARRESTERS MARKET, 2022-2032 ($THOUSAND)
- FIGURE 37. JAPAN LINE ARRESTERS MARKET, 2022-2032 ($THOUSAND)
- FIGURE 38. INDIA LINE ARRESTERS MARKET, 2022-2032 ($THOUSAND)
- FIGURE 39. SOUTH KOREA LINE ARRESTERS MARKET, 2022-2032 ($THOUSAND)
- FIGURE 40. AUSTRALIA LINE ARRESTERS MARKET, 2022-2032 ($THOUSAND)
- FIGURE 41. REST OF ASIA-PACIFIC LINE ARRESTERS MARKET, 2022-2032 ($THOUSAND)
- FIGURE 42. BRAZIL LINE ARRESTERS MARKET, 2022-2032 ($THOUSAND)
- FIGURE 43. SOUTH AFRICA LINE ARRESTERS MARKET, 2022-2032 ($THOUSAND)
- FIGURE 44. SAUDI ARABIA LINE ARRESTERS MARKET, 2022-2032 ($THOUSAND)
- FIGURE 45. REST OF LAMEA LINE ARRESTERS MARKET, 2022-2032 ($THOUSAND)
- FIGURE 46. TOP WINNING STRATEGIES, BY YEAR
- FIGURE 47. TOP WINNING STRATEGIES, BY DEVELOPMENT
- FIGURE 48. TOP WINNING STRATEGIES, BY COMPANY
- FIGURE 49. PRODUCT MAPPING OF TOP 10 PLAYERS
- FIGURE 50. COMPETITIVE DASHBOARD
- FIGURE 51. COMPETITIVE HEATMAP: LINE ARRESTERS MARKET
- FIGURE 52. TOP PLAYER POSITIONING, 2022


