


 |
市場調查報告書
商品編碼
1472219
乳製品培養市場:按最終用戶、發酵類型、按類型:全球機會分析和產業預測,2023-2032 年Dairy Cultures Market By End User (Cheese, Yogurt, Kefir, Others), By Fermentation Type (Lactic Acid, Yeast-Lactic Acid, Fungus-Lactic Acid), By Type (Mesophilic, Thermophilic ): Global Opportunity Analysis and Industry Forecast, 2023-2032 |
||||||
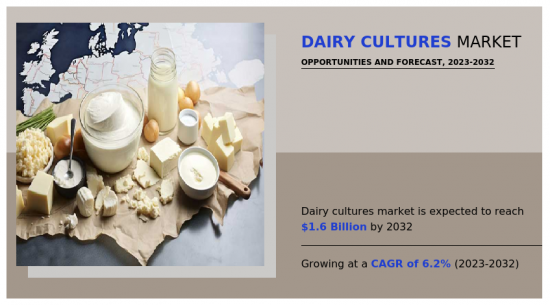
2022年,全球乳製品培養物市場價值將達到8億美元,預計2023年至2032年複合年成長率為6.2%,到2032年將達到14億美元。
乳製品培養物是指有意引入牛奶或乳製品中進行發酵的特定微生物,例如細菌或真菌。這些菌種在優格和乳酪等各種發酵乳製品的生產中發揮重要作用。這些培養物中的微生物有助於在發酵過程中形成所需的風味、質地和營養特性。
在幾個關鍵趨勢和因素的推動下,亞太地區的食品和飲料產業有望大幅擴張。到 2024 年,該地區預計將出現一系列發展,從而提升其在全球餐飲領域的地位。這些趨勢包括植物來源範圍的擴大,反映了該行業對植物來源產品不斷成長的需求的反應。這種變化不僅是由具有健康意識的消費者推動的,也是由對永續性和環境問題的意識增強所推動的。
亞太地區食品和飲料產業正在採用創新方法來滿足不斷變化的消費者偏好。將食品加工技術的進步與對創造獨特而正宗的烹飪體驗的關注相結合,有助於該行業的擴張。此外,成長不僅限於傳統食品,還擴展到食品塗料等新領域,由於快餐店 (QSR) 的快速成長和商業領域的採用率增加,這些領域正在顯著擴張。
監管環境是乳製品市場的主要限制因素,要求嚴格遵守行業標準和政府法規。該法規包括有關食品安全、品管和標籤的複雜規則,乳製品企業必須遵守這些規則,以確保其產品的生產合法且合乎道德。
遵守這些法規通常需要仔細保存記錄、嚴格的測試通訊協定並遵守特定的處理方法。這些要求可能會導致酪農投資技術和製程以滿足監管標準,從而導致營運成本增加。例如,對病原體和污染物進行嚴格測試的需要增加了生產過程的複雜性並導致成本更高。
此外,法規不斷發展,因此乳製品生產商必須不斷監控和適應。法律規章的變化或新標準的引入可能需要對現有做法進行調整,從而進一步加劇資源緊張並減緩生產。
乳製品的國際貿易尤其受到監管合規性的影響,因為標準因地區而異。對於參與國際貿易的公司來說,應對這些不同的法律規範又增加了一層複雜性。
儘管監管合規對於確保消費者安全和產品品質至關重要,但相關挑戰正在限制乳製品市場。克服這些障礙需要採取積極主動的方法,確保公司及時了解監管變化,做出必要的調整,並證明他們對乳製品培養品質和安全最高標準的承諾。
乳製品市場按發酵類型、類型、最終用戶和地區進行細分。依發酵類型,市場分為乳酸、酵母乳酸和黴菌乳酸。按類型分類,市場分為中性粒細胞和嗜熱細胞。依最終用戶分類,市場分為起司、優格、Kefir等。依地區分類,市場分為北美、歐洲、亞太地區、拉丁美洲、中東和非洲。
相關人員的主要利益
- 該報告定量分析了 2022 年至 2032 年乳製品市場的細分市場、當前趨勢、估計/趨勢分析和動態,並確定了乳製品市場有前景的市場機會。
- 我們提供市場研究以及與市場促進因素、市場限制和市場機會相關的資訊。
- 波特的五力分析揭示了買家和供應商的潛力,幫助相關人員做出利潤驅動的業務決策並加強供應商和買家網路。
- 對乳製品培養物市場細分的詳細分析將有助於確定市場機會。
- 每個地區的主要國家都根據其對全球市場的收益貢獻繪製了地圖。
- 市場參與者定位有助於基準化分析,並提供對市場參與者當前地位的清晰了解。
- 該報告包括對區域和全球乳製品培養物市場趨勢、主要企業、細分市場、應用領域和市場成長策略的分析。
可以使用此報告進行客製化(請聯絡銷售人員以了解額外費用和時間表)
- 工業生命週期評估:按地區
- 監管指引
- 根據客戶興趣加入公司簡介
- 按國家或地區進行的附加分析 – 市場規模和預測
- 十字交叉細分市場分析—市場規模與預測
- 公司簡介的擴充列表
- 歷史市場資料
目錄
第1章簡介
第 2 章執行摘要
第3章市場概況
- 市場定義和範圍
- 主要發現
- 主要影響因素
- 關鍵投資機會
- 波特五力分析
- 市場動態
- 促進因素
- 抑制因素
- 機會
第4章 乳製品市場:依最終用戶分類
- 概述
- 起司
- 優格
- Kefir
- 其他
第5章 乳製品市場:依發酵類型
- 概述
- 乳酸
- 酵母-乳酸
- 真菌乳酸
第6章 乳製品市場:依類型
- 概述
- 中氧
- 嗜熱的
第7章 乳製品市場:依地區
- 概述
- 北美洲
- 美國
- 加拿大
- 墨西哥
- 歐洲
- 英國
- 德國
- 法國
- 義大利
- 西班牙
- 其他歐洲國家
- 亞太地區
- 中國
- 日本
- 印度
- 韓國
- 澳洲
- 其他亞太地區
- 拉丁美洲
- 巴西
- 阿根廷
- 其他拉丁美洲
- 中東/非洲
- 沙烏地阿拉伯
- 南非
- 其他中東/非洲
第8章 競爭格局
- 介紹
- 關鍵成功策略
- 10家主要企業產品圖譜
- 競爭對手儀表板
- 競爭熱圖
- 2022年主要企業定位
第9章 公司簡介
- Arla Foods Amba
- Fonterra Co-operative Group Limited
- Saputo Inc.
- Grupo Lala
- Dean Foods Company
- Clover SA Proprietary Limited
- SanCor
- foremost farms usa
- Amul
- Hatsun Agro Product Ltd
The global dairy cultures market was valued at $0.8 billion in 2022, and is projected to reach $1.4 billion by 2032, growing at a CAGR of 6.2% from 2023 to 2032.
Dairy cultures refer to specific microorganisms, such as bacteria or fungi, deliberately introduced into milk or dairy products for fermentation. These cultures play a crucial role in the production of various cultured dairy products like yogurt and cheese. The microorganisms in these cultures contribute to the development of desirable flavors, textures, and nutritional properties during the fermentation process.
The food and beverage industry in Asia-Pacific is poised for significant expansion, driven by several key trends and factors. In 2024, the region anticipates a slew of developments that will heighten its position in the global F&B landscape. These trends include a broadening of the plant-based horizon, reflecting the industry's response to the increasing demand for plant-based products. This shift is not only driven by health-conscious consumers but also by a growing awareness of sustainability and environmental concerns.
The Asia-Pacific food and beverage industry is embracing innovative approaches to cater to evolving consumer preferences. The incorporation of technological advancements in food processing, coupled with a focus on creating unique and authentic culinary experiences, contributes to the industry's expansion. Furthermore, the growth is not limited to traditional food offerings but extends to new segments, such as food coatings, witnessing considerable expansion due to the rapid growth of Quick-Service Restaurants (QSRs) and increased adoption in the commercial sector.
The regulatory landscape poses a significant restraint on the dairy culture market, demanding stringent compliance with industry standards and governmental regulations. This restraint encompasses a complex web of rules related to food safety, quality control, and labeling, which dairy businesses must navigate to ensure the legal and ethical production of their products.
Compliance with these regulations often involves meticulous record-keeping, stringent testing protocols, and adherence to specific processing methods. These requirements can lead to increased operational costs for dairy culture producers as they invest in technology and processes to meet the regulatory criteria. For instance, the need for rigorous testing for pathogens and contaminants adds an additional layer of complexity to the production process, contributing to elevated costs.
Moreover, the ever-evolving nature of regulations necessitates constant monitoring and adaptation by dairy culture manufacturers. Changes in legislation or the introduction of new standards can require adjustments to existing practices, further straining resources and potentially slowing down production.
International trade in dairy culture products is particularly impacted by regulatory compliance, with varying standards across different regions. Navigating these diverse regulatory frameworks adds another layer of complexity for businesses involved in global trade.
While regulatory compliance is crucial for ensuring consumer safety and product quality, the associated challenges act as a restraint on the dairy culture market. Overcoming these hurdles requires a proactive approach, with businesses dedicating resources to stay abreast of regulatory changes, implement necessary adjustments, and maintain a commitment to the highest standards of quality and safety in their dairy culture products.
The dairy culture market is segmented on the basis of fermentation type, type, end user, and region. On the basis of fermentation type, the market is classified into lactic acid, yeast-lactic acid, and fungus-lactic acid. On the basis of type, the market is classified into mesophilic and thermophilic. As per end user, the market is divided into cheese, yogurt, kefir, and others. Region wise, the market is subdivided into North America, Europe, Asia-Pacific, Latin America, and Middle East & Africa.
The players operating in the global market have adopted various developmental strategies to increase their market share, gain profitability, and remain competitive in the market. The key players included in the dairy culture market analysis are Fonterra Co-operative Group Limited, Danone SA, Nestle S.A., Arla Foods amba, Saputo Inc., Yili Group, Inner Mongolia Yili Industrial Group Co., Ltd., Lactalis Group, Mengniu Dairy Company Limited, Dean Foods Company, Royal Friesland Campina N.V., Kraft Heinz Company, Land O'Lakes, Inc., Sodiaal Cooperative, and Schreiber Foods, Inc.
Key Benefits For Stakeholders
- This report provides a quantitative analysis of the market segments, current trends, estimations, and dynamics of the dairy cultures market analysis from 2022 to 2032 to identify the prevailing dairy cultures market opportunities.
- The market research is offered along with information related to key drivers, restraints, and opportunities.
- Porter's five forces analysis highlights the potency of buyers and suppliers to enable stakeholders make profit-oriented business decisions and strengthen their supplier-buyer network.
- In-depth analysis of the dairy cultures market segmentation assists to determine the prevailing market opportunities.
- Major countries in each region are mapped according to their revenue contribution to the global market.
- Market player positioning facilitates benchmarking and provides a clear understanding of the present position of the market players.
- The report includes the analysis of the regional as well as global dairy cultures market trends, key players, market segments, application areas, and market growth strategies.
Additional benefits you will get with this purchase are:
- Quarterly Update and* (only available with a corporate license, on listed price)
- 5 additional Company Profile of client Choice pre- or Post-purchase, as a free update.
- Free Upcoming Version on the Purchase of Five and Enterprise User License.
- 16 analyst hours of support* (post-purchase, if you find additional data requirements upon review of the report, you may receive support amounting to 16 analyst hours to solve questions, and post-sale queries)
- 15% Free Customization* (in case the scope or segment of the report does not match your requirements, 15% is equivalent to 3 working days of free work, applicable once)
- Free data Pack on the Five and Enterprise User License. (Excel version of the report)
- Free Updated report if the report is 6-12 months old or older.
- 24-hour priority response*
- Free Industry updates and white papers.
Possible Customization with this report (with additional cost and timeline, please talk to the sales executive to know more)
- Industry life cycle assessment, by region
- Regulatory Guidelines
- Additional company profiles with specific to client's interest
- Additional country or region analysis- market size and forecast
- Criss-cross segment analysis- market size and forecast
- Expanded list for Company Profiles
- Historic market data
Key Market Segments
By End User
- Cheese
- Yogurt
- Kefir
- Others
By Fermentation Type
- Yeast-Lactic Acid
- Fungus-Lactic Acid
- Lactic Acid
By Type
- Mesophilic
- Thermophilic
By Region
- North America
- U.S.
- Canada
- Mexico
- Europe
- UK
- Germany
- France
- Italy
- Spain
- Rest of Europe
- Asia-Pacific
- China
- Japan
- India
- South Korea
- Australia
- Rest of Asia-Pacific
- Latin America
- Brazil
- Argentina
- Rest Of Middle East
- Middle East and Africa
- Saudi Arabia
- South Africa
- Rest of Middle East And Africa
Key Market Players:
- Arla Foods Amba
- Fonterra Co-operative Group Limited
- Saputo Inc.
- Grupo Lala
- Dean Foods Company
- Clover S.A. Proprietary Limited
- SanCor
- foremost farms usa
- Amul
- Hatsun Agro Product Ltd
TABLE OF CONTENTS
CHAPTER 1: INTRODUCTION
- 1.1. Report description
- 1.2. Key market segments
- 1.3. Key benefits to the stakeholders
- 1.4. Research methodology
- 1.4.1. Primary research
- 1.4.2. Secondary research
- 1.4.3. Analyst tools and models
CHAPTER 2: EXECUTIVE SUMMARY
- 2.1. CXO perspective
CHAPTER 3: MARKET OVERVIEW
- 3.1. Market definition and scope
- 3.2. Key findings
- 3.2.1. Top impacting factors
- 3.2.2. Top investment pockets
- 3.3. Porter's five forces analysis
- 3.4. Market dynamics
- 3.4.1. Drivers
- 3.4.2. Restraints
- 3.4.3. Opportunities
CHAPTER 4: DAIRY CULTURES MARKET, BY END USER
- 4.1. Overview
- 4.1.1. Market size and forecast
- 4.2. Cheese
- 4.2.1. Key market trends, growth factors and opportunities
- 4.2.2. Market size and forecast, by region
- 4.2.3. Market share analysis by country
- 4.3. Yogurt
- 4.3.1. Key market trends, growth factors and opportunities
- 4.3.2. Market size and forecast, by region
- 4.3.3. Market share analysis by country
- 4.4. Kefir
- 4.4.1. Key market trends, growth factors and opportunities
- 4.4.2. Market size and forecast, by region
- 4.4.3. Market share analysis by country
- 4.5. Others
- 4.5.1. Key market trends, growth factors and opportunities
- 4.5.2. Market size and forecast, by region
- 4.5.3. Market share analysis by country
CHAPTER 5: DAIRY CULTURES MARKET, BY FERMENTATION TYPE
- 5.1. Overview
- 5.1.1. Market size and forecast
- 5.2. Lactic Acid
- 5.2.1. Key market trends, growth factors and opportunities
- 5.2.2. Market size and forecast, by region
- 5.2.3. Market share analysis by country
- 5.3. Yeast-Lactic Acid
- 5.3.1. Key market trends, growth factors and opportunities
- 5.3.2. Market size and forecast, by region
- 5.3.3. Market share analysis by country
- 5.4. Fungus-Lactic Acid
- 5.4.1. Key market trends, growth factors and opportunities
- 5.4.2. Market size and forecast, by region
- 5.4.3. Market share analysis by country
CHAPTER 6: DAIRY CULTURES MARKET, BY TYPE
- 6.1. Overview
- 6.1.1. Market size and forecast
- 6.2. Mesophilic
- 6.2.1. Key market trends, growth factors and opportunities
- 6.2.2. Market size and forecast, by region
- 6.2.3. Market share analysis by country
- 6.3. Thermophilic
- 6.3.1. Key market trends, growth factors and opportunities
- 6.3.2. Market size and forecast, by region
- 6.3.3. Market share analysis by country
CHAPTER 7: DAIRY CULTURES MARKET, BY REGION
- 7.1. Overview
- 7.1.1. Market size and forecast By Region
- 7.2. North America
- 7.2.1. Key market trends, growth factors and opportunities
- 7.2.2. Market size and forecast, by End User
- 7.2.3. Market size and forecast, by Fermentation Type
- 7.2.4. Market size and forecast, by Type
- 7.2.5. Market size and forecast, by country
- 7.2.5.1. U.S.
- 7.2.5.1.1. Market size and forecast, by End User
- 7.2.5.1.2. Market size and forecast, by Fermentation Type
- 7.2.5.1.3. Market size and forecast, by Type
- 7.2.5.2. Canada
- 7.2.5.2.1. Market size and forecast, by End User
- 7.2.5.2.2. Market size and forecast, by Fermentation Type
- 7.2.5.2.3. Market size and forecast, by Type
- 7.2.5.3. Mexico
- 7.2.5.3.1. Market size and forecast, by End User
- 7.2.5.3.2. Market size and forecast, by Fermentation Type
- 7.2.5.3.3. Market size and forecast, by Type
- 7.3. Europe
- 7.3.1. Key market trends, growth factors and opportunities
- 7.3.2. Market size and forecast, by End User
- 7.3.3. Market size and forecast, by Fermentation Type
- 7.3.4. Market size and forecast, by Type
- 7.3.5. Market size and forecast, by country
- 7.3.5.1. UK
- 7.3.5.1.1. Market size and forecast, by End User
- 7.3.5.1.2. Market size and forecast, by Fermentation Type
- 7.3.5.1.3. Market size and forecast, by Type
- 7.3.5.2. Germany
- 7.3.5.2.1. Market size and forecast, by End User
- 7.3.5.2.2. Market size and forecast, by Fermentation Type
- 7.3.5.2.3. Market size and forecast, by Type
- 7.3.5.3. France
- 7.3.5.3.1. Market size and forecast, by End User
- 7.3.5.3.2. Market size and forecast, by Fermentation Type
- 7.3.5.3.3. Market size and forecast, by Type
- 7.3.5.4. Italy
- 7.3.5.4.1. Market size and forecast, by End User
- 7.3.5.4.2. Market size and forecast, by Fermentation Type
- 7.3.5.4.3. Market size and forecast, by Type
- 7.3.5.5. Spain
- 7.3.5.5.1. Market size and forecast, by End User
- 7.3.5.5.2. Market size and forecast, by Fermentation Type
- 7.3.5.5.3. Market size and forecast, by Type
- 7.3.5.6. Rest of Europe
- 7.3.5.6.1. Market size and forecast, by End User
- 7.3.5.6.2. Market size and forecast, by Fermentation Type
- 7.3.5.6.3. Market size and forecast, by Type
- 7.4. Asia-Pacific
- 7.4.1. Key market trends, growth factors and opportunities
- 7.4.2. Market size and forecast, by End User
- 7.4.3. Market size and forecast, by Fermentation Type
- 7.4.4. Market size and forecast, by Type
- 7.4.5. Market size and forecast, by country
- 7.4.5.1. China
- 7.4.5.1.1. Market size and forecast, by End User
- 7.4.5.1.2. Market size and forecast, by Fermentation Type
- 7.4.5.1.3. Market size and forecast, by Type
- 7.4.5.2. Japan
- 7.4.5.2.1. Market size and forecast, by End User
- 7.4.5.2.2. Market size and forecast, by Fermentation Type
- 7.4.5.2.3. Market size and forecast, by Type
- 7.4.5.3. India
- 7.4.5.3.1. Market size and forecast, by End User
- 7.4.5.3.2. Market size and forecast, by Fermentation Type
- 7.4.5.3.3. Market size and forecast, by Type
- 7.4.5.4. South Korea
- 7.4.5.4.1. Market size and forecast, by End User
- 7.4.5.4.2. Market size and forecast, by Fermentation Type
- 7.4.5.4.3. Market size and forecast, by Type
- 7.4.5.5. Australia
- 7.4.5.5.1. Market size and forecast, by End User
- 7.4.5.5.2. Market size and forecast, by Fermentation Type
- 7.4.5.5.3. Market size and forecast, by Type
- 7.4.5.6. Rest of Asia-Pacific
- 7.4.5.6.1. Market size and forecast, by End User
- 7.4.5.6.2. Market size and forecast, by Fermentation Type
- 7.4.5.6.3. Market size and forecast, by Type
- 7.5. Latin America
- 7.5.1. Key market trends, growth factors and opportunities
- 7.5.2. Market size and forecast, by End User
- 7.5.3. Market size and forecast, by Fermentation Type
- 7.5.4. Market size and forecast, by Type
- 7.5.5. Market size and forecast, by country
- 7.5.5.1. Brazil
- 7.5.5.1.1. Market size and forecast, by End User
- 7.5.5.1.2. Market size and forecast, by Fermentation Type
- 7.5.5.1.3. Market size and forecast, by Type
- 7.5.5.2. Argentina
- 7.5.5.2.1. Market size and forecast, by End User
- 7.5.5.2.2. Market size and forecast, by Fermentation Type
- 7.5.5.2.3. Market size and forecast, by Type
- 7.5.5.3. Rest Of Latin America
- 7.5.5.3.1. Market size and forecast, by End User
- 7.5.5.3.2. Market size and forecast, by Fermentation Type
- 7.5.5.3.3. Market size and forecast, by Type
- 7.6. Middle East and Africa
- 7.6.1. Key market trends, growth factors and opportunities
- 7.6.2. Market size and forecast, by End User
- 7.6.3. Market size and forecast, by Fermentation Type
- 7.6.4. Market size and forecast, by Type
- 7.6.5. Market size and forecast, by country
- 7.6.5.1. Saudi Arabia
- 7.6.5.1.1. Market size and forecast, by End User
- 7.6.5.1.2. Market size and forecast, by Fermentation Type
- 7.6.5.1.3. Market size and forecast, by Type
- 7.6.5.2. South Africa
- 7.6.5.2.1. Market size and forecast, by End User
- 7.6.5.2.2. Market size and forecast, by Fermentation Type
- 7.6.5.2.3. Market size and forecast, by Type
- 7.6.5.3. Rest of Middle East And Africa
- 7.6.5.3.1. Market size and forecast, by End User
- 7.6.5.3.2. Market size and forecast, by Fermentation Type
- 7.6.5.3.3. Market size and forecast, by Type
CHAPTER 8: COMPETITIVE LANDSCAPE
- 8.1. Introduction
- 8.2. Top winning strategies
- 8.3. Product mapping of top 10 player
- 8.4. Competitive dashboard
- 8.5. Competitive heatmap
- 8.6. Top player positioning, 2022
CHAPTER 9: COMPANY PROFILES
- 9.1. Arla Foods Amba
- 9.1.1. Company overview
- 9.1.2. Key executives
- 9.1.3. Company snapshot
- 9.1.4. Operating business segments
- 9.1.5. Product portfolio
- 9.1.6. Business performance
- 9.1.7. Key strategic moves and developments
- 9.2. Fonterra Co-operative Group Limited
- 9.2.1. Company overview
- 9.2.2. Key executives
- 9.2.3. Company snapshot
- 9.2.4. Operating business segments
- 9.2.5. Product portfolio
- 9.2.6. Business performance
- 9.2.7. Key strategic moves and developments
- 9.3. Saputo Inc.
- 9.3.1. Company overview
- 9.3.2. Key executives
- 9.3.3. Company snapshot
- 9.3.4. Operating business segments
- 9.3.5. Product portfolio
- 9.3.6. Business performance
- 9.3.7. Key strategic moves and developments
- 9.4. Grupo Lala
- 9.4.1. Company overview
- 9.4.2. Key executives
- 9.4.3. Company snapshot
- 9.4.4. Operating business segments
- 9.4.5. Product portfolio
- 9.4.6. Business performance
- 9.4.7. Key strategic moves and developments
- 9.5. Dean Foods Company
- 9.5.1. Company overview
- 9.5.2. Key executives
- 9.5.3. Company snapshot
- 9.5.4. Operating business segments
- 9.5.5. Product portfolio
- 9.5.6. Business performance
- 9.5.7. Key strategic moves and developments
- 9.6. Clover S.A. Proprietary Limited
- 9.6.1. Company overview
- 9.6.2. Key executives
- 9.6.3. Company snapshot
- 9.6.4. Operating business segments
- 9.6.5. Product portfolio
- 9.6.6. Business performance
- 9.6.7. Key strategic moves and developments
- 9.7. SanCor
- 9.7.1. Company overview
- 9.7.2. Key executives
- 9.7.3. Company snapshot
- 9.7.4. Operating business segments
- 9.7.5. Product portfolio
- 9.7.6. Business performance
- 9.7.7. Key strategic moves and developments
- 9.8. foremost farms usa
- 9.8.1. Company overview
- 9.8.2. Key executives
- 9.8.3. Company snapshot
- 9.8.4. Operating business segments
- 9.8.5. Product portfolio
- 9.8.6. Business performance
- 9.8.7. Key strategic moves and developments
- 9.9. Amul
- 9.9.1. Company overview
- 9.9.2. Key executives
- 9.9.3. Company snapshot
- 9.9.4. Operating business segments
- 9.9.5. Product portfolio
- 9.9.6. Business performance
- 9.9.7. Key strategic moves and developments
- 9.10. Hatsun Agro Product Ltd
- 9.10.1. Company overview
- 9.10.2. Key executives
- 9.10.3. Company snapshot
- 9.10.4. Operating business segments
- 9.10.5. Product portfolio
- 9.10.6. Business performance
- 9.10.7. Key strategic moves and developments
LIST OF TABLES
- TABLE 01. GLOBAL DAIRY CULTURES MARKET, BY END USER, 2022-2032 ($MILLION)
- TABLE 02. DAIRY CULTURES MARKET FOR CHEESE, BY REGION, 2022-2032 ($MILLION)
- TABLE 03. DAIRY CULTURES MARKET FOR YOGURT, BY REGION, 2022-2032 ($MILLION)
- TABLE 04. DAIRY CULTURES MARKET FOR KEFIR, BY REGION, 2022-2032 ($MILLION)
- TABLE 05. DAIRY CULTURES MARKET FOR OTHERS, BY REGION, 2022-2032 ($MILLION)
- TABLE 06. GLOBAL DAIRY CULTURES MARKET, BY FERMENTATION TYPE, 2022-2032 ($MILLION)
- TABLE 07. DAIRY CULTURES MARKET FOR LACTIC ACID, BY REGION, 2022-2032 ($MILLION)
- TABLE 08. DAIRY CULTURES MARKET FOR YEAST-LACTIC ACID, BY REGION, 2022-2032 ($MILLION)
- TABLE 09. DAIRY CULTURES MARKET FOR FUNGUS-LACTIC ACID, BY REGION, 2022-2032 ($MILLION)
- TABLE 10. GLOBAL DAIRY CULTURES MARKET, BY TYPE, 2022-2032 ($MILLION)
- TABLE 11. DAIRY CULTURES MARKET FOR MESOPHILIC, BY REGION, 2022-2032 ($MILLION)
- TABLE 12. DAIRY CULTURES MARKET FOR THERMOPHILIC , BY REGION, 2022-2032 ($MILLION)
- TABLE 13. DAIRY CULTURES MARKET, BY REGION, 2022-2032 ($MILLION)
- TABLE 14. NORTH AMERICA DAIRY CULTURES MARKET, BY END USER, 2022-2032 ($MILLION)
- TABLE 15. NORTH AMERICA DAIRY CULTURES MARKET, BY FERMENTATION TYPE, 2022-2032 ($MILLION)
- TABLE 16. NORTH AMERICA DAIRY CULTURES MARKET, BY TYPE, 2022-2032 ($MILLION)
- TABLE 17. NORTH AMERICA DAIRY CULTURES MARKET, BY COUNTRY, 2022-2032 ($MILLION)
- TABLE 18. U.S. DAIRY CULTURES MARKET, BY END USER, 2022-2032 ($MILLION)
- TABLE 19. U.S. DAIRY CULTURES MARKET, BY FERMENTATION TYPE, 2022-2032 ($MILLION)
- TABLE 20. U.S. DAIRY CULTURES MARKET, BY TYPE, 2022-2032 ($MILLION)
- TABLE 21. CANADA DAIRY CULTURES MARKET, BY END USER, 2022-2032 ($MILLION)
- TABLE 22. CANADA DAIRY CULTURES MARKET, BY FERMENTATION TYPE, 2022-2032 ($MILLION)
- TABLE 23. CANADA DAIRY CULTURES MARKET, BY TYPE, 2022-2032 ($MILLION)
- TABLE 24. MEXICO DAIRY CULTURES MARKET, BY END USER, 2022-2032 ($MILLION)
- TABLE 25. MEXICO DAIRY CULTURES MARKET, BY FERMENTATION TYPE, 2022-2032 ($MILLION)
- TABLE 26. MEXICO DAIRY CULTURES MARKET, BY TYPE, 2022-2032 ($MILLION)
- TABLE 27. EUROPE DAIRY CULTURES MARKET, BY END USER, 2022-2032 ($MILLION)
- TABLE 28. EUROPE DAIRY CULTURES MARKET, BY FERMENTATION TYPE, 2022-2032 ($MILLION)
- TABLE 29. EUROPE DAIRY CULTURES MARKET, BY TYPE, 2022-2032 ($MILLION)
- TABLE 30. EUROPE DAIRY CULTURES MARKET, BY COUNTRY, 2022-2032 ($MILLION)
- TABLE 31. UK DAIRY CULTURES MARKET, BY END USER, 2022-2032 ($MILLION)
- TABLE 32. UK DAIRY CULTURES MARKET, BY FERMENTATION TYPE, 2022-2032 ($MILLION)
- TABLE 33. UK DAIRY CULTURES MARKET, BY TYPE, 2022-2032 ($MILLION)
- TABLE 34. GERMANY DAIRY CULTURES MARKET, BY END USER, 2022-2032 ($MILLION)
- TABLE 35. GERMANY DAIRY CULTURES MARKET, BY FERMENTATION TYPE, 2022-2032 ($MILLION)
- TABLE 36. GERMANY DAIRY CULTURES MARKET, BY TYPE, 2022-2032 ($MILLION)
- TABLE 37. FRANCE DAIRY CULTURES MARKET, BY END USER, 2022-2032 ($MILLION)
- TABLE 38. FRANCE DAIRY CULTURES MARKET, BY FERMENTATION TYPE, 2022-2032 ($MILLION)
- TABLE 39. FRANCE DAIRY CULTURES MARKET, BY TYPE, 2022-2032 ($MILLION)
- TABLE 40. ITALY DAIRY CULTURES MARKET, BY END USER, 2022-2032 ($MILLION)
- TABLE 41. ITALY DAIRY CULTURES MARKET, BY FERMENTATION TYPE, 2022-2032 ($MILLION)
- TABLE 42. ITALY DAIRY CULTURES MARKET, BY TYPE, 2022-2032 ($MILLION)
- TABLE 43. SPAIN DAIRY CULTURES MARKET, BY END USER, 2022-2032 ($MILLION)
- TABLE 44. SPAIN DAIRY CULTURES MARKET, BY FERMENTATION TYPE, 2022-2032 ($MILLION)
- TABLE 45. SPAIN DAIRY CULTURES MARKET, BY TYPE, 2022-2032 ($MILLION)
- TABLE 46. REST OF EUROPE DAIRY CULTURES MARKET, BY END USER, 2022-2032 ($MILLION)
- TABLE 47. REST OF EUROPE DAIRY CULTURES MARKET, BY FERMENTATION TYPE, 2022-2032 ($MILLION)
- TABLE 48. REST OF EUROPE DAIRY CULTURES MARKET, BY TYPE, 2022-2032 ($MILLION)
- TABLE 49. ASIA-PACIFIC DAIRY CULTURES MARKET, BY END USER, 2022-2032 ($MILLION)
- TABLE 50. ASIA-PACIFIC DAIRY CULTURES MARKET, BY FERMENTATION TYPE, 2022-2032 ($MILLION)
- TABLE 51. ASIA-PACIFIC DAIRY CULTURES MARKET, BY TYPE, 2022-2032 ($MILLION)
- TABLE 52. ASIA-PACIFIC DAIRY CULTURES MARKET, BY COUNTRY, 2022-2032 ($MILLION)
- TABLE 53. CHINA DAIRY CULTURES MARKET, BY END USER, 2022-2032 ($MILLION)
- TABLE 54. CHINA DAIRY CULTURES MARKET, BY FERMENTATION TYPE, 2022-2032 ($MILLION)
- TABLE 55. CHINA DAIRY CULTURES MARKET, BY TYPE, 2022-2032 ($MILLION)
- TABLE 56. JAPAN DAIRY CULTURES MARKET, BY END USER, 2022-2032 ($MILLION)
- TABLE 57. JAPAN DAIRY CULTURES MARKET, BY FERMENTATION TYPE, 2022-2032 ($MILLION)
- TABLE 58. JAPAN DAIRY CULTURES MARKET, BY TYPE, 2022-2032 ($MILLION)
- TABLE 59. INDIA DAIRY CULTURES MARKET, BY END USER, 2022-2032 ($MILLION)
- TABLE 60. INDIA DAIRY CULTURES MARKET, BY FERMENTATION TYPE, 2022-2032 ($MILLION)
- TABLE 61. INDIA DAIRY CULTURES MARKET, BY TYPE, 2022-2032 ($MILLION)
- TABLE 62. SOUTH KOREA DAIRY CULTURES MARKET, BY END USER, 2022-2032 ($MILLION)
- TABLE 63. SOUTH KOREA DAIRY CULTURES MARKET, BY FERMENTATION TYPE, 2022-2032 ($MILLION)
- TABLE 64. SOUTH KOREA DAIRY CULTURES MARKET, BY TYPE, 2022-2032 ($MILLION)
- TABLE 65. AUSTRALIA DAIRY CULTURES MARKET, BY END USER, 2022-2032 ($MILLION)
- TABLE 66. AUSTRALIA DAIRY CULTURES MARKET, BY FERMENTATION TYPE, 2022-2032 ($MILLION)
- TABLE 67. AUSTRALIA DAIRY CULTURES MARKET, BY TYPE, 2022-2032 ($MILLION)
- TABLE 68. REST OF ASIA-PACIFIC DAIRY CULTURES MARKET, BY END USER, 2022-2032 ($MILLION)
- TABLE 69. REST OF ASIA-PACIFIC DAIRY CULTURES MARKET, BY FERMENTATION TYPE, 2022-2032 ($MILLION)
- TABLE 70. REST OF ASIA-PACIFIC DAIRY CULTURES MARKET, BY TYPE, 2022-2032 ($MILLION)
- TABLE 71. LATIN AMERICA DAIRY CULTURES MARKET, BY END USER, 2022-2032 ($MILLION)
- TABLE 72. LATIN AMERICA DAIRY CULTURES MARKET, BY FERMENTATION TYPE, 2022-2032 ($MILLION)
- TABLE 73. LATIN AMERICA DAIRY CULTURES MARKET, BY TYPE, 2022-2032 ($MILLION)
- TABLE 74. LATIN AMERICA DAIRY CULTURES MARKET, BY COUNTRY, 2022-2032 ($MILLION)
- TABLE 75. BRAZIL DAIRY CULTURES MARKET, BY END USER, 2022-2032 ($MILLION)
- TABLE 76. BRAZIL DAIRY CULTURES MARKET, BY FERMENTATION TYPE, 2022-2032 ($MILLION)
- TABLE 77. BRAZIL DAIRY CULTURES MARKET, BY TYPE, 2022-2032 ($MILLION)
- TABLE 78. ARGENTINA DAIRY CULTURES MARKET, BY END USER, 2022-2032 ($MILLION)
- TABLE 79. ARGENTINA DAIRY CULTURES MARKET, BY FERMENTATION TYPE, 2022-2032 ($MILLION)
- TABLE 80. ARGENTINA DAIRY CULTURES MARKET, BY TYPE, 2022-2032 ($MILLION)
- TABLE 81. REST OF MIDDLE EAST DAIRY CULTURES MARKET, BY END USER, 2022-2032 ($MILLION)
- TABLE 82. REST OF MIDDLE EAST DAIRY CULTURES MARKET, BY FERMENTATION TYPE, 2022-2032 ($MILLION)
- TABLE 83. REST OF MIDDLE EAST DAIRY CULTURES MARKET, BY TYPE, 2022-2032 ($MILLION)
- TABLE 84. MIDDLE EAST AND AFRICA DAIRY CULTURES MARKET, BY END USER, 2022-2032 ($MILLION)
- TABLE 85. MIDDLE EAST AND AFRICA DAIRY CULTURES MARKET, BY FERMENTATION TYPE, 2022-2032 ($MILLION)
- TABLE 86. MIDDLE EAST AND AFRICA DAIRY CULTURES MARKET, BY TYPE, 2022-2032 ($MILLION)
- TABLE 87. MIDDLE EAST AND AFRICA DAIRY CULTURES MARKET, BY COUNTRY, 2022-2032 ($MILLION)
- TABLE 88. SAUDI ARABIA DAIRY CULTURES MARKET, BY END USER, 2022-2032 ($MILLION)
- TABLE 89. SAUDI ARABIA DAIRY CULTURES MARKET, BY FERMENTATION TYPE, 2022-2032 ($MILLION)
- TABLE 90. SAUDI ARABIA DAIRY CULTURES MARKET, BY TYPE, 2022-2032 ($MILLION)
- TABLE 91. SOUTH AFRICA DAIRY CULTURES MARKET, BY END USER, 2022-2032 ($MILLION)
- TABLE 92. SOUTH AFRICA DAIRY CULTURES MARKET, BY FERMENTATION TYPE, 2022-2032 ($MILLION)
- TABLE 93. SOUTH AFRICA DAIRY CULTURES MARKET, BY TYPE, 2022-2032 ($MILLION)
- TABLE 94. REST OF MIDDLE EAST AND AFRICA DAIRY CULTURES MARKET, BY END USER, 2022-2032 ($MILLION)
- TABLE 95. REST OF MIDDLE EAST AND AFRICA DAIRY CULTURES MARKET, BY FERMENTATION TYPE, 2022-2032 ($MILLION)
- TABLE 96. REST OF MIDDLE EAST AND AFRICA DAIRY CULTURES MARKET, BY TYPE, 2022-2032 ($MILLION)
- TABLE 97. ARLA FOODS AMBA: KEY EXECUTIVES
- TABLE 98. ARLA FOODS AMBA: COMPANY SNAPSHOT
- TABLE 99. ARLA FOODS AMBA: PRODUCT SEGMENTS
- TABLE 100. ARLA FOODS AMBA: SERVICE SEGMENTS
- TABLE 101. ARLA FOODS AMBA: PRODUCT PORTFOLIO
- TABLE 102. ARLA FOODS AMBA: KEY STRATERGIES
- TABLE 103. FONTERRA CO-OPERATIVE GROUP LIMITED: KEY EXECUTIVES
- TABLE 104. FONTERRA CO-OPERATIVE GROUP LIMITED: COMPANY SNAPSHOT
- TABLE 105. FONTERRA CO-OPERATIVE GROUP LIMITED: PRODUCT SEGMENTS
- TABLE 106. FONTERRA CO-OPERATIVE GROUP LIMITED: SERVICE SEGMENTS
- TABLE 107. FONTERRA CO-OPERATIVE GROUP LIMITED: PRODUCT PORTFOLIO
- TABLE 108. FONTERRA CO-OPERATIVE GROUP LIMITED: KEY STRATERGIES
- TABLE 109. SAPUTO INC.: KEY EXECUTIVES
- TABLE 110. SAPUTO INC.: COMPANY SNAPSHOT
- TABLE 111. SAPUTO INC.: PRODUCT SEGMENTS
- TABLE 112. SAPUTO INC.: SERVICE SEGMENTS
- TABLE 113. SAPUTO INC.: PRODUCT PORTFOLIO
- TABLE 114. SAPUTO INC.: KEY STRATERGIES
- TABLE 115. GRUPO LALA: KEY EXECUTIVES
- TABLE 116. GRUPO LALA: COMPANY SNAPSHOT
- TABLE 117. GRUPO LALA: PRODUCT SEGMENTS
- TABLE 118. GRUPO LALA: SERVICE SEGMENTS
- TABLE 119. GRUPO LALA: PRODUCT PORTFOLIO
- TABLE 120. GRUPO LALA: KEY STRATERGIES
- TABLE 121. DEAN FOODS COMPANY: KEY EXECUTIVES
- TABLE 122. DEAN FOODS COMPANY: COMPANY SNAPSHOT
- TABLE 123. DEAN FOODS COMPANY: PRODUCT SEGMENTS
- TABLE 124. DEAN FOODS COMPANY: SERVICE SEGMENTS
- TABLE 125. DEAN FOODS COMPANY: PRODUCT PORTFOLIO
- TABLE 126. DEAN FOODS COMPANY: KEY STRATERGIES
- TABLE 127. CLOVER S.A. PROPRIETARY LIMITED: KEY EXECUTIVES
- TABLE 128. CLOVER S.A. PROPRIETARY LIMITED: COMPANY SNAPSHOT
- TABLE 129. CLOVER S.A. PROPRIETARY LIMITED: PRODUCT SEGMENTS
- TABLE 130. CLOVER S.A. PROPRIETARY LIMITED: SERVICE SEGMENTS
- TABLE 131. CLOVER S.A. PROPRIETARY LIMITED: PRODUCT PORTFOLIO
- TABLE 132. CLOVER S.A. PROPRIETARY LIMITED: KEY STRATERGIES
- TABLE 133. SANCOR: KEY EXECUTIVES
- TABLE 134. SANCOR: COMPANY SNAPSHOT
- TABLE 135. SANCOR: PRODUCT SEGMENTS
- TABLE 136. SANCOR: SERVICE SEGMENTS
- TABLE 137. SANCOR: PRODUCT PORTFOLIO
- TABLE 138. SANCOR: KEY STRATERGIES
- TABLE 139. FOREMOST FARMS USA: KEY EXECUTIVES
- TABLE 140. FOREMOST FARMS USA: COMPANY SNAPSHOT
- TABLE 141. FOREMOST FARMS USA: PRODUCT SEGMENTS
- TABLE 142. FOREMOST FARMS USA: SERVICE SEGMENTS
- TABLE 143. FOREMOST FARMS USA: PRODUCT PORTFOLIO
- TABLE 144. FOREMOST FARMS USA: KEY STRATERGIES
- TABLE 145. AMUL: KEY EXECUTIVES
- TABLE 146. AMUL: COMPANY SNAPSHOT
- TABLE 147. AMUL: PRODUCT SEGMENTS
- TABLE 148. AMUL: SERVICE SEGMENTS
- TABLE 149. AMUL: PRODUCT PORTFOLIO
- TABLE 150. AMUL: KEY STRATERGIES
- TABLE 151. HATSUN AGRO PRODUCT LTD: KEY EXECUTIVES
- TABLE 152. HATSUN AGRO PRODUCT LTD: COMPANY SNAPSHOT
- TABLE 153. HATSUN AGRO PRODUCT LTD: PRODUCT SEGMENTS
- TABLE 154. HATSUN AGRO PRODUCT LTD: SERVICE SEGMENTS
- TABLE 155. HATSUN AGRO PRODUCT LTD: PRODUCT PORTFOLIO
- TABLE 156. HATSUN AGRO PRODUCT LTD: KEY STRATERGIES
LIST OF FIGURES
- FIGURE 01. DAIRY CULTURES MARKET, 2022-2032
- FIGURE 02. SEGMENTATION OF DAIRY CULTURES MARKET,2022-2032
- FIGURE 03. TOP IMPACTING FACTORS IN DAIRY CULTURES MARKET
- FIGURE 04. TOP INVESTMENT POCKETS IN DAIRY CULTURES MARKET (2023-2032)
- FIGURE 05. BARGAINING POWER OF SUPPLIERS
- FIGURE 06. BARGAINING POWER OF BUYERS
- FIGURE 07. THREAT OF SUBSTITUTION
- FIGURE 08. THREAT OF SUBSTITUTION
- FIGURE 09. COMPETITIVE RIVALRY
- FIGURE 10. GLOBAL DAIRY CULTURES MARKET:DRIVERS, RESTRAINTS AND OPPORTUNITIES
- FIGURE 11. DAIRY CULTURES MARKET, BY END USER, 2022 AND 2032(%)
- FIGURE 12. COMPARATIVE SHARE ANALYSIS OF DAIRY CULTURES MARKET FOR CHEESE, BY COUNTRY 2022 AND 2032(%)
- FIGURE 13. COMPARATIVE SHARE ANALYSIS OF DAIRY CULTURES MARKET FOR YOGURT, BY COUNTRY 2022 AND 2032(%)
- FIGURE 14. COMPARATIVE SHARE ANALYSIS OF DAIRY CULTURES MARKET FOR KEFIR, BY COUNTRY 2022 AND 2032(%)
- FIGURE 15. COMPARATIVE SHARE ANALYSIS OF DAIRY CULTURES MARKET FOR OTHERS, BY COUNTRY 2022 AND 2032(%)
- FIGURE 16. DAIRY CULTURES MARKET, BY FERMENTATION TYPE, 2022 AND 2032(%)
- FIGURE 17. COMPARATIVE SHARE ANALYSIS OF DAIRY CULTURES MARKET FOR LACTIC ACID, BY COUNTRY 2022 AND 2032(%)
- FIGURE 18. COMPARATIVE SHARE ANALYSIS OF DAIRY CULTURES MARKET FOR YEAST-LACTIC ACID, BY COUNTRY 2022 AND 2032(%)
- FIGURE 19. COMPARATIVE SHARE ANALYSIS OF DAIRY CULTURES MARKET FOR FUNGUS-LACTIC ACID, BY COUNTRY 2022 AND 2032(%)
- FIGURE 20. DAIRY CULTURES MARKET, BY TYPE, 2022 AND 2032(%)
- FIGURE 21. COMPARATIVE SHARE ANALYSIS OF DAIRY CULTURES MARKET FOR MESOPHILIC, BY COUNTRY 2022 AND 2032(%)
- FIGURE 22. COMPARATIVE SHARE ANALYSIS OF DAIRY CULTURES MARKET FOR THERMOPHILIC , BY COUNTRY 2022 AND 2032(%)
- FIGURE 23. DAIRY CULTURES MARKET BY REGION, 2022 AND 2032(%)
- FIGURE 24. U.S. DAIRY CULTURES MARKET, 2022-2032 ($MILLION)
- FIGURE 25. CANADA DAIRY CULTURES MARKET, 2022-2032 ($MILLION)
- FIGURE 26. MEXICO DAIRY CULTURES MARKET, 2022-2032 ($MILLION)
- FIGURE 27. UK DAIRY CULTURES MARKET, 2022-2032 ($MILLION)
- FIGURE 28. GERMANY DAIRY CULTURES MARKET, 2022-2032 ($MILLION)
- FIGURE 29. FRANCE DAIRY CULTURES MARKET, 2022-2032 ($MILLION)
- FIGURE 30. ITALY DAIRY CULTURES MARKET, 2022-2032 ($MILLION)
- FIGURE 31. SPAIN DAIRY CULTURES MARKET, 2022-2032 ($MILLION)
- FIGURE 32. REST OF EUROPE DAIRY CULTURES MARKET, 2022-2032 ($MILLION)
- FIGURE 33. CHINA DAIRY CULTURES MARKET, 2022-2032 ($MILLION)
- FIGURE 34. JAPAN DAIRY CULTURES MARKET, 2022-2032 ($MILLION)
- FIGURE 35. INDIA DAIRY CULTURES MARKET, 2022-2032 ($MILLION)
- FIGURE 36. SOUTH KOREA DAIRY CULTURES MARKET, 2022-2032 ($MILLION)
- FIGURE 37. AUSTRALIA DAIRY CULTURES MARKET, 2022-2032 ($MILLION)
- FIGURE 38. REST OF ASIA-PACIFIC DAIRY CULTURES MARKET, 2022-2032 ($MILLION)
- FIGURE 39. BRAZIL DAIRY CULTURES MARKET, 2022-2032 ($MILLION)
- FIGURE 40. ARGENTINA DAIRY CULTURES MARKET, 2022-2032 ($MILLION)
- FIGURE 41. REST OF MIDDLE EAST DAIRY CULTURES MARKET, 2022-2032 ($MILLION)
- FIGURE 42. SAUDI ARABIA DAIRY CULTURES MARKET, 2022-2032 ($MILLION)
- FIGURE 43. SOUTH AFRICA DAIRY CULTURES MARKET, 2022-2032 ($MILLION)
- FIGURE 44. REST OF MIDDLE EAST AND AFRICA DAIRY CULTURES MARKET, 2022-2032 ($MILLION)
- FIGURE 45. TOP WINNING STRATEGIES, BY YEAR
- FIGURE 46. TOP WINNING STRATEGIES, BY DEVELOPMENT
- FIGURE 47. TOP WINNING STRATEGIES, BY COMPANY
- FIGURE 48. PRODUCT MAPPING OF TOP 10 PLAYERS
- FIGURE 49. COMPETITIVE DASHBOARD
- FIGURE 50. COMPETITIVE HEATMAP: DAIRY CULTURES MARKET
- FIGURE 51. TOP PLAYER POSITIONING, 2022