


 |
市場調查報告書
商品編碼
1447178
汽車冷卻液電動閥市場:按類型、調變類型、通訊協定、車型、電壓:2023-2032年全球機會分析與產業預測Automotive Electric Coolant Valve Market By Type, By Modulation Type, By Communication Protocol, By Vehicle type, By Voltage : Global Opportunity Analysis and Industry Forecast, 2023-2032 |
||||||
汽車冷卻液電動閥是內置於汽車冷卻系統中的特殊部件,用於調節引擎內冷卻液的流量。
與傳統的機械冷卻液閥不同,電動冷卻液閥採用電子控制,可精確、動態地管理引擎溫度。該技術透過根據即時情況調節冷卻水流量來實現高效的溫度控制,有助於提高燃油效率、提高性能並減少排放氣體。
環境永續性變得越來越重要,有關車輛排放的法規也變得越來越嚴格。世界各地的汽車製造商正在採用電動冷卻液閥作為溫度控管系統的關鍵組件,以最佳化引擎溫度並提高燃油效率。此外,汽車產業日益走向電動,電動和混合動力汽車的產量迅速增加,進一步增加了對這些先進閥門的需求。例如,電動冷卻液閥對於維持電動車的最佳電池溫度至關重要,有助於提高電池系統的效率和使用壽命。
而且,隨著技術的不斷進步,市場也十分豐富。將智慧技術和連接技術整合到車輛中,為電動冷卻液閥的創新應用鋪平了道路。這些閥門配備智慧感測器和控制系統,可提供引擎溫度的即時資料,並根據駕駛條件調節冷卻液流量。這符合更廣泛的聯網汽車和自動駕駛汽車行業趨勢,並提供了開發複雜的自適應溫度控管解決方案的機會。
然而,市場並非沒有限制。一個顯著的挑戰是與實施先進的電動冷卻劑閥系統相關的初始成本。汽車製造商可能面臨生產成本增加,這可能會影響車輛的整體承受能力。此外,對電子元件在惡劣汽車環境中的可靠性和耐用性的擔憂可能會給普及帶來挑戰。
全球汽車冷卻液電動閥市場按類型、調變類型、通訊協定、車型、電壓和地區細分。按類型分類,全球市場分為 2 路、3 路、4 路、5 路和其他。調變類型分為預先配置電動冷卻劑閥和現場可配置電動冷卻劑閥。按通訊協定,分析包括直接類比、類比/電壓回饋、CAN、LIN等。依車型分類,又分為小客車、小型車、中大型卡車、客車及客車、非公路用車輛。非公路用車細分市場進一步細分為建築和採礦設備、農業車輛和工業車輛。按電壓類型,市場分為 12V 和 24V。按地區分類,分析基於北美、歐洲、亞太地區和 LAMEA。
- 本報告定量分析了 2020 年至 2032 年電動冷卻液電動閥市場的細分市場、當前趨勢、估計趨勢和動態,並確定了汽車電動液電動閥市場有前景的市場機會。
- 我們提供市場研究以及與市場促進因素、市場限制和市場機會相關的資訊。
- 波特的五力分析強調買家和供應商幫助相關人員做出利潤驅動的商業決策並加強供應商-買家網路的潛力。
- 對汽車冷卻液電動閥市場細分的詳細分析有助於識別市場機會。
- 每個地區的主要國家都根據其對全球市場的收益貢獻繪製了地圖。
- 市場參與者定位有助於基準化分析,並提供對市場參與者當前位置的清晰了解。
- 該報告包括對區域和全球汽車電動液閥門市場趨勢、主要企業、細分市場、應用領域和市場成長策略的分析。
報告客製化的可能性
- 根據您的意願新增公司簡介
- SWOT分析
目錄
第1章簡介
第 2 章執行摘要
第3章市場概況
- 市場定義和範圍
- 主要發現
- 影響因素
- 主要投資機會
- 波特五力分析
- 市場動態
- 促進因素
- 抑制因素
- 機會
第4章汽車冷卻液電動閥市場:依類型
- 概述
- 二通閥
- 三通閥
- 四通閥
- 五通閥
- 其他
第5章汽車冷卻液電動閥市場:依模組類型
- 概述
- 預配置電動冷卻液閥
- 現場可配置電動冷卻液閥
第6章汽車冷卻液電動閥市場:依通訊協定
- 概述
- 直接模擬
- 帶電壓回饋的模擬
- CAN
- LIN
- 其他
第7章汽車冷卻電動閥市場(依車型)
- 概述
- 小客車
- 小型小客車
- 中型/大型卡車
- 巴士和長途汽車
- 非公路用車
第8章汽車冷卻液電動閥市場:按電壓
- 概述
- 12V
- 24V
第9章汽車冷卻液電動閥市場:按地區
- 概述
- 北美洲
- 美國
- 加拿大
- 墨西哥
- 歐洲
- 英國
- 德國
- 法國
- 義大利
- 西班牙
- 其他
- 亞太地區
- 中國
- 印度
- 日本
- 韓國
- 其他
- 拉丁美洲
- 拉丁美洲
- 中東
- 非洲
第10章競爭格局
- 介紹
- 關鍵成功策略
- 10家主要企業產品圖譜
- 競爭對手儀表板
- 競爭熱圖
- 2020年主要企業定位
第11章 公司簡介
- Zhejiang Sanhua Auto Motive Co., Ltd
- ROBERTSHAW
- PV Clean Mobility Technologies
- Schrader-Bridgeport International, Inc.
- Hanon Systems
- MODINE MANUFACTURING COMPANY
- Vitesco Technologies GmbH
- Honeywell International Inc.
- Thermal Management Solutions Group Ltd.
- VOSS Fluid GmbH
- Emerson Electric Co.(Asco Valve Inc)
- Siemens AG
- Parker-Hannifin Corporation
- Rheinmetall AG
- Robert Bosch GmbH
- Continental AG
- Rotex Automation Limited
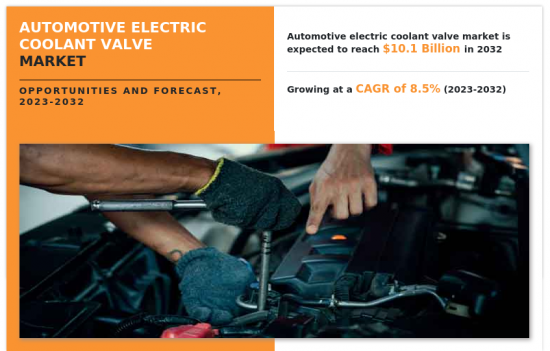
An Automotive Electric Coolant Valve is a specialized component integrated into a vehicle's cooling system to regulate the flow of coolant within the engine. Unlike traditional mechanical coolant valves, electric coolant valves are electronically controlled, allowing for precise and dynamic management of the engine's temperature. This technology enables efficient thermal control by adjusting the flow of coolant based on real-time conditions, contributing to improved fuel efficiency, enhanced performance, and reduced emissions.
An increasing emphasis on environmental sustainability and stringent regulations regarding vehicle emissions. Automakers worldwide are adopting electric coolant valves as a vital component in thermal management systems, enabling them to optimize engine temperatures and enhance fuel efficiency. Additionally, the escalating trend towards electrification in the automotive industry, with a surge in electric and hybrid vehicle production, further fuels the demand for these advanced valves. For instance, electric coolant valves are integral to maintaining optimal battery temperatures in electric vehicles, contributing to the efficiency and longevity of the battery systems.
In addition, the market are abundant, driven by ongoing technological advancements. The integration of smart technologies and connectivity in vehicles opens avenues for innovative applications of electric coolant valves. These valves, when equipped with intelligent sensors and control systems, can provide real-time data on engine temperature and adapt coolant flow based on driving conditions. This presents opportunities for developing sophisticated and adaptive thermal management solutions, aligning with the broader industry trends toward connected and autonomous vehicles.
However, the market is not without its restraint factors. One notable challenge is the initial cost associated with implementing advanced electric coolant valve systems. Automakers may face increased production costs, potentially impacting the overall affordability of vehicles. Additionally, concerns regarding the reliability and durability of electronic components in harsh automotive environments could pose challenges for widespread adoption.
The global automotive electric coolant valve market is segmented into type, modulation type, communication protocol, vehicle type, voltage, and region. By type, the global market has been fragmented into two-way, three-way, four-way, five ways, and others. By modulation type, the market has been analyzed across pre-configured electric coolant valves and field-configurable electric coolant valves. By communication protocol it is analyzed across direct analog, analog w/ voltage feedback, CAN, LIN and others. On the basis of vehicle type, the market is fragmented into passenger vehicles, light duty vehicles, medium and heavy-duty trucks, buses and coaches, and off-highway vehicles. The off-highway vehicle segment is further fragmented into construction & mining equipment, agriculture vehicles, and industrial vehicles. By voltage type, the market is segmented into 12V and 24V. Region wise, the market is analyzed across North America, Europe, Asia-Pacific, and LAMEA.
The key players analyzed in the global automotive electric coolant valve market include Thermal Management Solution Group, Zhejiang Sanhua Auto Motive Co., Ltd, Robert Shaw, Voss Fluid GmbH, Emerson Electric Co. (Asco Valve Inc), PV Clean Mobility Technologies, Vitesco Technologies GmbH, Schrader Pacific Advanced Valves, Hanon Systems, Modine Manufacturing Company, Honeywell International Inc., Siemens AG, Parker Hannifin Corporation, Rheinmetall AG, Robert Bosch GmbH, Continental AG, And Rotex Automation Limited.
- This report provides a quantitative analysis of the market segments, current trends, estimations, and dynamics of the automotive electric coolant valve market analysis from 2020 to 2032 to identify the prevailing automotive electric coolant valve market opportunities.
- The market research is offered along with information related to key drivers, restraints, and opportunities.
- Porter's five forces analysis highlights the potency of buyers and suppliers to enable stakeholders make profit-oriented business decisions and strengthen their supplier-buyer network.
- In-depth analysis of the automotive electric coolant valve market segmentation assists to determine the prevailing market opportunities.
- Major countries in each region are mapped according to their revenue contribution to the global market.
- Market player positioning facilitates benchmarking and provides a clear understanding of the present position of the market players.
- The report includes the analysis of the regional as well as global automotive electric coolant valve market trends, key players, market segments, application areas, and market growth strategies.
Additional benefits you will get with this purchase are:
- Quarterly Update and* (only available with a corporate license, on listed price)
- 5 additional Company Profile of client Choice pre- or Post-purchase, as a free update.
- Free Upcoming Version on the Purchase of Five and Enterprise User License.
- 16 analyst hours of support* (post-purchase, if you find additional data requirements upon review of the report, you may receive support amounting to 16 analyst hours to solve questions, and post-sale queries)
- 15% Free Customization* (in case the scope or segment of the report does not match your requirements, 15% is equivalent to 3 working days of free work, applicable once)
- Free data Pack on the Five and Enterprise User License. (Excel version of the report)
- Free Updated report if the report is 6-12 months old or older.
- 24-hour priority response*
- Free Industry updates and white papers.
Possible Customization with this report (with additional cost and timeline, please talk to the sales executive to know more)
- Additional company profiles with specific to client's interest
- SWOT Analysis
Key Market Segments
By Voltage
- 12V
- 24V
By Type
- Five Way
- Others
- Two Way
- Three Way
- Four Way
By Modulation Type
- Pre-configured Electric Coolant Valves
- Field-configurable Electric Coolant Valves
By Communication Protocol
- Direct Analog
- Analog w/ Voltage Feedback
- CAN
- LIN
- Others
By Vehicle type
- Passenger Vehicle
- Light Duty Vehicle
- Medium and Heavy Duty Trucks
- Buses and Coaches
- Off Highway Vehicles
By Region
- North America
- U.S.
- Canada
- Mexico
- Europe
- UK
- Germany
- France
- Italy
- Spain
- Rest of Europe
- Asia-Pacific
- China
- India
- Japan
- South Korea
- Rest of Asia-Pacific
- LAMEA
- Latin America
- Middle East
- Africa
Key Market Players:
- Zhejiang Sanhua Auto Motive Co., Ltd
- ROBERTSHAW
- VOSS Fluid GmbH
- Siemens AG
- Rheinmetall AG
- Robert Bosch GmbH
- Continental AG
- Rotex Automation Limited
- Hanon Systems
- Vitesco Technologies GmbH
- MODINE MANUFACTURING COMPANY
- Parker-Hannifin Corporation
- Honeywell International Inc.
- PV Clean Mobility Technologies
- Emerson Electric Co. (Asco Valve Inc)
- Schrader-Bridgeport International, Inc.
- Thermal Management Solutions Group Ltd.
TABLE OF CONTENTS
CHAPTER 1: INTRODUCTION
- 1.1. Report description
- 1.2. Key market segments
- 1.3. Key benefits to the stakeholders
- 1.4. Research methodology
- 1.4.1. Primary research
- 1.4.2. Secondary research
- 1.4.3. Analyst tools and models
CHAPTER 2: EXECUTIVE SUMMARY
- 2.1. CXO Perspective
CHAPTER 3: MARKET OVERVIEW
- 3.1. Market definition and scope
- 3.2. Key findings
- 3.2.1. Top impacting factors
- 3.2.2. Top investment pockets
- 3.3. Porter's five forces analysis
- 3.4. Market dynamics
- 3.4.1. Drivers
- 3.4.2. Restraints
- 3.4.3. Opportunities
CHAPTER 4: AUTOMOTIVE ELECTRIC COOLANT VALVE MARKET, BY TYPE
- 4.1. Overview
- 4.1.1. Market size and forecast
- 4.2. Two Way
- 4.2.1. Key market trends, growth factors and opportunities
- 4.2.2. Market size and forecast, by region
- 4.2.3. Market share analysis by country
- 4.3. Three Way
- 4.3.1. Key market trends, growth factors and opportunities
- 4.3.2. Market size and forecast, by region
- 4.3.3. Market share analysis by country
- 4.4. Four Way
- 4.4.1. Key market trends, growth factors and opportunities
- 4.4.2. Market size and forecast, by region
- 4.4.3. Market share analysis by country
- 4.5. Five Way
- 4.5.1. Key market trends, growth factors and opportunities
- 4.5.2. Market size and forecast, by region
- 4.5.3. Market share analysis by country
- 4.6. Others
- 4.6.1. Key market trends, growth factors and opportunities
- 4.6.2. Market size and forecast, by region
- 4.6.3. Market share analysis by country
CHAPTER 5: AUTOMOTIVE ELECTRIC COOLANT VALVE MARKET, BY MODULATION TYPE
- 5.1. Overview
- 5.1.1. Market size and forecast
- 5.2. Pre-configured Electric Coolant Valves
- 5.2.1. Key market trends, growth factors and opportunities
- 5.2.2. Market size and forecast, by region
- 5.2.3. Market share analysis by country
- 5.3. Field-configurable Electric Coolant Valves
- 5.3.1. Key market trends, growth factors and opportunities
- 5.3.2. Market size and forecast, by region
- 5.3.3. Market share analysis by country
CHAPTER 6: AUTOMOTIVE ELECTRIC COOLANT VALVE MARKET, BY COMMUNICATION PROTOCOL
- 6.1. Overview
- 6.1.1. Market size and forecast
- 6.2. Direct Analog
- 6.2.1. Key market trends, growth factors and opportunities
- 6.2.2. Market size and forecast, by region
- 6.2.3. Market share analysis by country
- 6.3. Analog w/ Voltage Feedback
- 6.3.1. Key market trends, growth factors and opportunities
- 6.3.2. Market size and forecast, by region
- 6.3.3. Market share analysis by country
- 6.4. CAN
- 6.4.1. Key market trends, growth factors and opportunities
- 6.4.2. Market size and forecast, by region
- 6.4.3. Market share analysis by country
- 6.5. LIN
- 6.5.1. Key market trends, growth factors and opportunities
- 6.5.2. Market size and forecast, by region
- 6.5.3. Market share analysis by country
- 6.6. Others
- 6.6.1. Key market trends, growth factors and opportunities
- 6.6.2. Market size and forecast, by region
- 6.6.3. Market share analysis by country
CHAPTER 7: AUTOMOTIVE ELECTRIC COOLANT VALVE MARKET, BY VEHICLE TYPE
- 7.1. Overview
- 7.1.1. Market size and forecast
- 7.2. Passenger Vehicle
- 7.2.1. Key market trends, growth factors and opportunities
- 7.2.2. Market size and forecast, by region
- 7.2.3. Market share analysis by country
- 7.3. Light Duty Vehicle
- 7.3.1. Key market trends, growth factors and opportunities
- 7.3.2. Market size and forecast, by region
- 7.3.3. Market share analysis by country
- 7.4. Medium and Heavy Duty Trucks
- 7.4.1. Key market trends, growth factors and opportunities
- 7.4.2. Market size and forecast, by region
- 7.4.3. Market share analysis by country
- 7.5. Buses and Coaches
- 7.5.1. Key market trends, growth factors and opportunities
- 7.5.2. Market size and forecast, by region
- 7.5.3. Market share analysis by country
- 7.6. Off Highway Vehicles
- 7.6.1. Key market trends, growth factors and opportunities
- 7.6.2. Market size and forecast, by region
- 7.6.3. Market share analysis by country
CHAPTER 8: AUTOMOTIVE ELECTRIC COOLANT VALVE MARKET, BY VOLTAGE
- 8.1. Overview
- 8.1.1. Market size and forecast
- 8.2. 12V
- 8.2.1. Key market trends, growth factors and opportunities
- 8.2.2. Market size and forecast, by region
- 8.2.3. Market share analysis by country
- 8.3. 24V
- 8.3.1. Key market trends, growth factors and opportunities
- 8.3.2. Market size and forecast, by region
- 8.3.3. Market share analysis by country
CHAPTER 9: AUTOMOTIVE ELECTRIC COOLANT VALVE MARKET, BY REGION
- 9.1. Overview
- 9.1.1. Market size and forecast By Region
- 9.2. North America
- 9.2.1. Key market trends, growth factors and opportunities
- 9.2.2. Market size and forecast, by Type
- 9.2.3. Market size and forecast, by Modulation Type
- 9.2.4. Market size and forecast, by Communication Protocol
- 9.2.5. Market size and forecast, by Vehicle type
- 9.2.6. Market size and forecast, by Voltage
- 9.2.7. Market size and forecast, by country
- 9.2.7.1. U.S.
- 9.2.7.1.1. Market size and forecast, by Type
- 9.2.7.1.2. Market size and forecast, by Modulation Type
- 9.2.7.1.3. Market size and forecast, by Communication Protocol
- 9.2.7.1.4. Market size and forecast, by Vehicle type
- 9.2.7.1.5. Market size and forecast, by Voltage
- 9.2.7.2. Canada
- 9.2.7.2.1. Market size and forecast, by Type
- 9.2.7.2.2. Market size and forecast, by Modulation Type
- 9.2.7.2.3. Market size and forecast, by Communication Protocol
- 9.2.7.2.4. Market size and forecast, by Vehicle type
- 9.2.7.2.5. Market size and forecast, by Voltage
- 9.2.7.3. Mexico
- 9.2.7.3.1. Market size and forecast, by Type
- 9.2.7.3.2. Market size and forecast, by Modulation Type
- 9.2.7.3.3. Market size and forecast, by Communication Protocol
- 9.2.7.3.4. Market size and forecast, by Vehicle type
- 9.2.7.3.5. Market size and forecast, by Voltage
- 9.3. Europe
- 9.3.1. Key market trends, growth factors and opportunities
- 9.3.2. Market size and forecast, by Type
- 9.3.3. Market size and forecast, by Modulation Type
- 9.3.4. Market size and forecast, by Communication Protocol
- 9.3.5. Market size and forecast, by Vehicle type
- 9.3.6. Market size and forecast, by Voltage
- 9.3.7. Market size and forecast, by country
- 9.3.7.1. UK
- 9.3.7.1.1. Market size and forecast, by Type
- 9.3.7.1.2. Market size and forecast, by Modulation Type
- 9.3.7.1.3. Market size and forecast, by Communication Protocol
- 9.3.7.1.4. Market size and forecast, by Vehicle type
- 9.3.7.1.5. Market size and forecast, by Voltage
- 9.3.7.2. Germany
- 9.3.7.2.1. Market size and forecast, by Type
- 9.3.7.2.2. Market size and forecast, by Modulation Type
- 9.3.7.2.3. Market size and forecast, by Communication Protocol
- 9.3.7.2.4. Market size and forecast, by Vehicle type
- 9.3.7.2.5. Market size and forecast, by Voltage
- 9.3.7.3. France
- 9.3.7.3.1. Market size and forecast, by Type
- 9.3.7.3.2. Market size and forecast, by Modulation Type
- 9.3.7.3.3. Market size and forecast, by Communication Protocol
- 9.3.7.3.4. Market size and forecast, by Vehicle type
- 9.3.7.3.5. Market size and forecast, by Voltage
- 9.3.7.4. Italy
- 9.3.7.4.1. Market size and forecast, by Type
- 9.3.7.4.2. Market size and forecast, by Modulation Type
- 9.3.7.4.3. Market size and forecast, by Communication Protocol
- 9.3.7.4.4. Market size and forecast, by Vehicle type
- 9.3.7.4.5. Market size and forecast, by Voltage
- 9.3.7.5. Spain
- 9.3.7.5.1. Market size and forecast, by Type
- 9.3.7.5.2. Market size and forecast, by Modulation Type
- 9.3.7.5.3. Market size and forecast, by Communication Protocol
- 9.3.7.5.4. Market size and forecast, by Vehicle type
- 9.3.7.5.5. Market size and forecast, by Voltage
- 9.3.7.6. Rest of Europe
- 9.3.7.6.1. Market size and forecast, by Type
- 9.3.7.6.2. Market size and forecast, by Modulation Type
- 9.3.7.6.3. Market size and forecast, by Communication Protocol
- 9.3.7.6.4. Market size and forecast, by Vehicle type
- 9.3.7.6.5. Market size and forecast, by Voltage
- 9.4. Asia-Pacific
- 9.4.1. Key market trends, growth factors and opportunities
- 9.4.2. Market size and forecast, by Type
- 9.4.3. Market size and forecast, by Modulation Type
- 9.4.4. Market size and forecast, by Communication Protocol
- 9.4.5. Market size and forecast, by Vehicle type
- 9.4.6. Market size and forecast, by Voltage
- 9.4.7. Market size and forecast, by country
- 9.4.7.1. China
- 9.4.7.1.1. Market size and forecast, by Type
- 9.4.7.1.2. Market size and forecast, by Modulation Type
- 9.4.7.1.3. Market size and forecast, by Communication Protocol
- 9.4.7.1.4. Market size and forecast, by Vehicle type
- 9.4.7.1.5. Market size and forecast, by Voltage
- 9.4.7.2. India
- 9.4.7.2.1. Market size and forecast, by Type
- 9.4.7.2.2. Market size and forecast, by Modulation Type
- 9.4.7.2.3. Market size and forecast, by Communication Protocol
- 9.4.7.2.4. Market size and forecast, by Vehicle type
- 9.4.7.2.5. Market size and forecast, by Voltage
- 9.4.7.3. Japan
- 9.4.7.3.1. Market size and forecast, by Type
- 9.4.7.3.2. Market size and forecast, by Modulation Type
- 9.4.7.3.3. Market size and forecast, by Communication Protocol
- 9.4.7.3.4. Market size and forecast, by Vehicle type
- 9.4.7.3.5. Market size and forecast, by Voltage
- 9.4.7.4. South Korea
- 9.4.7.4.1. Market size and forecast, by Type
- 9.4.7.4.2. Market size and forecast, by Modulation Type
- 9.4.7.4.3. Market size and forecast, by Communication Protocol
- 9.4.7.4.4. Market size and forecast, by Vehicle type
- 9.4.7.4.5. Market size and forecast, by Voltage
- 9.4.7.5. Rest of Asia-Pacific
- 9.4.7.5.1. Market size and forecast, by Type
- 9.4.7.5.2. Market size and forecast, by Modulation Type
- 9.4.7.5.3. Market size and forecast, by Communication Protocol
- 9.4.7.5.4. Market size and forecast, by Vehicle type
- 9.4.7.5.5. Market size and forecast, by Voltage
- 9.5. LAMEA
- 9.5.1. Key market trends, growth factors and opportunities
- 9.5.2. Market size and forecast, by Type
- 9.5.3. Market size and forecast, by Modulation Type
- 9.5.4. Market size and forecast, by Communication Protocol
- 9.5.5. Market size and forecast, by Vehicle type
- 9.5.6. Market size and forecast, by Voltage
- 9.5.7. Market size and forecast, by country
- 9.5.7.1. Latin America
- 9.5.7.1.1. Market size and forecast, by Type
- 9.5.7.1.2. Market size and forecast, by Modulation Type
- 9.5.7.1.3. Market size and forecast, by Communication Protocol
- 9.5.7.1.4. Market size and forecast, by Vehicle type
- 9.5.7.1.5. Market size and forecast, by Voltage
- 9.5.7.2. Middle East
- 9.5.7.2.1. Market size and forecast, by Type
- 9.5.7.2.2. Market size and forecast, by Modulation Type
- 9.5.7.2.3. Market size and forecast, by Communication Protocol
- 9.5.7.2.4. Market size and forecast, by Vehicle type
- 9.5.7.2.5. Market size and forecast, by Voltage
- 9.5.7.3. Africa
- 9.5.7.3.1. Market size and forecast, by Type
- 9.5.7.3.2. Market size and forecast, by Modulation Type
- 9.5.7.3.3. Market size and forecast, by Communication Protocol
- 9.5.7.3.4. Market size and forecast, by Vehicle type
- 9.5.7.3.5. Market size and forecast, by Voltage
CHAPTER 10: COMPETITIVE LANDSCAPE
- 10.1. Introduction
- 10.2. Top winning strategies
- 10.3. Product mapping of top 10 player
- 10.4. Competitive dashboard
- 10.5. Competitive heatmap
- 10.6. Top player positioning, 2020
CHAPTER 11: COMPANY PROFILES
- 11.1. Zhejiang Sanhua Auto Motive Co., Ltd
- 11.1.1. Company overview
- 11.1.2. Key executives
- 11.1.3. Company snapshot
- 11.1.4. Operating business segments
- 11.1.5. Product portfolio
- 11.1.6. Business performance
- 11.1.7. Key strategic moves and developments
- 11.2. ROBERTSHAW
- 11.2.1. Company overview
- 11.2.2. Key executives
- 11.2.3. Company snapshot
- 11.2.4. Operating business segments
- 11.2.5. Product portfolio
- 11.2.6. Business performance
- 11.2.7. Key strategic moves and developments
- 11.3. PV Clean Mobility Technologies
- 11.3.1. Company overview
- 11.3.2. Key executives
- 11.3.3. Company snapshot
- 11.3.4. Operating business segments
- 11.3.5. Product portfolio
- 11.3.6. Business performance
- 11.3.7. Key strategic moves and developments
- 11.4. Schrader-Bridgeport International, Inc.
- 11.4.1. Company overview
- 11.4.2. Key executives
- 11.4.3. Company snapshot
- 11.4.4. Operating business segments
- 11.4.5. Product portfolio
- 11.4.6. Business performance
- 11.4.7. Key strategic moves and developments
- 11.5. Hanon Systems
- 11.5.1. Company overview
- 11.5.2. Key executives
- 11.5.3. Company snapshot
- 11.5.4. Operating business segments
- 11.5.5. Product portfolio
- 11.5.6. Business performance
- 11.5.7. Key strategic moves and developments
- 11.6. MODINE MANUFACTURING COMPANY
- 11.6.1. Company overview
- 11.6.2. Key executives
- 11.6.3. Company snapshot
- 11.6.4. Operating business segments
- 11.6.5. Product portfolio
- 11.6.6. Business performance
- 11.6.7. Key strategic moves and developments
- 11.7. Vitesco Technologies GmbH
- 11.7.1. Company overview
- 11.7.2. Key executives
- 11.7.3. Company snapshot
- 11.7.4. Operating business segments
- 11.7.5. Product portfolio
- 11.7.6. Business performance
- 11.7.7. Key strategic moves and developments
- 11.8. Honeywell International Inc.
- 11.8.1. Company overview
- 11.8.2. Key executives
- 11.8.3. Company snapshot
- 11.8.4. Operating business segments
- 11.8.5. Product portfolio
- 11.8.6. Business performance
- 11.8.7. Key strategic moves and developments
- 11.9. Thermal Management Solutions Group Ltd.
- 11.9.1. Company overview
- 11.9.2. Key executives
- 11.9.3. Company snapshot
- 11.9.4. Operating business segments
- 11.9.5. Product portfolio
- 11.9.6. Business performance
- 11.9.7. Key strategic moves and developments
- 11.10. VOSS Fluid GmbH
- 11.10.1. Company overview
- 11.10.2. Key executives
- 11.10.3. Company snapshot
- 11.10.4. Operating business segments
- 11.10.5. Product portfolio
- 11.10.6. Business performance
- 11.10.7. Key strategic moves and developments
- 11.11. Emerson Electric Co. (Asco Valve Inc)
- 11.11.1. Company overview
- 11.11.2. Key executives
- 11.11.3. Company snapshot
- 11.11.4. Operating business segments
- 11.11.5. Product portfolio
- 11.11.6. Business performance
- 11.11.7. Key strategic moves and developments
- 11.12. Siemens AG
- 11.12.1. Company overview
- 11.12.2. Key executives
- 11.12.3. Company snapshot
- 11.12.4. Operating business segments
- 11.12.5. Product portfolio
- 11.12.6. Business performance
- 11.12.7. Key strategic moves and developments
- 11.13. Parker-Hannifin Corporation
- 11.13.1. Company overview
- 11.13.2. Key executives
- 11.13.3. Company snapshot
- 11.13.4. Operating business segments
- 11.13.5. Product portfolio
- 11.13.6. Business performance
- 11.13.7. Key strategic moves and developments
- 11.14. Rheinmetall AG
- 11.14.1. Company overview
- 11.14.2. Key executives
- 11.14.3. Company snapshot
- 11.14.4. Operating business segments
- 11.14.5. Product portfolio
- 11.14.6. Business performance
- 11.14.7. Key strategic moves and developments
- 11.15. Robert Bosch GmbH
- 11.15.1. Company overview
- 11.15.2. Key executives
- 11.15.3. Company snapshot
- 11.15.4. Operating business segments
- 11.15.5. Product portfolio
- 11.15.6. Business performance
- 11.15.7. Key strategic moves and developments
- 11.16. Continental AG
- 11.16.1. Company overview
- 11.16.2. Key executives
- 11.16.3. Company snapshot
- 11.16.4. Operating business segments
- 11.16.5. Product portfolio
- 11.16.6. Business performance
- 11.16.7. Key strategic moves and developments
- 11.17. Rotex Automation Limited
- 11.17.1. Company overview
- 11.17.2. Key executives
- 11.17.3. Company snapshot
- 11.17.4. Operating business segments
- 11.17.5. Product portfolio
- 11.17.6. Business performance
- 11.17.7. Key strategic moves and developments
LIST OF TABLES
- TABLE 01. GLOBAL AUTOMOTIVE ELECTRIC COOLANT VALVE MARKET, BY TYPE, 2020-2032 ($MILLION)
- TABLE 02. GLOBAL AUTOMOTIVE ELECTRIC COOLANT VALVE MARKET, BY TYPE, 2020-2032 (MILLION UNITS)
- TABLE 03. AUTOMOTIVE ELECTRIC COOLANT VALVE MARKET FOR TWO WAY, BY REGION, 2020-2032 ($MILLION)
- TABLE 04. AUTOMOTIVE ELECTRIC COOLANT VALVE MARKET FOR TWO WAY, BY REGION, 2020-2032 (MILLION UNITS)
- TABLE 05. AUTOMOTIVE ELECTRIC COOLANT VALVE MARKET FOR THREE WAY, BY REGION, 2020-2032 ($MILLION)
- TABLE 06. AUTOMOTIVE ELECTRIC COOLANT VALVE MARKET FOR THREE WAY, BY REGION, 2020-2032 (MILLION UNITS)
- TABLE 07. AUTOMOTIVE ELECTRIC COOLANT VALVE MARKET FOR FOUR WAY, BY REGION, 2020-2032 ($MILLION)
- TABLE 08. AUTOMOTIVE ELECTRIC COOLANT VALVE MARKET FOR FOUR WAY, BY REGION, 2020-2032 (MILLION UNITS)
- TABLE 09. AUTOMOTIVE ELECTRIC COOLANT VALVE MARKET FOR FIVE WAY, BY REGION, 2020-2032 ($MILLION)
- TABLE 10. AUTOMOTIVE ELECTRIC COOLANT VALVE MARKET FOR FIVE WAY, BY REGION, 2020-2032 (MILLION UNITS)
- TABLE 11. AUTOMOTIVE ELECTRIC COOLANT VALVE MARKET FOR OTHERS, BY REGION, 2020-2032 ($MILLION)
- TABLE 12. AUTOMOTIVE ELECTRIC COOLANT VALVE MARKET FOR OTHERS, BY REGION, 2020-2032 (MILLION UNITS)
- TABLE 13. GLOBAL AUTOMOTIVE ELECTRIC COOLANT VALVE MARKET, BY MODULATION TYPE, 2020-2032 ($MILLION)
- TABLE 14. GLOBAL AUTOMOTIVE ELECTRIC COOLANT VALVE MARKET, BY MODULATION TYPE, 2020-2032 (MILLION UNITS)
- TABLE 15. AUTOMOTIVE ELECTRIC COOLANT VALVE MARKET FOR PRE-CONFIGURED ELECTRIC COOLANT VALVES, BY REGION, 2020-2032 ($MILLION)
- TABLE 16. AUTOMOTIVE ELECTRIC COOLANT VALVE MARKET FOR PRE-CONFIGURED ELECTRIC COOLANT VALVES, BY REGION, 2020-2032 (MILLION UNITS)
- TABLE 17. AUTOMOTIVE ELECTRIC COOLANT VALVE MARKET FOR FIELD-CONFIGURABLE ELECTRIC COOLANT VALVES, BY REGION, 2020-2032 ($MILLION)
- TABLE 18. AUTOMOTIVE ELECTRIC COOLANT VALVE MARKET FOR FIELD-CONFIGURABLE ELECTRIC COOLANT VALVES, BY REGION, 2020-2032 (MILLION UNITS)
- TABLE 19. GLOBAL AUTOMOTIVE ELECTRIC COOLANT VALVE MARKET, BY COMMUNICATION PROTOCOL, 2020-2032 ($MILLION)
- TABLE 20. GLOBAL AUTOMOTIVE ELECTRIC COOLANT VALVE MARKET, BY COMMUNICATION PROTOCOL, 2020-2032 (MILLION UNITS)
- TABLE 21. AUTOMOTIVE ELECTRIC COOLANT VALVE MARKET FOR DIRECT ANALOG, BY REGION, 2020-2032 ($MILLION)
- TABLE 22. AUTOMOTIVE ELECTRIC COOLANT VALVE MARKET FOR DIRECT ANALOG, BY REGION, 2020-2032 (MILLION UNITS)
- TABLE 23. AUTOMOTIVE ELECTRIC COOLANT VALVE MARKET FOR ANALOG W/ VOLTAGE FEEDBACK, BY REGION, 2020-2032 ($MILLION)
- TABLE 24. AUTOMOTIVE ELECTRIC COOLANT VALVE MARKET FOR ANALOG W/ VOLTAGE FEEDBACK, BY REGION, 2020-2032 (MILLION UNITS)
- TABLE 25. AUTOMOTIVE ELECTRIC COOLANT VALVE MARKET FOR CAN, BY REGION, 2020-2032 ($MILLION)
- TABLE 26. AUTOMOTIVE ELECTRIC COOLANT VALVE MARKET FOR CAN, BY REGION, 2020-2032 (MILLION UNITS)
- TABLE 27. AUTOMOTIVE ELECTRIC COOLANT VALVE MARKET FOR LIN, BY REGION, 2020-2032 ($MILLION)
- TABLE 28. AUTOMOTIVE ELECTRIC COOLANT VALVE MARKET FOR LIN, BY REGION, 2020-2032 (MILLION UNITS)
- TABLE 29. AUTOMOTIVE ELECTRIC COOLANT VALVE MARKET FOR OTHERS, BY REGION, 2020-2032 ($MILLION)
- TABLE 30. AUTOMOTIVE ELECTRIC COOLANT VALVE MARKET FOR OTHERS, BY REGION, 2020-2032 (MILLION UNITS)
- TABLE 31. GLOBAL AUTOMOTIVE ELECTRIC COOLANT VALVE MARKET, BY VEHICLE TYPE, 2020-2032 ($MILLION)
- TABLE 32. GLOBAL AUTOMOTIVE ELECTRIC COOLANT VALVE MARKET, BY VEHICLE TYPE, 2020-2032 (MILLION UNITS)
- TABLE 33. AUTOMOTIVE ELECTRIC COOLANT VALVE MARKET FOR PASSENGER VEHICLE, BY REGION, 2020-2032 ($MILLION)
- TABLE 34. AUTOMOTIVE ELECTRIC COOLANT VALVE MARKET FOR PASSENGER VEHICLE, BY REGION, 2020-2032 (MILLION UNITS)
- TABLE 35. AUTOMOTIVE ELECTRIC COOLANT VALVE MARKET FOR LIGHT DUTY VEHICLE, BY REGION, 2020-2032 ($MILLION)
- TABLE 36. AUTOMOTIVE ELECTRIC COOLANT VALVE MARKET FOR LIGHT DUTY VEHICLE, BY REGION, 2020-2032 (MILLION UNITS)
- TABLE 37. AUTOMOTIVE ELECTRIC COOLANT VALVE MARKET FOR MEDIUM AND HEAVY DUTY TRUCKS, BY REGION, 2020-2032 ($MILLION)
- TABLE 38. AUTOMOTIVE ELECTRIC COOLANT VALVE MARKET FOR MEDIUM AND HEAVY DUTY TRUCKS, BY REGION, 2020-2032 (MILLION UNITS)
- TABLE 39. AUTOMOTIVE ELECTRIC COOLANT VALVE MARKET FOR BUSES AND COACHES, BY REGION, 2020-2032 ($MILLION)
- TABLE 40. AUTOMOTIVE ELECTRIC COOLANT VALVE MARKET FOR BUSES AND COACHES, BY REGION, 2020-2032 (MILLION UNITS)
- TABLE 41. AUTOMOTIVE ELECTRIC COOLANT VALVE MARKET FOR OFF HIGHWAY VEHICLES, BY REGION, 2020-2032 ($MILLION)
- TABLE 42. AUTOMOTIVE ELECTRIC COOLANT VALVE MARKET FOR OFF HIGHWAY VEHICLES, BY REGION, 2020-2032 (MILLION UNITS)
- TABLE 43. GLOBAL AUTOMOTIVE ELECTRIC COOLANT VALVE MARKET, BY VOLTAGE, 2020-2032 ($MILLION)
- TABLE 44. GLOBAL AUTOMOTIVE ELECTRIC COOLANT VALVE MARKET, BY VOLTAGE, 2020-2032 (MILLION UNITS)
- TABLE 45. AUTOMOTIVE ELECTRIC COOLANT VALVE MARKET FOR 12V, BY REGION, 2020-2032 ($MILLION)
- TABLE 46. AUTOMOTIVE ELECTRIC COOLANT VALVE MARKET FOR 12V, BY REGION, 2020-2032 (MILLION UNITS)
- TABLE 47. AUTOMOTIVE ELECTRIC COOLANT VALVE MARKET FOR 24V, BY REGION, 2020-2032 ($MILLION)
- TABLE 48. AUTOMOTIVE ELECTRIC COOLANT VALVE MARKET FOR 24V, BY REGION, 2020-2032 (MILLION UNITS)
- TABLE 49. AUTOMOTIVE ELECTRIC COOLANT VALVE MARKET, BY REGION, 2020-2032 ($MILLION)
- TABLE 50. AUTOMOTIVE ELECTRIC COOLANT VALVE MARKET, BY REGION, 2020-2032 (MILLION UNITS)
- TABLE 51. NORTH AMERICA AUTOMOTIVE ELECTRIC COOLANT VALVE MARKET, BY TYPE, 2020-2032 ($MILLION)
- TABLE 52. NORTH AMERICA AUTOMOTIVE ELECTRIC COOLANT VALVE MARKET, BY TYPE, 2020-2032 (MILLION UNITS)
- TABLE 53. NORTH AMERICA AUTOMOTIVE ELECTRIC COOLANT VALVE MARKET, BY MODULATION TYPE, 2020-2032 ($MILLION)
- TABLE 54. NORTH AMERICA AUTOMOTIVE ELECTRIC COOLANT VALVE MARKET, BY MODULATION TYPE, 2020-2032 (MILLION UNITS)
- TABLE 55. NORTH AMERICA AUTOMOTIVE ELECTRIC COOLANT VALVE MARKET, BY COMMUNICATION PROTOCOL, 2020-2032 ($MILLION)
- TABLE 56. NORTH AMERICA AUTOMOTIVE ELECTRIC COOLANT VALVE MARKET, BY COMMUNICATION PROTOCOL, 2020-2032 (MILLION UNITS)
- TABLE 57. NORTH AMERICA AUTOMOTIVE ELECTRIC COOLANT VALVE MARKET, BY VEHICLE TYPE, 2020-2032 ($MILLION)
- TABLE 58. NORTH AMERICA AUTOMOTIVE ELECTRIC COOLANT VALVE MARKET, BY VEHICLE TYPE, 2020-2032 (MILLION UNITS)
- TABLE 59. NORTH AMERICA AUTOMOTIVE ELECTRIC COOLANT VALVE MARKET, BY VOLTAGE, 2020-2032 ($MILLION)
- TABLE 60. NORTH AMERICA AUTOMOTIVE ELECTRIC COOLANT VALVE MARKET, BY VOLTAGE, 2020-2032 (MILLION UNITS)
- TABLE 61. NORTH AMERICA AUTOMOTIVE ELECTRIC COOLANT VALVE MARKET, BY COUNTRY, 2020-2032 ($MILLION)
- TABLE 62. NORTH AMERICA AUTOMOTIVE ELECTRIC COOLANT VALVE MARKET, BY COUNTRY, 2020-2032 (MILLION UNITS)
- TABLE 63. U.S. AUTOMOTIVE ELECTRIC COOLANT VALVE MARKET, BY TYPE, 2020-2032 ($MILLION)
- TABLE 64. U.S. AUTOMOTIVE ELECTRIC COOLANT VALVE MARKET, BY TYPE, 2020-2032 (MILLION UNITS)
- TABLE 65. U.S. AUTOMOTIVE ELECTRIC COOLANT VALVE MARKET, BY MODULATION TYPE, 2020-2032 ($MILLION)
- TABLE 66. U.S. AUTOMOTIVE ELECTRIC COOLANT VALVE MARKET, BY MODULATION TYPE, 2020-2032 (MILLION UNITS)
- TABLE 67. U.S. AUTOMOTIVE ELECTRIC COOLANT VALVE MARKET, BY COMMUNICATION PROTOCOL, 2020-2032 ($MILLION)
- TABLE 68. U.S. AUTOMOTIVE ELECTRIC COOLANT VALVE MARKET, BY COMMUNICATION PROTOCOL, 2020-2032 (MILLION UNITS)
- TABLE 69. U.S. AUTOMOTIVE ELECTRIC COOLANT VALVE MARKET, BY VEHICLE TYPE, 2020-2032 ($MILLION)
- TABLE 70. U.S. AUTOMOTIVE ELECTRIC COOLANT VALVE MARKET, BY VEHICLE TYPE, 2020-2032 (MILLION UNITS)
- TABLE 71. U.S. AUTOMOTIVE ELECTRIC COOLANT VALVE MARKET, BY VOLTAGE, 2020-2032 ($MILLION)
- TABLE 72. U.S. AUTOMOTIVE ELECTRIC COOLANT VALVE MARKET, BY VOLTAGE, 2020-2032 (MILLION UNITS)
- TABLE 73. CANADA AUTOMOTIVE ELECTRIC COOLANT VALVE MARKET, BY TYPE, 2020-2032 ($MILLION)
- TABLE 74. CANADA AUTOMOTIVE ELECTRIC COOLANT VALVE MARKET, BY TYPE, 2020-2032 (MILLION UNITS)
- TABLE 75. CANADA AUTOMOTIVE ELECTRIC COOLANT VALVE MARKET, BY MODULATION TYPE, 2020-2032 ($MILLION)
- TABLE 76. CANADA AUTOMOTIVE ELECTRIC COOLANT VALVE MARKET, BY MODULATION TYPE, 2020-2032 (MILLION UNITS)
- TABLE 77. CANADA AUTOMOTIVE ELECTRIC COOLANT VALVE MARKET, BY COMMUNICATION PROTOCOL, 2020-2032 ($MILLION)
- TABLE 78. CANADA AUTOMOTIVE ELECTRIC COOLANT VALVE MARKET, BY COMMUNICATION PROTOCOL, 2020-2032 (MILLION UNITS)
- TABLE 79. CANADA AUTOMOTIVE ELECTRIC COOLANT VALVE MARKET, BY VEHICLE TYPE, 2020-2032 ($MILLION)
- TABLE 80. CANADA AUTOMOTIVE ELECTRIC COOLANT VALVE MARKET, BY VEHICLE TYPE, 2020-2032 (MILLION UNITS)
- TABLE 81. CANADA AUTOMOTIVE ELECTRIC COOLANT VALVE MARKET, BY VOLTAGE, 2020-2032 ($MILLION)
- TABLE 82. CANADA AUTOMOTIVE ELECTRIC COOLANT VALVE MARKET, BY VOLTAGE, 2020-2032 (MILLION UNITS)
- TABLE 83. MEXICO AUTOMOTIVE ELECTRIC COOLANT VALVE MARKET, BY TYPE, 2020-2032 ($MILLION)
- TABLE 84. MEXICO AUTOMOTIVE ELECTRIC COOLANT VALVE MARKET, BY TYPE, 2020-2032 (MILLION UNITS)
- TABLE 85. MEXICO AUTOMOTIVE ELECTRIC COOLANT VALVE MARKET, BY MODULATION TYPE, 2020-2032 ($MILLION)
- TABLE 86. MEXICO AUTOMOTIVE ELECTRIC COOLANT VALVE MARKET, BY MODULATION TYPE, 2020-2032 (MILLION UNITS)
- TABLE 87. MEXICO AUTOMOTIVE ELECTRIC COOLANT VALVE MARKET, BY COMMUNICATION PROTOCOL, 2020-2032 ($MILLION)
- TABLE 88. MEXICO AUTOMOTIVE ELECTRIC COOLANT VALVE MARKET, BY COMMUNICATION PROTOCOL, 2020-2032 (MILLION UNITS)
- TABLE 89. MEXICO AUTOMOTIVE ELECTRIC COOLANT VALVE MARKET, BY VEHICLE TYPE, 2020-2032 ($MILLION)
- TABLE 90. MEXICO AUTOMOTIVE ELECTRIC COOLANT VALVE MARKET, BY VEHICLE TYPE, 2020-2032 (MILLION UNITS)
- TABLE 91. MEXICO AUTOMOTIVE ELECTRIC COOLANT VALVE MARKET, BY VOLTAGE, 2020-2032 ($MILLION)
- TABLE 92. MEXICO AUTOMOTIVE ELECTRIC COOLANT VALVE MARKET, BY VOLTAGE, 2020-2032 (MILLION UNITS)
- TABLE 93. EUROPE AUTOMOTIVE ELECTRIC COOLANT VALVE MARKET, BY TYPE, 2020-2032 ($MILLION)
- TABLE 94. EUROPE AUTOMOTIVE ELECTRIC COOLANT VALVE MARKET, BY TYPE, 2020-2032 (MILLION UNITS)
- TABLE 95. EUROPE AUTOMOTIVE ELECTRIC COOLANT VALVE MARKET, BY MODULATION TYPE, 2020-2032 ($MILLION)
- TABLE 96. EUROPE AUTOMOTIVE ELECTRIC COOLANT VALVE MARKET, BY MODULATION TYPE, 2020-2032 (MILLION UNITS)
- TABLE 97. EUROPE AUTOMOTIVE ELECTRIC COOLANT VALVE MARKET, BY COMMUNICATION PROTOCOL, 2020-2032 ($MILLION)
- TABLE 98. EUROPE AUTOMOTIVE ELECTRIC COOLANT VALVE MARKET, BY COMMUNICATION PROTOCOL, 2020-2032 (MILLION UNITS)
- TABLE 99. EUROPE AUTOMOTIVE ELECTRIC COOLANT VALVE MARKET, BY VEHICLE TYPE, 2020-2032 ($MILLION)
- TABLE 100. EUROPE AUTOMOTIVE ELECTRIC COOLANT VALVE MARKET, BY VEHICLE TYPE, 2020-2032 (MILLION UNITS)
- TABLE 101. EUROPE AUTOMOTIVE ELECTRIC COOLANT VALVE MARKET, BY VOLTAGE, 2020-2032 ($MILLION)
- TABLE 102. EUROPE AUTOMOTIVE ELECTRIC COOLANT VALVE MARKET, BY VOLTAGE, 2020-2032 (MILLION UNITS)
- TABLE 103. EUROPE AUTOMOTIVE ELECTRIC COOLANT VALVE MARKET, BY COUNTRY, 2020-2032 ($MILLION)
- TABLE 104. EUROPE AUTOMOTIVE ELECTRIC COOLANT VALVE MARKET, BY COUNTRY, 2020-2032 (MILLION UNITS)
- TABLE 105. UK AUTOMOTIVE ELECTRIC COOLANT VALVE MARKET, BY TYPE, 2020-2032 ($MILLION)
- TABLE 106. UK AUTOMOTIVE ELECTRIC COOLANT VALVE MARKET, BY TYPE, 2020-2032 (MILLION UNITS)
- TABLE 107. UK AUTOMOTIVE ELECTRIC COOLANT VALVE MARKET, BY MODULATION TYPE, 2020-2032 ($MILLION)
- TABLE 108. UK AUTOMOTIVE ELECTRIC COOLANT VALVE MARKET, BY MODULATION TYPE, 2020-2032 (MILLION UNITS)
- TABLE 109. UK AUTOMOTIVE ELECTRIC COOLANT VALVE MARKET, BY COMMUNICATION PROTOCOL, 2020-2032 ($MILLION)
- TABLE 110. UK AUTOMOTIVE ELECTRIC COOLANT VALVE MARKET, BY COMMUNICATION PROTOCOL, 2020-2032 (MILLION UNITS)
- TABLE 111. UK AUTOMOTIVE ELECTRIC COOLANT VALVE MARKET, BY VEHICLE TYPE, 2020-2032 ($MILLION)
- TABLE 112. UK AUTOMOTIVE ELECTRIC COOLANT VALVE MARKET, BY VEHICLE TYPE, 2020-2032 (MILLION UNITS)
- TABLE 113. UK AUTOMOTIVE ELECTRIC COOLANT VALVE MARKET, BY VOLTAGE, 2020-2032 ($MILLION)
- TABLE 114. UK AUTOMOTIVE ELECTRIC COOLANT VALVE MARKET, BY VOLTAGE, 2020-2032 (MILLION UNITS)
- TABLE 115. GERMANY AUTOMOTIVE ELECTRIC COOLANT VALVE MARKET, BY TYPE, 2020-2032 ($MILLION)
- TABLE 116. GERMANY AUTOMOTIVE ELECTRIC COOLANT VALVE MARKET, BY TYPE, 2020-2032 (MILLION UNITS)
- TABLE 117. GERMANY AUTOMOTIVE ELECTRIC COOLANT VALVE MARKET, BY MODULATION TYPE, 2020-2032 ($MILLION)
- TABLE 118. GERMANY AUTOMOTIVE ELECTRIC COOLANT VALVE MARKET, BY MODULATION TYPE, 2020-2032 (MILLION UNITS)
- TABLE 119. GERMANY AUTOMOTIVE ELECTRIC COOLANT VALVE MARKET, BY COMMUNICATION PROTOCOL, 2020-2032 ($MILLION)
- TABLE 120. GERMANY AUTOMOTIVE ELECTRIC COOLANT VALVE MARKET, BY COMMUNICATION PROTOCOL, 2020-2032 (MILLION UNITS)
- TABLE 121. GERMANY AUTOMOTIVE ELECTRIC COOLANT VALVE MARKET, BY VEHICLE TYPE, 2020-2032 ($MILLION)
- TABLE 122. GERMANY AUTOMOTIVE ELECTRIC COOLANT VALVE MARKET, BY VEHICLE TYPE, 2020-2032 (MILLION UNITS)
- TABLE 123. GERMANY AUTOMOTIVE ELECTRIC COOLANT VALVE MARKET, BY VOLTAGE, 2020-2032 ($MILLION)
- TABLE 124. GERMANY AUTOMOTIVE ELECTRIC COOLANT VALVE MARKET, BY VOLTAGE, 2020-2032 (MILLION UNITS)
- TABLE 125. FRANCE AUTOMOTIVE ELECTRIC COOLANT VALVE MARKET, BY TYPE, 2020-2032 ($MILLION)
- TABLE 126. FRANCE AUTOMOTIVE ELECTRIC COOLANT VALVE MARKET, BY TYPE, 2020-2032 (MILLION UNITS)
- TABLE 127. FRANCE AUTOMOTIVE ELECTRIC COOLANT VALVE MARKET, BY MODULATION TYPE, 2020-2032 ($MILLION)
- TABLE 128. FRANCE AUTOMOTIVE ELECTRIC COOLANT VALVE MARKET, BY MODULATION TYPE, 2020-2032 (MILLION UNITS)
- TABLE 129. FRANCE AUTOMOTIVE ELECTRIC COOLANT VALVE MARKET, BY COMMUNICATION PROTOCOL, 2020-2032 ($MILLION)
- TABLE 130. FRANCE AUTOMOTIVE ELECTRIC COOLANT VALVE MARKET, BY COMMUNICATION PROTOCOL, 2020-2032 (MILLION UNITS)
- TABLE 131. FRANCE AUTOMOTIVE ELECTRIC COOLANT VALVE MARKET, BY VEHICLE TYPE, 2020-2032 ($MILLION)
- TABLE 132. FRANCE AUTOMOTIVE ELECTRIC COOLANT VALVE MARKET, BY VEHICLE TYPE, 2020-2032 (MILLION UNITS)
- TABLE 133. FRANCE AUTOMOTIVE ELECTRIC COOLANT VALVE MARKET, BY VOLTAGE, 2020-2032 ($MILLION)
- TABLE 134. FRANCE AUTOMOTIVE ELECTRIC COOLANT VALVE MARKET, BY VOLTAGE, 2020-2032 (MILLION UNITS)
- TABLE 135. ITALY AUTOMOTIVE ELECTRIC COOLANT VALVE MARKET, BY TYPE, 2020-2032 ($MILLION)
- TABLE 136. ITALY AUTOMOTIVE ELECTRIC COOLANT VALVE MARKET, BY TYPE, 2020-2032 (MILLION UNITS)
- TABLE 137. ITALY AUTOMOTIVE ELECTRIC COOLANT VALVE MARKET, BY MODULATION TYPE, 2020-2032 ($MILLION)
- TABLE 138. ITALY AUTOMOTIVE ELECTRIC COOLANT VALVE MARKET, BY MODULATION TYPE, 2020-2032 (MILLION UNITS)
- TABLE 139. ITALY AUTOMOTIVE ELECTRIC COOLANT VALVE MARKET, BY COMMUNICATION PROTOCOL, 2020-2032 ($MILLION)
- TABLE 140. ITALY AUTOMOTIVE ELECTRIC COOLANT VALVE MARKET, BY COMMUNICATION PROTOCOL, 2020-2032 (MILLION UNITS)
- TABLE 141. ITALY AUTOMOTIVE ELECTRIC COOLANT VALVE MARKET, BY VEHICLE TYPE, 2020-2032 ($MILLION)
- TABLE 142. ITALY AUTOMOTIVE ELECTRIC COOLANT VALVE MARKET, BY VEHICLE TYPE, 2020-2032 (MILLION UNITS)
- TABLE 143. ITALY AUTOMOTIVE ELECTRIC COOLANT VALVE MARKET, BY VOLTAGE, 2020-2032 ($MILLION)
- TABLE 144. ITALY AUTOMOTIVE ELECTRIC COOLANT VALVE MARKET, BY VOLTAGE, 2020-2032 (MILLION UNITS)
- TABLE 145. SPAIN AUTOMOTIVE ELECTRIC COOLANT VALVE MARKET, BY TYPE, 2020-2032 ($MILLION)
- TABLE 146. SPAIN AUTOMOTIVE ELECTRIC COOLANT VALVE MARKET, BY TYPE, 2020-2032 (MILLION UNITS)
- TABLE 147. SPAIN AUTOMOTIVE ELECTRIC COOLANT VALVE MARKET, BY MODULATION TYPE, 2020-2032 ($MILLION)
- TABLE 148. SPAIN AUTOMOTIVE ELECTRIC COOLANT VALVE MARKET, BY MODULATION TYPE, 2020-2032 (MILLION UNITS)
- TABLE 149. SPAIN AUTOMOTIVE ELECTRIC COOLANT VALVE MARKET, BY COMMUNICATION PROTOCOL, 2020-2032 ($MILLION)
- TABLE 150. SPAIN AUTOMOTIVE ELECTRIC COOLANT VALVE MARKET, BY COMMUNICATION PROTOCOL, 2020-2032 (MILLION UNITS)
- TABLE 151. SPAIN AUTOMOTIVE ELECTRIC COOLANT VALVE MARKET, BY VEHICLE TYPE, 2020-2032 ($MILLION)
- TABLE 152. SPAIN AUTOMOTIVE ELECTRIC COOLANT VALVE MARKET, BY VEHICLE TYPE, 2020-2032 (MILLION UNITS)
- TABLE 153. SPAIN AUTOMOTIVE ELECTRIC COOLANT VALVE MARKET, BY VOLTAGE, 2020-2032 ($MILLION)
- TABLE 154. SPAIN AUTOMOTIVE ELECTRIC COOLANT VALVE MARKET, BY VOLTAGE, 2020-2032 (MILLION UNITS)
- TABLE 155. REST OF EUROPE AUTOMOTIVE ELECTRIC COOLANT VALVE MARKET, BY TYPE, 2020-2032 ($MILLION)
- TABLE 156. REST OF EUROPE AUTOMOTIVE ELECTRIC COOLANT VALVE MARKET, BY TYPE, 2020-2032 (MILLION UNITS)
- TABLE 157. REST OF EUROPE AUTOMOTIVE ELECTRIC COOLANT VALVE MARKET, BY MODULATION TYPE, 2020-2032 ($MILLION)
- TABLE 158. REST OF EUROPE AUTOMOTIVE ELECTRIC COOLANT VALVE MARKET, BY MODULATION TYPE, 2020-2032 (MILLION UNITS)
- TABLE 159. REST OF EUROPE AUTOMOTIVE ELECTRIC COOLANT VALVE MARKET, BY COMMUNICATION PROTOCOL, 2020-2032 ($MILLION)
- TABLE 160. REST OF EUROPE AUTOMOTIVE ELECTRIC COOLANT VALVE MARKET, BY COMMUNICATION PROTOCOL, 2020-2032 (MILLION UNITS)
- TABLE 161. REST OF EUROPE AUTOMOTIVE ELECTRIC COOLANT VALVE MARKET, BY VEHICLE TYPE, 2020-2032 ($MILLION)
- TABLE 162. REST OF EUROPE AUTOMOTIVE ELECTRIC COOLANT VALVE MARKET, BY VEHICLE TYPE, 2020-2032 (MILLION UNITS)
- TABLE 163. REST OF EUROPE AUTOMOTIVE ELECTRIC COOLANT VALVE MARKET, BY VOLTAGE, 2020-2032 ($MILLION)
- TABLE 164. REST OF EUROPE AUTOMOTIVE ELECTRIC COOLANT VALVE MARKET, BY VOLTAGE, 2020-2032 (MILLION UNITS)
- TABLE 165. ASIA-PACIFIC AUTOMOTIVE ELECTRIC COOLANT VALVE MARKET, BY TYPE, 2020-2032 ($MILLION)
- TABLE 166. ASIA-PACIFIC AUTOMOTIVE ELECTRIC COOLANT VALVE MARKET, BY TYPE, 2020-2032 (MILLION UNITS)
- TABLE 167. ASIA-PACIFIC AUTOMOTIVE ELECTRIC COOLANT VALVE MARKET, BY MODULATION TYPE, 2020-2032 ($MILLION)
- TABLE 168. ASIA-PACIFIC AUTOMOTIVE ELECTRIC COOLANT VALVE MARKET, BY MODULATION TYPE, 2020-2032 (MILLION UNITS)
- TABLE 169. ASIA-PACIFIC AUTOMOTIVE ELECTRIC COOLANT VALVE MARKET, BY COMMUNICATION PROTOCOL, 2020-2032 ($MILLION)
- TABLE 170. ASIA-PACIFIC AUTOMOTIVE ELECTRIC COOLANT VALVE MARKET, BY COMMUNICATION PROTOCOL, 2020-2032 (MILLION UNITS)
- TABLE 171. ASIA-PACIFIC AUTOMOTIVE ELECTRIC COOLANT VALVE MARKET, BY VEHICLE TYPE, 2020-2032 ($MILLION)
- TABLE 172. ASIA-PACIFIC AUTOMOTIVE ELECTRIC COOLANT VALVE MARKET, BY VEHICLE TYPE, 2020-2032 (MILLION UNITS)
- TABLE 173. ASIA-PACIFIC AUTOMOTIVE ELECTRIC COOLANT VALVE MARKET, BY VOLTAGE, 2020-2032 ($MILLION)
- TABLE 174. ASIA-PACIFIC AUTOMOTIVE ELECTRIC COOLANT VALVE MARKET, BY VOLTAGE, 2020-2032 (MILLION UNITS)
- TABLE 175. ASIA-PACIFIC AUTOMOTIVE ELECTRIC COOLANT VALVE MARKET, BY COUNTRY, 2020-2032 ($MILLION)
- TABLE 176. ASIA-PACIFIC AUTOMOTIVE ELECTRIC COOLANT VALVE MARKET, BY COUNTRY, 2020-2032 (MILLION UNITS)
- TABLE 177. CHINA AUTOMOTIVE ELECTRIC COOLANT VALVE MARKET, BY TYPE, 2020-2032 ($MILLION)
- TABLE 178. CHINA AUTOMOTIVE ELECTRIC COOLANT VALVE MARKET, BY TYPE, 2020-2032 (MILLION UNITS)
- TABLE 179. CHINA AUTOMOTIVE ELECTRIC COOLANT VALVE MARKET, BY MODULATION TYPE, 2020-2032 ($MILLION)
- TABLE 180. CHINA AUTOMOTIVE ELECTRIC COOLANT VALVE MARKET, BY MODULATION TYPE, 2020-2032 (MILLION UNITS)
- TABLE 181. CHINA AUTOMOTIVE ELECTRIC COOLANT VALVE MARKET, BY COMMUNICATION PROTOCOL, 2020-2032 ($MILLION)
- TABLE 182. CHINA AUTOMOTIVE ELECTRIC COOLANT VALVE MARKET, BY COMMUNICATION PROTOCOL, 2020-2032 (MILLION UNITS)
- TABLE 183. CHINA AUTOMOTIVE ELECTRIC COOLANT VALVE MARKET, BY VEHICLE TYPE, 2020-2032 ($MILLION)
- TABLE 184. CHINA AUTOMOTIVE ELECTRIC COOLANT VALVE MARKET, BY VEHICLE TYPE, 2020-2032 (MILLION UNITS)
- TABLE 185. CHINA AUTOMOTIVE ELECTRIC COOLANT VALVE MARKET, BY VOLTAGE, 2020-2032 ($MILLION)
- TABLE 186. CHINA AUTOMOTIVE ELECTRIC COOLANT VALVE MARKET, BY VOLTAGE, 2020-2032 (MILLION UNITS)
- TABLE 187. INDIA AUTOMOTIVE ELECTRIC COOLANT VALVE MARKET, BY TYPE, 2020-2032 ($MILLION)
- TABLE 188. INDIA AUTOMOTIVE ELECTRIC COOLANT VALVE MARKET, BY TYPE, 2020-2032 (MILLION UNITS)
- TABLE 189. INDIA AUTOMOTIVE ELECTRIC COOLANT VALVE MARKET, BY MODULATION TYPE, 2020-2032 ($MILLION)
- TABLE 190. INDIA AUTOMOTIVE ELECTRIC COOLANT VALVE MARKET, BY MODULATION TYPE, 2020-2032 (MILLION UNITS)
- TABLE 191. INDIA AUTOMOTIVE ELECTRIC COOLANT VALVE MARKET, BY COMMUNICATION PROTOCOL, 2020-2032 ($MILLION)
- TABLE 192. INDIA AUTOMOTIVE ELECTRIC COOLANT VALVE MARKET, BY COMMUNICATION PROTOCOL, 2020-2032 (MILLION UNITS)
- TABLE 193. INDIA AUTOMOTIVE ELECTRIC COOLANT VALVE MARKET, BY VEHICLE TYPE, 2020-2032 ($MILLION)
- TABLE 194. INDIA AUTOMOTIVE ELECTRIC COOLANT VALVE MARKET, BY VEHICLE TYPE, 2020-2032 (MILLION UNITS)
- TABLE 195. INDIA AUTOMOTIVE ELECTRIC COOLANT VALVE MARKET, BY VOLTAGE, 2020-2032 ($MILLION)
- TABLE 196. INDIA AUTOMOTIVE ELECTRIC COOLANT VALVE MARKET, BY VOLTAGE, 2020-2032 (MILLION UNITS)
- TABLE 197. JAPAN AUTOMOTIVE ELECTRIC COOLANT VALVE MARKET, BY TYPE, 2020-2032 ($MILLION)
- TABLE 198. JAPAN AUTOMOTIVE ELECTRIC COOLANT VALVE MARKET, BY TYPE, 2020-2032 (MILLION UNITS)
- TABLE 199. JAPAN AUTOMOTIVE ELECTRIC COOLANT VALVE MARKET, BY MODULATION TYPE, 2020-2032 ($MILLION)
- TABLE 200. JAPAN AUTOMOTIVE ELECTRIC COOLANT VALVE MARKET, BY MODULATION TYPE, 2020-2032 (MILLION UNITS)
- TABLE 201. JAPAN AUTOMOTIVE ELECTRIC COOLANT VALVE MARKET, BY COMMUNICATION PROTOCOL, 2020-2032 ($MILLION)
- TABLE 202. JAPAN AUTOMOTIVE ELECTRIC COOLANT VALVE MARKET, BY COMMUNICATION PROTOCOL, 2020-2032 (MILLION UNITS)
- TABLE 203. JAPAN AUTOMOTIVE ELECTRIC COOLANT VALVE MARKET, BY VEHICLE TYPE, 2020-2032 ($MILLION)
- TABLE 204. JAPAN AUTOMOTIVE ELECTRIC COOLANT VALVE MARKET, BY VEHICLE TYPE, 2020-2032 (MILLION UNITS)
- TABLE 205. JAPAN AUTOMOTIVE ELECTRIC COOLANT VALVE MARKET, BY VOLTAGE, 2020-2032 ($MILLION)
- TABLE 206. JAPAN AUTOMOTIVE ELECTRIC COOLANT VALVE MARKET, BY VOLTAGE, 2020-2032 (MILLION UNITS)
- TABLE 207. SOUTH KOREA AUTOMOTIVE ELECTRIC COOLANT VALVE MARKET, BY TYPE, 2020-2032 ($MILLION)
- TABLE 208. SOUTH KOREA AUTOMOTIVE ELECTRIC COOLANT VALVE MARKET, BY TYPE, 2020-2032 (MILLION UNITS)
- TABLE 209. SOUTH KOREA AUTOMOTIVE ELECTRIC COOLANT VALVE MARKET, BY MODULATION TYPE, 2020-2032 ($MILLION)
- TABLE 210. SOUTH KOREA AUTOMOTIVE ELECTRIC COOLANT VALVE MARKET, BY MODULATION TYPE, 2020-2032 (MILLION UNITS)
- TABLE 211. SOUTH KOREA AUTOMOTIVE ELECTRIC COOLANT VALVE MARKET, BY COMMUNICATION PROTOCOL, 2020-2032 ($MILLION)
- TABLE 212. SOUTH KOREA AUTOMOTIVE ELECTRIC COOLANT VALVE MARKET, BY COMMUNICATION PROTOCOL, 2020-2032 (MILLION UNITS)
- TABLE 213. SOUTH KOREA AUTOMOTIVE ELECTRIC COOLANT VALVE MARKET, BY VEHICLE TYPE, 2020-2032 ($MILLION)
- TABLE 214. SOUTH KOREA AUTOMOTIVE ELECTRIC COOLANT VALVE MARKET, BY VEHICLE TYPE, 2020-2032 (MILLION UNITS)
- TABLE 215. SOUTH KOREA AUTOMOTIVE ELECTRIC COOLANT VALVE MARKET, BY VOLTAGE, 2020-2032 ($MILLION)
- TABLE 216. SOUTH KOREA AUTOMOTIVE ELECTRIC COOLANT VALVE MARKET, BY VOLTAGE, 2020-2032 (MILLION UNITS)
- TABLE 217. REST OF ASIA-PACIFIC AUTOMOTIVE ELECTRIC COOLANT VALVE MARKET, BY TYPE, 2020-2032 ($MILLION)
- TABLE 218. REST OF ASIA-PACIFIC AUTOMOTIVE ELECTRIC COOLANT VALVE MARKET, BY TYPE, 2020-2032 (MILLION UNITS)
- TABLE 219. REST OF ASIA-PACIFIC AUTOMOTIVE ELECTRIC COOLANT VALVE MARKET, BY MODULATION TYPE, 2020-2032 ($MILLION)
- TABLE 220. REST OF ASIA-PACIFIC AUTOMOTIVE ELECTRIC COOLANT VALVE MARKET, BY MODULATION TYPE, 2020-2032 (MILLION UNITS)
- TABLE 221. REST OF ASIA-PACIFIC AUTOMOTIVE ELECTRIC COOLANT VALVE MARKET, BY COMMUNICATION PROTOCOL, 2020-2032 ($MILLION)
- TABLE 222. REST OF ASIA-PACIFIC AUTOMOTIVE ELECTRIC COOLANT VALVE MARKET, BY COMMUNICATION PROTOCOL, 2020-2032 (MILLION UNITS)
- TABLE 223. REST OF ASIA-PACIFIC AUTOMOTIVE ELECTRIC COOLANT VALVE MARKET, BY VEHICLE TYPE, 2020-2032 ($MILLION)
- TABLE 224. REST OF ASIA-PACIFIC AUTOMOTIVE ELECTRIC COOLANT VALVE MARKET, BY VEHICLE TYPE, 2020-2032 (MILLION UNITS)
- TABLE 225. REST OF ASIA-PACIFIC AUTOMOTIVE ELECTRIC COOLANT VALVE MARKET, BY VOLTAGE, 2020-2032 ($MILLION)
- TABLE 226. REST OF ASIA-PACIFIC AUTOMOTIVE ELECTRIC COOLANT VALVE MARKET, BY VOLTAGE, 2020-2032 (MILLION UNITS)
- TABLE 227. LAMEA AUTOMOTIVE ELECTRIC COOLANT VALVE MARKET, BY TYPE, 2020-2032 ($MILLION)
- TABLE 228. LAMEA AUTOMOTIVE ELECTRIC COOLANT VALVE MARKET, BY TYPE, 2020-2032 (MILLION UNITS)
- TABLE 229. LAMEA AUTOMOTIVE ELECTRIC COOLANT VALVE MARKET, BY MODULATION TYPE, 2020-2032 ($MILLION)
- TABLE 230. LAMEA AUTOMOTIVE ELECTRIC COOLANT VALVE MARKET, BY MODULATION TYPE, 2020-2032 (MILLION UNITS)
- TABLE 231. LAMEA AUTOMOTIVE ELECTRIC COOLANT VALVE MARKET, BY COMMUNICATION PROTOCOL, 2020-2032 ($MILLION)
- TABLE 232. LAMEA AUTOMOTIVE ELECTRIC COOLANT VALVE MARKET, BY COMMUNICATION PROTOCOL, 2020-2032 (MILLION UNITS)
- TABLE 233. LAMEA AUTOMOTIVE ELECTRIC COOLANT VALVE MARKET, BY VEHICLE TYPE, 2020-2032 ($MILLION)
- TABLE 234. LAMEA AUTOMOTIVE ELECTRIC COOLANT VALVE MARKET, BY VEHICLE TYPE, 2020-2032 (MILLION UNITS)
- TABLE 235. LAMEA AUTOMOTIVE ELECTRIC COOLANT VALVE MARKET, BY VOLTAGE, 2020-2032 ($MILLION)
- TABLE 236. LAMEA AUTOMOTIVE ELECTRIC COOLANT VALVE MARKET, BY VOLTAGE, 2020-2032 (MILLION UNITS)
- TABLE 237. LAMEA AUTOMOTIVE ELECTRIC COOLANT VALVE MARKET, BY COUNTRY, 2020-2032 ($MILLION)
- TABLE 238. LAMEA AUTOMOTIVE ELECTRIC COOLANT VALVE MARKET, BY COUNTRY, 2020-2032 (MILLION UNITS)
- TABLE 239. LATIN AMERICA AUTOMOTIVE ELECTRIC COOLANT VALVE MARKET, BY TYPE, 2020-2032 ($MILLION)
- TABLE 240. LATIN AMERICA AUTOMOTIVE ELECTRIC COOLANT VALVE MARKET, BY TYPE, 2020-2032 (MILLION UNITS)
- TABLE 241. LATIN AMERICA AUTOMOTIVE ELECTRIC COOLANT VALVE MARKET, BY MODULATION TYPE, 2020-2032 ($MILLION)
- TABLE 242. LATIN AMERICA AUTOMOTIVE ELECTRIC COOLANT VALVE MARKET, BY MODULATION TYPE, 2020-2032 (MILLION UNITS)
- TABLE 243. LATIN AMERICA AUTOMOTIVE ELECTRIC COOLANT VALVE MARKET, BY COMMUNICATION PROTOCOL, 2020-2032 ($MILLION)
- TABLE 244. LATIN AMERICA AUTOMOTIVE ELECTRIC COOLANT VALVE MARKET, BY COMMUNICATION PROTOCOL, 2020-2032 (MILLION UNITS)
- TABLE 245. LATIN AMERICA AUTOMOTIVE ELECTRIC COOLANT VALVE MARKET, BY VEHICLE TYPE, 2020-2032 ($MILLION)
- TABLE 246. LATIN AMERICA AUTOMOTIVE ELECTRIC COOLANT VALVE MARKET, BY VEHICLE TYPE, 2020-2032 (MILLION UNITS)
- TABLE 247. LATIN AMERICA AUTOMOTIVE ELECTRIC COOLANT VALVE MARKET, BY VOLTAGE, 2020-2032 ($MILLION)
- TABLE 248. LATIN AMERICA AUTOMOTIVE ELECTRIC COOLANT VALVE MARKET, BY VOLTAGE, 2020-2032 (MILLION UNITS)
- TABLE 249. MIDDLE EAST AUTOMOTIVE ELECTRIC COOLANT VALVE MARKET, BY TYPE, 2020-2032 ($MILLION)
- TABLE 250. MIDDLE EAST AUTOMOTIVE ELECTRIC COOLANT VALVE MARKET, BY TYPE, 2020-2032 (MILLION UNITS)
- TABLE 251. MIDDLE EAST AUTOMOTIVE ELECTRIC COOLANT VALVE MARKET, BY MODULATION TYPE, 2020-2032 ($MILLION)
- TABLE 252. MIDDLE EAST AUTOMOTIVE ELECTRIC COOLANT VALVE MARKET, BY MODULATION TYPE, 2020-2032 (MILLION UNITS)
- TABLE 253. MIDDLE EAST AUTOMOTIVE ELECTRIC COOLANT VALVE MARKET, BY COMMUNICATION PROTOCOL, 2020-2032 ($MILLION)
- TABLE 254. MIDDLE EAST AUTOMOTIVE ELECTRIC COOLANT VALVE MARKET, BY COMMUNICATION PROTOCOL, 2020-2032 (MILLION UNITS)
- TABLE 255. MIDDLE EAST AUTOMOTIVE ELECTRIC COOLANT VALVE MARKET, BY VEHICLE TYPE, 2020-2032 ($MILLION)
- TABLE 256. MIDDLE EAST AUTOMOTIVE ELECTRIC COOLANT VALVE MARKET, BY VEHICLE TYPE, 2020-2032 (MILLION UNITS)
- TABLE 257. MIDDLE EAST AUTOMOTIVE ELECTRIC COOLANT VALVE MARKET, BY VOLTAGE, 2020-2032 ($MILLION)
- TABLE 258. MIDDLE EAST AUTOMOTIVE ELECTRIC COOLANT VALVE MARKET, BY VOLTAGE, 2020-2032 (MILLION UNITS)
- TABLE 259. AFRICA AUTOMOTIVE ELECTRIC COOLANT VALVE MARKET, BY TYPE, 2020-2032 ($MILLION)
- TABLE 260. AFRICA AUTOMOTIVE ELECTRIC COOLANT VALVE MARKET, BY TYPE, 2020-2032 (MILLION UNITS)
- TABLE 261. AFRICA AUTOMOTIVE ELECTRIC COOLANT VALVE MARKET, BY MODULATION TYPE, 2020-2032 ($MILLION)
- TABLE 262. AFRICA AUTOMOTIVE ELECTRIC COOLANT VALVE MARKET, BY MODULATION TYPE, 2020-2032 (MILLION UNITS)
- TABLE 263. AFRICA AUTOMOTIVE ELECTRIC COOLANT VALVE MARKET, BY COMMUNICATION PROTOCOL, 2020-2032 ($MILLION)
- TABLE 264. AFRICA AUTOMOTIVE ELECTRIC COOLANT VALVE MARKET, BY COMMUNICATION PROTOCOL, 2020-2032 (MILLION UNITS)
- TABLE 265. AFRICA AUTOMOTIVE ELECTRIC COOLANT VALVE MARKET, BY VEHICLE TYPE, 2020-2032 ($MILLION)
- TABLE 266. AFRICA AUTOMOTIVE ELECTRIC COOLANT VALVE MARKET, BY VEHICLE TYPE, 2020-2032 (MILLION UNITS)
- TABLE 267. AFRICA AUTOMOTIVE ELECTRIC COOLANT VALVE MARKET, BY VOLTAGE, 2020-2032 ($MILLION)
- TABLE 268. AFRICA AUTOMOTIVE ELECTRIC COOLANT VALVE MARKET, BY VOLTAGE, 2020-2032 (MILLION UNITS)
- TABLE 269. ZHEJIANG SANHUA AUTO MOTIVE CO., LTD: KEY EXECUTIVES
- TABLE 270. ZHEJIANG SANHUA AUTO MOTIVE CO., LTD: COMPANY SNAPSHOT
- TABLE 271. ZHEJIANG SANHUA AUTO MOTIVE CO., LTD: PRODUCT SEGMENTS
- TABLE 272. ZHEJIANG SANHUA AUTO MOTIVE CO., LTD: SERVICE SEGMENTS
- TABLE 273. ZHEJIANG SANHUA AUTO MOTIVE CO., LTD: PRODUCT PORTFOLIO
- TABLE 274. ZHEJIANG SANHUA AUTO MOTIVE CO., LTD: KEY STRATERGIES
- TABLE 275. ROBERTSHAW: KEY EXECUTIVES
- TABLE 276. ROBERTSHAW: COMPANY SNAPSHOT
- TABLE 277. ROBERTSHAW: PRODUCT SEGMENTS
- TABLE 278. ROBERTSHAW: SERVICE SEGMENTS
- TABLE 279. ROBERTSHAW: PRODUCT PORTFOLIO
- TABLE 280. ROBERTSHAW: KEY STRATERGIES
- TABLE 281. PV CLEAN MOBILITY TECHNOLOGIES: KEY EXECUTIVES
- TABLE 282. PV CLEAN MOBILITY TECHNOLOGIES: COMPANY SNAPSHOT
- TABLE 283. PV CLEAN MOBILITY TECHNOLOGIES: PRODUCT SEGMENTS
- TABLE 284. PV CLEAN MOBILITY TECHNOLOGIES: SERVICE SEGMENTS
- TABLE 285. PV CLEAN MOBILITY TECHNOLOGIES: PRODUCT PORTFOLIO
- TABLE 286. PV CLEAN MOBILITY TECHNOLOGIES: KEY STRATERGIES
- TABLE 287. SCHRADER-BRIDGEPORT INTERNATIONAL, INC.: KEY EXECUTIVES
- TABLE 288. SCHRADER-BRIDGEPORT INTERNATIONAL, INC.: COMPANY SNAPSHOT
- TABLE 289. SCHRADER-BRIDGEPORT INTERNATIONAL, INC.: PRODUCT SEGMENTS
- TABLE 290. SCHRADER-BRIDGEPORT INTERNATIONAL, INC.: SERVICE SEGMENTS
- TABLE 291. SCHRADER-BRIDGEPORT INTERNATIONAL, INC.: PRODUCT PORTFOLIO
- TABLE 292. SCHRADER-BRIDGEPORT INTERNATIONAL, INC.: KEY STRATERGIES
- TABLE 293. HANON SYSTEMS: KEY EXECUTIVES
- TABLE 294. HANON SYSTEMS: COMPANY SNAPSHOT
- TABLE 295. HANON SYSTEMS: PRODUCT SEGMENTS
- TABLE 296. HANON SYSTEMS: SERVICE SEGMENTS
- TABLE 297. HANON SYSTEMS: PRODUCT PORTFOLIO
- TABLE 298. HANON SYSTEMS: KEY STRATERGIES
- TABLE 299. MODINE MANUFACTURING COMPANY: KEY EXECUTIVES
- TABLE 300. MODINE MANUFACTURING COMPANY: COMPANY SNAPSHOT
- TABLE 301. MODINE MANUFACTURING COMPANY: PRODUCT SEGMENTS
- TABLE 302. MODINE MANUFACTURING COMPANY: SERVICE SEGMENTS
- TABLE 303. MODINE MANUFACTURING COMPANY: PRODUCT PORTFOLIO
- TABLE 304. MODINE MANUFACTURING COMPANY: KEY STRATERGIES
- TABLE 305. VITESCO TECHNOLOGIES GMBH: KEY EXECUTIVES
- TABLE 306. VITESCO TECHNOLOGIES GMBH: COMPANY SNAPSHOT
- TABLE 307. VITESCO TECHNOLOGIES GMBH: PRODUCT SEGMENTS
- TABLE 308. VITESCO TECHNOLOGIES GMBH: SERVICE SEGMENTS
- TABLE 309. VITESCO TECHNOLOGIES GMBH: PRODUCT PORTFOLIO
- TABLE 310. VITESCO TECHNOLOGIES GMBH: KEY STRATERGIES
- TABLE 311. HONEYWELL INTERNATIONAL INC.: KEY EXECUTIVES
- TABLE 312. HONEYWELL INTERNATIONAL INC.: COMPANY SNAPSHOT
- TABLE 313. HONEYWELL INTERNATIONAL INC.: PRODUCT SEGMENTS
- TABLE 314. HONEYWELL INTERNATIONAL INC.: SERVICE SEGMENTS
- TABLE 315. HONEYWELL INTERNATIONAL INC.: PRODUCT PORTFOLIO
- TABLE 316. HONEYWELL INTERNATIONAL INC.: KEY STRATERGIES
- TABLE 317. THERMAL MANAGEMENT SOLUTIONS GROUP LTD.: KEY EXECUTIVES
- TABLE 318. THERMAL MANAGEMENT SOLUTIONS GROUP LTD.: COMPANY SNAPSHOT
- TABLE 319. THERMAL MANAGEMENT SOLUTIONS GROUP LTD.: PRODUCT SEGMENTS
- TABLE 320. THERMAL MANAGEMENT SOLUTIONS GROUP LTD.: SERVICE SEGMENTS
- TABLE 321. THERMAL MANAGEMENT SOLUTIONS GROUP LTD.: PRODUCT PORTFOLIO
- TABLE 322. THERMAL MANAGEMENT SOLUTIONS GROUP LTD.: KEY STRATERGIES
- TABLE 323. VOSS FLUID GMBH: KEY EXECUTIVES
- TABLE 324. VOSS FLUID GMBH: COMPANY SNAPSHOT
- TABLE 325. VOSS FLUID GMBH: PRODUCT SEGMENTS
- TABLE 326. VOSS FLUID GMBH: SERVICE SEGMENTS
- TABLE 327. VOSS FLUID GMBH: PRODUCT PORTFOLIO
- TABLE 328. VOSS FLUID GMBH: KEY STRATERGIES
- TABLE 329. EMERSON ELECTRIC CO. (ASCO VALVE INC): KEY EXECUTIVES
- TABLE 330. EMERSON ELECTRIC CO. (ASCO VALVE INC): COMPANY SNAPSHOT
- TABLE 331. EMERSON ELECTRIC CO. (ASCO VALVE INC): PRODUCT SEGMENTS
- TABLE 332. EMERSON ELECTRIC CO. (ASCO VALVE INC): SERVICE SEGMENTS
- TABLE 333. EMERSON ELECTRIC CO. (ASCO VALVE INC): PRODUCT PORTFOLIO
- TABLE 334. EMERSON ELECTRIC CO. (ASCO VALVE INC): KEY STRATERGIES
- TABLE 335. SIEMENS AG: KEY EXECUTIVES
- TABLE 336. SIEMENS AG: COMPANY SNAPSHOT
- TABLE 337. SIEMENS AG: PRODUCT SEGMENTS
- TABLE 338. SIEMENS AG: SERVICE SEGMENTS
- TABLE 339. SIEMENS AG: PRODUCT PORTFOLIO
- TABLE 340. SIEMENS AG: KEY STRATERGIES
- TABLE 341. PARKER-HANNIFIN CORPORATION: KEY EXECUTIVES
- TABLE 342. PARKER-HANNIFIN CORPORATION: COMPANY SNAPSHOT
- TABLE 343. PARKER-HANNIFIN CORPORATION: PRODUCT SEGMENTS
- TABLE 344. PARKER-HANNIFIN CORPORATION: SERVICE SEGMENTS
- TABLE 345. PARKER-HANNIFIN CORPORATION: PRODUCT PORTFOLIO
- TABLE 346. PARKER-HANNIFIN CORPORATION: KEY STRATERGIES
- TABLE 347. RHEINMETALL AG: KEY EXECUTIVES
- TABLE 348. RHEINMETALL AG: COMPANY SNAPSHOT
- TABLE 349. RHEINMETALL AG: PRODUCT SEGMENTS
- TABLE 350. RHEINMETALL AG: SERVICE SEGMENTS
- TABLE 351. RHEINMETALL AG: PRODUCT PORTFOLIO
- TABLE 352. RHEINMETALL AG: KEY STRATERGIES
- TABLE 353. ROBERT BOSCH GMBH: KEY EXECUTIVES
- TABLE 354. ROBERT BOSCH GMBH: COMPANY SNAPSHOT
- TABLE 355. ROBERT BOSCH GMBH: PRODUCT SEGMENTS
- TABLE 356. ROBERT BOSCH GMBH: SERVICE SEGMENTS
- TABLE 357. ROBERT BOSCH GMBH: PRODUCT PORTFOLIO
- TABLE 358. ROBERT BOSCH GMBH: KEY STRATERGIES
- TABLE 359. CONTINENTAL AG: KEY EXECUTIVES
- TABLE 360. CONTINENTAL AG: COMPANY SNAPSHOT
- TABLE 361. CONTINENTAL AG: PRODUCT SEGMENTS
- TABLE 362. CONTINENTAL AG: SERVICE SEGMENTS
- TABLE 363. CONTINENTAL AG: PRODUCT PORTFOLIO
- TABLE 364. CONTINENTAL AG: KEY STRATERGIES
- TABLE 365. ROTEX AUTOMATION LIMITED: KEY EXECUTIVES
- TABLE 366. ROTEX AUTOMATION LIMITED: COMPANY SNAPSHOT
- TABLE 367. ROTEX AUTOMATION LIMITED: PRODUCT SEGMENTS
TAB
LIST OF FIGURES
- FIGURE 01. AUTOMOTIVE ELECTRIC COOLANT VALVE MARKET, 2020-2032
- FIGURE 02. SEGMENTATION OF AUTOMOTIVE ELECTRIC COOLANT VALVE MARKET,2020-2032
- FIGURE 03. TOP IMPACTING FACTORS IN AUTOMOTIVE ELECTRIC COOLANT VALVE MARKET (2020 TO 2032)
- FIGURE 04. TOP INVESTMENT POCKETS IN AUTOMOTIVE ELECTRIC COOLANT VALVE MARKET (2023-2032)
- FIGURE 05. BARGAINING POWER OF SUPPLIERS
- FIGURE 06. BARGAINING POWER OF BUYERS
- FIGURE 07. THREAT OF SUBSTITUTION
- FIGURE 08. THREAT OF SUBSTITUTION
- FIGURE 09. COMPETITIVE RIVALRY
- FIGURE 10. GLOBAL AUTOMOTIVE ELECTRIC COOLANT VALVE MARKET:DRIVERS, RESTRAINTS AND OPPORTUNITIES
- FIGURE 11. AUTOMOTIVE ELECTRIC COOLANT VALVE MARKET, BY TYPE, 2020 AND 2032(%)
- FIGURE 12. COMPARATIVE SHARE ANALYSIS OF AUTOMOTIVE ELECTRIC COOLANT VALVE MARKET FOR TWO WAY, BY COUNTRY 2020 AND 2032(%)
- FIGURE 13. COMPARATIVE SHARE ANALYSIS OF AUTOMOTIVE ELECTRIC COOLANT VALVE MARKET FOR THREE WAY, BY COUNTRY 2020 AND 2032(%)
- FIGURE 14. COMPARATIVE SHARE ANALYSIS OF AUTOMOTIVE ELECTRIC COOLANT VALVE MARKET FOR FOUR WAY, BY COUNTRY 2020 AND 2032(%)
- FIGURE 15. COMPARATIVE SHARE ANALYSIS OF AUTOMOTIVE ELECTRIC COOLANT VALVE MARKET FOR FIVE WAY, BY COUNTRY 2020 AND 2032(%)
- FIGURE 16. COMPARATIVE SHARE ANALYSIS OF AUTOMOTIVE ELECTRIC COOLANT VALVE MARKET FOR OTHERS, BY COUNTRY 2020 AND 2032(%)
- FIGURE 17. AUTOMOTIVE ELECTRIC COOLANT VALVE MARKET, BY MODULATION TYPE, 2020 AND 2032(%)
- FIGURE 18. COMPARATIVE SHARE ANALYSIS OF AUTOMOTIVE ELECTRIC COOLANT VALVE MARKET FOR PRE-CONFIGURED ELECTRIC COOLANT VALVES, BY COUNTRY 2020 AND 2032(%)
- FIGURE 19. COMPARATIVE SHARE ANALYSIS OF AUTOMOTIVE ELECTRIC COOLANT VALVE MARKET FOR FIELD-CONFIGURABLE ELECTRIC COOLANT VALVES, BY COUNTRY 2020 AND 2032(%)
- FIGURE 20. AUTOMOTIVE ELECTRIC COOLANT VALVE MARKET, BY COMMUNICATION PROTOCOL, 2020 AND 2032(%)
- FIGURE 21. COMPARATIVE SHARE ANALYSIS OF AUTOMOTIVE ELECTRIC COOLANT VALVE MARKET FOR DIRECT ANALOG, BY COUNTRY 2020 AND 2032(%)
- FIGURE 22. COMPARATIVE SHARE ANALYSIS OF AUTOMOTIVE ELECTRIC COOLANT VALVE MARKET FOR ANALOG W/ VOLTAGE FEEDBACK, BY COUNTRY 2020 AND 2032(%)
- FIGURE 23. COMPARATIVE SHARE ANALYSIS OF AUTOMOTIVE ELECTRIC COOLANT VALVE MARKET FOR CAN, BY COUNTRY 2020 AND 2032(%)
- FIGURE 24. COMPARATIVE SHARE ANALYSIS OF AUTOMOTIVE ELECTRIC COOLANT VALVE MARKET FOR LIN, BY COUNTRY 2020 AND 2032(%)
- FIGURE 25. COMPARATIVE SHARE ANALYSIS OF AUTOMOTIVE ELECTRIC COOLANT VALVE MARKET FOR OTHERS, BY COUNTRY 2020 AND 2032(%)
- FIGURE 26. AUTOMOTIVE ELECTRIC COOLANT VALVE MARKET, BY VEHICLE TYPE, 2020 AND 2032(%)
- FIGURE 27. COMPARATIVE SHARE ANALYSIS OF AUTOMOTIVE ELECTRIC COOLANT VALVE MARKET FOR PASSENGER VEHICLE, BY COUNTRY 2020 AND 2032(%)
- FIGURE 28. COMPARATIVE SHARE ANALYSIS OF AUTOMOTIVE ELECTRIC COOLANT VALVE MARKET FOR LIGHT DUTY VEHICLE, BY COUNTRY 2020 AND 2032(%)
- FIGURE 29. COMPARATIVE SHARE ANALYSIS OF AUTOMOTIVE ELECTRIC COOLANT VALVE MARKET FOR MEDIUM AND HEAVY DUTY TRUCKS, BY COUNTRY 2020 AND 2032(%)
- FIGURE 30. COMPARATIVE SHARE ANALYSIS OF AUTOMOTIVE ELECTRIC COOLANT VALVE MARKET FOR BUSES AND COACHES, BY COUNTRY 2020 AND 2032(%)
- FIGURE 31. COMPARATIVE SHARE ANALYSIS OF AUTOMOTIVE ELECTRIC COOLANT VALVE MARKET FOR OFF HIGHWAY VEHICLES, BY COUNTRY 2020 AND 2032(%)
- FIGURE 32. AUTOMOTIVE ELECTRIC COOLANT VALVE MARKET, BY VOLTAGE, 2020 AND 2032(%)
- FIGURE 33. COMPARATIVE SHARE ANALYSIS OF AUTOMOTIVE ELECTRIC COOLANT VALVE MARKET FOR 12V, BY COUNTRY 2020 AND 2032(%)
- FIGURE 34. COMPARATIVE SHARE ANALYSIS OF AUTOMOTIVE ELECTRIC COOLANT VALVE MARKET FOR 24V, BY COUNTRY 2020 AND 2032(%)
- FIGURE 35. AUTOMOTIVE ELECTRIC COOLANT VALVE MARKET BY REGION, 2020 AND 2032(%)
- FIGURE 36. U.S. AUTOMOTIVE ELECTRIC COOLANT VALVE MARKET, 2020-2032 ($MILLION)
- FIGURE 37. CANADA AUTOMOTIVE ELECTRIC COOLANT VALVE MARKET, 2020-2032 ($MILLION)
- FIGURE 38. MEXICO AUTOMOTIVE ELECTRIC COOLANT VALVE MARKET, 2020-2032 ($MILLION)
- FIGURE 39. UK AUTOMOTIVE ELECTRIC COOLANT VALVE MARKET, 2020-2032 ($MILLION)
- FIGURE 40. GERMANY AUTOMOTIVE ELECTRIC COOLANT VALVE MARKET, 2020-2032 ($MILLION)
- FIGURE 41. FRANCE AUTOMOTIVE ELECTRIC COOLANT VALVE MARKET, 2020-2032 ($MILLION)
- FIGURE 42. ITALY AUTOMOTIVE ELECTRIC COOLANT VALVE MARKET, 2020-2032 ($MILLION)
- FIGURE 43. SPAIN AUTOMOTIVE ELECTRIC COOLANT VALVE MARKET, 2020-2032 ($MILLION)
- FIGURE 44. REST OF EUROPE AUTOMOTIVE ELECTRIC COOLANT VALVE MARKET, 2020-2032 ($MILLION)
- FIGURE 45. CHINA AUTOMOTIVE ELECTRIC COOLANT VALVE MARKET, 2020-2032 ($MILLION)
- FIGURE 46. INDIA AUTOMOTIVE ELECTRIC COOLANT VALVE MARKET, 2020-2032 ($MILLION)
- FIGURE 47. JAPAN AUTOMOTIVE ELECTRIC COOLANT VALVE MARKET, 2020-2032 ($MILLION)
- FIGURE 48. SOUTH KOREA AUTOMOTIVE ELECTRIC COOLANT VALVE MARKET, 2020-2032 ($MILLION)
- FIGURE 49. REST OF ASIA-PACIFIC AUTOMOTIVE ELECTRIC COOLANT VALVE MARKET, 2020-2032 ($MILLION)
- FIGURE 50. LATIN AMERICA AUTOMOTIVE ELECTRIC COOLANT VALVE MARKET, 2020-2032 ($MILLION)
- FIGURE 51. MIDDLE EAST AUTOMOTIVE ELECTRIC COOLANT VALVE MARKET, 2020-2032 ($MILLION)
- FIGURE 52. AFRICA AUTOMOTIVE ELECTRIC COOLANT VALVE MARKET, 2020-2032 ($MILLION)
- FIGURE 53. TOP WINNING STRATEGIES, BY YEAR (2020-2023)
- FIGURE 54. TOP WINNING STRATEGIES, BY DEVELOPMENT (2020-2023)
- FIGURE 55. TOP WINNING STRATEGIES, BY COMPANY (2020-2023)
- FIGURE 56. PRODUCT MAPPING OF TOP 10 PLAYERS
- FIGURE 57. COMPETITIVE DASHBOARD
- FIGURE 58. COMPETITIVE HEATMAP: AUTOMOTIVE ELECTRIC COOLANT VALVE MARKET
- FIGURE 59. TOP PLAYER POSITIONING, 2020
 2024 年汽車閥門全球市場報告
 2024-2028年全球汽車淨化閥市場
 乘用車引擎閥門市場 - 全球產業規模、佔有率、趨勢機會和預測,按車輛類型、技術、燃料類型、地區、競爭細分,2018-2028 年
 乘用車燃油系統閥門市場 - 全球產業規模、佔有率、趨勢機會和預測,按閥門類型、車輛類型、按地區的燃料類型、競爭細分,2018-2028 年
 乘用車空調閥門市場 - 全球產業規模、佔有率、趨勢機會和預測,按車輛類型、銷售通路、燃料類型、地區、競爭細分,2018-2028 年
 乘用車閥門市場 - 2018-2028 年全球產業規模、佔有率、趨勢機會與預測,按車輛類型、按應用類型、功能類型、地區、競爭細分
 商用車引擎閥門市場 - 全球產業規模、佔有率、趨勢機會和預測,按車輛類型、技術、燃料類型、地區、競爭細分,2018-2028 年
 商用車燃油系統閥門市場 - 全球產業規模、佔有率、趨勢機會和預測,按閥門類型、車輛類型、燃料類型、地區、競爭細分,2018-2028 年
 商用車空調閥門市場 - 2018-2028 年全球產業規模、佔有率、趨勢機會和預測,按車輛類型、銷售管道、燃料類型、地區和競爭細分
 汽車引擎閥門市場 - 全球產業規模、佔有率、趨勢機會和預測,按車型、技術、燃料類型、地區、競爭細分,2018-2028年