


 |
市場調查報告書
商品編碼
1446916
神經母細胞瘤治療市場:按類型、給藥途徑、分銷管道分類:2023-2032 年全球機會分析與產業預測Neuroblastoma Drugs Market By Type (Chemotherapy, Immunotherapy, Others), By Route of Administration (Oral, Injectable), By Distribution Channel (Online, Offline): Global Opportunity Analysis and Industry Forecast, 2023-2032 |
||||||
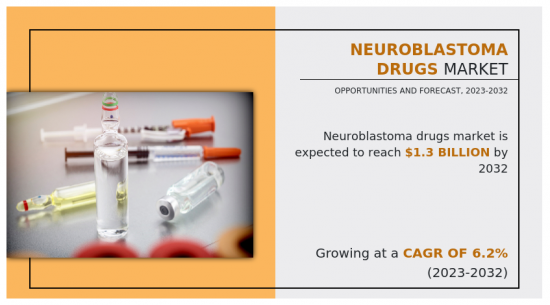
2022年神經母細胞瘤治療市值為7億美元,預計2032年將達13億美元,2023年至2032年的複合年成長率為6.2%。
神經母細胞瘤是一種主要影響幼兒的癌症,通常始於位於腎臟上方的腎上腺。最常見於 5 歲以下兒童,大多數病例發生在嬰幼兒和幼兒。這種癌症始於稱為神經母細胞的未成熟神經細胞,它們是控制戰鬥或逃跑反應的交感神經系統的一部分。
神經母細胞瘤的行為差異很大,從自發性消退或成熟到侵襲性和快速擴張。神經母細胞瘤的症狀因腫瘤的位置和大小而異,但可能包括腹部腫脹、體重減輕、煩躁、疲勞和排便習慣改變。神經母細胞瘤藥物旨在透過直接攻擊癌細胞或透過調節參與腫瘤發展的生物途徑來靶向癌性神經母細胞瘤細胞以抑制其生長。神經母細胞瘤的治療方法通常包括手術、化療、放射線治療、免疫治療和其他標靶治療的組合。
神經母細胞瘤瘤治療市場的促進因素包括神經母細胞瘤發病率上升、研發活動不斷增加以及人們對神經母細胞瘤認知的不斷提高。神經母細胞瘤的發生率和盛行率不斷增加,特別是在兒童族群中,是推動神經母細胞瘤治療市場成長的關鍵因素。例如,根據美國生物技術資訊中心 (NCBI) 的數據,2023 年,美國神經母細胞瘤的年發生率約為 650 例,每百萬名兒童10.2 例。因此,神經母細胞瘤盛行率的不斷上升導致迫切需要有效的標靶化藥物治療,以促進市場成長。
因此,製藥公司和研究機構被迫加強藥物開發、臨床試驗和合作研究計畫的力度,以解決這個日益嚴重的健康問題。市場對日益增加的疾病負擔的反應凸顯了推動創新治療方法以改善神經母細胞瘤患者的治療結果和生活品質的重要性。此外,製藥業正在大力投資腫瘤學研究和藥物開發,推動市場成長。神經母細胞瘤作為兒童腫瘤學的一個子集,正受益於此更廣泛的趨勢,新藥發現和開發的資金和資源不斷增加。例如,美國癌症研究所 (NCI) 大力投資基礎研究,開發出了一種治療神經母細胞瘤的藥物 dinutuximab。
然而,神經母細胞瘤治療的高昂費用以及與神經母細胞瘤藥物相關的不良副作用是限制神經母細胞瘤藥物市場成長的因素。相較之下,神經母細胞瘤管道藥物的增加為市場成長提供了有利的機會。此外,探索涉及不同類別藥物的聯合治療,例如常規化療藥物、標靶藥物和免疫治療藥物,為增強治療效果提供了機會。
相關人員的主要利益
- 該報告提供了 2022 年至 2032 年神經母細胞瘤瘤治療市場分析的細分市場、當前趨勢、估計和動態,並確定了主要的神經母細胞瘤瘤治療市場機會。
- 我們提供市場研究以及與市場促進因素、市場限制和市場機會相關的資訊。
- 波特的五力分析揭示了買家和供應商的潛力,幫助相關人員做出利潤驅動的業務決策並加強供應商和買家網路。
- 神經母細胞瘤治療市場細分的詳細分析有助於確定市場機會。
- 每個地區的主要國家都根據其對全球市場的收益貢獻繪製了地圖。
- 市場參與者定位有助於基準化分析,並提供對市場參與者當前地位的清晰了解。
- 該報告包括對區域和全球神經母細胞瘤治療市場趨勢、主要企業、細分市場、應用領域和市場成長策略的分析。
該報告可以客製化。
- 監管指引
- 根據客戶興趣加入公司簡介
- 按國家或地區進行的附加分析 – 市場規模和預測
- 公司簡介的擴充列表
- 歷史市場資料
- 主要參與者的詳細資料(Excel格式,包括位置、聯絡資訊、供應商/供應商網路等)
目錄
第1章簡介
第 2 章執行摘要
第3章市場概況
- 市場定義和範圍
- 主要發現
- 影響因素
- 主要投資機會
- 波特五力分析
- 市場動態
- 促進因素
- 神經母細胞瘤盛行率上升
- 政府對神經母細胞瘤的認知與舉措不斷增強
- 增加研發活動
- 抑制因素
- 副作用和安全問題
- 機會
- 新興市場的成長機會
- 研發線產品增加
- 促進因素
第4章神經母細胞瘤治療藥物市場:依類型
- 概述
- 化療
- 免疫療法
- 其他
第5章神經母細胞瘤治療藥物市場:依給藥途徑
- 概述
- 口服劑
- 注射
第6章神經母細胞瘤治療藥物市場:按分銷管道
- 概述
- 線上
- 離線
第7章神經母細胞瘤治療藥物市場:依地區
- 概述
- 北美洲
- 美國
- 加拿大
- 墨西哥
- 歐洲
- 德國
- 法國
- 英國
- 義大利
- 西班牙
- 其他
- 亞太地區
- 日本
- 中國
- 印度
- 澳洲
- 韓國
- 其他
- 拉丁美洲/中東/非洲
- 巴西
- 沙烏地阿拉伯
- 南非
- 其他
第8章 競爭格局
- 介紹
- 關鍵成功策略
- 10家主要企業產品圖譜
- 競爭對手儀表板
- 競爭熱圖
- 2022年主要企業定位
第9章 公司簡介
- Recordati Group
- AstraZeneca plc
- Bristol-Myers Squibb Company
- Cellectar Biosciences, Inc.
- Eli Lilly and Company
- MacroGenics Inc.
- Pfizer Inc.
- Teva Pharmaceutical Industries Ltd.
- United Therapeutics Corporation
- Y-mabs Therapeutics, Inc.
The neuroblastoma drugs market was valued for $0.7 billion in 2022 and is estimated to reach $1.3 billion by 2032, exhibiting a CAGR of 6.2% from 2023 to 2032. Neuroblastoma is a type of cancer that primarily affects young children, typically arising in the adrenal glands, which are located on top of the kidneys. It is the most diagnosed disease in children under five, with most cases appearing in infants. This cancer originates from immature nerve cells, called neuroblasts, which are part of the sympathetic nervous system responsible for the "fight or flight" response.
Neuroblastoma varies widely in its behavior, ranging from spontaneous regression or maturation to aggressive, rapidly spreading forms. Symptoms of neuroblastoma can vary based on the location and size of the tumor but may include abdominal swelling, weight loss, irritability, fatigue, and changes in bowel habits. Neuroblastoma drugs are designed to target and inhibit the growth of cancerous neuroblastoma cells, either by directly attacking the cancer cells or by modulating the biological pathways involved in tumor development. The treatment approach for neuroblastoma often involves a combination of surgery, chemotherapy, radiation therapy, immunotherapy, and other targeted therapies.
The neuroblastoma drugs market is driven by a rise in incidences of neuroblastoma, advancements in R&D activities, and growth in awareness of neuroblastoma. The increasing incidences and prevalence of neuroblastoma, particularly among pediatric populations, is a pivotal factor driving the growth of the neuroblastoma drugs market. For instance, according to the National Center for Biotechnology and Information (NCBI) in 2023, the annual incidence of neuroblastoma in the U.S. was approximately 650 cases, i.e., 10.2 per million children. Thus, the growing prevalence of neuroblastoma led to an urgent need for effective and targeted drug therapies which contribute toward the market growth.
Consequently, pharmaceutical companies and research institutions are compelled to intensify their efforts in drug development, clinical trials, and collaborative research initiatives to address this rising health concern. The market's response to the increasing disease burden emphasizes the importance of advancing innovative treatments to improve outcomes and quality of life for individuals affected by neuroblastoma. In addition, the pharmaceutical industry has been witnessing significant investments in oncology research and drug development, thereby boosting the market growth. Neuroblastoma, as a subset of pediatric oncology, benefits from this broader trend, with increased funding and resources allocated to discovering and developing novel drugs. For instance, the National Cancer Institute (NCI) has made substantial investments in basic research, leading to the development of dinutuximab, a treatment for neuroblastoma.
However, the high cost of neuroblastoma treatment, and harmful side effects associated with neuroblastoma drugs are the factors responsible for the impeding the growth of the neuroblastoma drug market. In contrast, rise in number of pipeline drugs for neuroblastoma provides lucrative opportunity to the market growth. In addition, the exploration of combination therapies involving different classes of drugs, such as traditional chemotherapeutics, targeted agents, and immunotherapies, offers opportunities for enhanced treatment efficacy.
The neuroblastoma drugs market is segmented into type, route of administration, distribution channel, and region. By type, the market is classified into chemotherapy, immunotherapy, and others. By route of administration, the market is segregated into oral and injectable. By distribution channel, the market is classified into online and offline. Region wise, the market is analyzed across North America (the U.S., Canada, and Mexico), Europe (Germany, France, the UK, Italy, Spain, and rest of Europe), Asia-Pacific (Japan, China, India, Australia, South Korea, and rest of Asia-Pacific), and LAMEA (Brazil, South Africa, Saudi Arabia, and rest of LAMEA). Major key players that operate in the neuroblastoma drugs market are Recordati Group,, AstraZeneca plc, Bristol-Myers Squibb Company, Cellectar Biosciences, Inc., Eli Lilly and Company, MacroGenics Inc, Pfizer, Inc., Teva Pharmaceutical Industries Ltd., United Therapeutics Corporation, and Y-mabs Therapeutics, Inc. Key players operating in the market have adopted agreement, acquisition, partnership, and product approval as their key strategies to expand their product portfolio.
Key Benefits For Stakeholders
- This report provides a quantitative analysis of the market segments, current trends, estimations, and dynamics of the neuroblastoma drugs market analysis from 2022 to 2032 to identify the prevailing neuroblastoma drugs market opportunities.
- The market research is offered along with information related to key drivers, restraints, and opportunities.
- Porter's five forces analysis highlights the potency of buyers and suppliers to enable stakeholders make profit-oriented business decisions and strengthen their supplier-buyer network.
- In-depth analysis of the neuroblastoma drugs market segmentation assists to determine the prevailing market opportunities.
- Major countries in each region are mapped according to their revenue contribution to the global market.
- Market player positioning facilitates benchmarking and provides a clear understanding of the present position of the market players.
- The report includes the analysis of the regional as well as global neuroblastoma drugs market trends, key players, market segments, application areas, and market growth strategies.
Additional benefits you will get with this purchase are:
- Quarterly Update and* (only available with a corporate license, on listed price)
- 5 additional Company Profile of client Choice pre- or Post-purchase, as a free update.
- Free Upcoming Version on the Purchase of Five and Enterprise User License.
- 16 analyst hours of support* (post-purchase, if you find additional data requirements upon review of the report, you may receive support amounting to 16 analyst hours to solve questions, and post-sale queries)
- 15% Free Customization* (in case the scope or segment of the report does not match your requirements, 15% is equivalent to 3 working days of free work, applicable once)
- Free data Pack on the Five and Enterprise User License. (Excel version of the report)
- Free Updated report if the report is 6-12 months old or older.
- 24-hour priority response*
- Free Industry updates and white papers.
Possible Customization with this report (with additional cost and timeline, please talk to the sales executive to know more)
- Regulatory Guidelines
- Additional company profiles with specific to client's interest
- Additional country or region analysis- market size and forecast
- Expanded list for Company Profiles
- Historic market data
- Key player details (including location, contact details, supplier/vendor network etc. in excel format)
Key Market Segments
By Type
- Chemotherapy
- Immunotherapy
- Others
By Route of Administration
- Oral
- Injectable
By Distribution Channel
- Online
- Offline
By Region
- North America
- U.S.
- Canada
- Mexico
- Europe
- Germany
- France
- UK
- Italy
- Spain
- Rest of Europe
- Asia-Pacific
- Japan
- China
- India
- Australia
- South Korea
- Rest of Asia-Pacific
- LAMEA
- Brazil
- Saudi Arabia
- South Africa
- Rest of LAMEA
Key Market Players:
- AstraZeneca plc
- Bristol-Myers Squibb Company
- Cellectar Biosciences, Inc.
- Eli Lilly and Company
- Pfizer Inc.
- Teva Pharmaceutical Industries Ltd.
- United Therapeutics Corporation
- Y-mabs Therapeutics, Inc.
- Recordati Group
- MacroGenics Inc.
TABLE OF CONTENTS
CHAPTER 1: INTRODUCTION
- 1.1. Report description
- 1.2. Key market segments
- 1.3. Key benefits to the stakeholders
- 1.4. Research methodology
- 1.4.1. Primary research
- 1.4.2. Secondary research
- 1.4.3. Analyst tools and models
CHAPTER 2: EXECUTIVE SUMMARY
- 2.1. CXO Perspective
CHAPTER 3: MARKET OVERVIEW
- 3.1. Market definition and scope
- 3.2. Key findings
- 3.2.1. Top impacting factors
- 3.2.2. Top investment pockets
- 3.3. Porter's five forces analysis
- 3.3.1. Moderate bargaining power of suppliers
- 3.3.2. Moderate threat of new entrants
- 3.3.3. Moderate threat of substitutes
- 3.3.4. Moderate intensity of rivalry
- 3.3.5. Moderate bargaining power of buyers
- 3.4. Market dynamics
- 3.4.1. Drivers
- 3.4.1.1. Rise in prevalence of neuroblastoma
- 3.4.1.2. Growth in awareness & initiatives taken by the government for neuroblastoma
- 3.4.1.3. Rise in R&D activities
- 3.4.2. Restraints
- 3.4.2.1. Adverse effects and safety concerns
- 3.4.3. Opportunities
- 3.4.3.1. Growth opportunities in emerging markets
- 3.4.3.2. Rise in number of pipeline products
- 3.4.1. Drivers
CHAPTER 4: NEUROBLASTOMA DRUGS MARKET, BY TYPE
- 4.1. Overview
- 4.1.1. Market size and forecast
- 4.2. Chemotherapy
- 4.2.1. Key market trends, growth factors and opportunities
- 4.2.2. Market size and forecast, by region
- 4.2.3. Market share analysis by country
- 4.3. Immunotherapy
- 4.3.1. Key market trends, growth factors and opportunities
- 4.3.2. Market size and forecast, by region
- 4.3.3. Market share analysis by country
- 4.4. Others
- 4.4.1. Key market trends, growth factors and opportunities
- 4.4.2. Market size and forecast, by region
- 4.4.3. Market share analysis by country
CHAPTER 5: NEUROBLASTOMA DRUGS MARKET, BY ROUTE OF ADMINISTRATION
- 5.1. Overview
- 5.1.1. Market size and forecast
- 5.2. Oral
- 5.2.1. Key market trends, growth factors and opportunities
- 5.2.2. Market size and forecast, by region
- 5.2.3. Market share analysis by country
- 5.3. Injectable
- 5.3.1. Key market trends, growth factors and opportunities
- 5.3.2. Market size and forecast, by region
- 5.3.3. Market share analysis by country
CHAPTER 6: NEUROBLASTOMA DRUGS MARKET, BY DISTRIBUTION CHANNEL
- 6.1. Overview
- 6.1.1. Market size and forecast
- 6.2. Online
- 6.2.1. Key market trends, growth factors and opportunities
- 6.2.2. Market size and forecast, by region
- 6.2.3. Market share analysis by country
- 6.3. Offline
- 6.3.1. Key market trends, growth factors and opportunities
- 6.3.2. Market size and forecast, by region
- 6.3.3. Market share analysis by country
CHAPTER 7: NEUROBLASTOMA DRUGS MARKET, BY REGION
- 7.1. Overview
- 7.1.1. Market size and forecast By Region
- 7.2. North America
- 7.2.1. Key market trends, growth factors and opportunities
- 7.2.2. Market size and forecast, by Type
- 7.2.3. Market size and forecast, by Route of Administration
- 7.2.4. Market size and forecast, by Distribution Channel
- 7.2.5. Market size and forecast, by country
- 7.2.5.1. U.S.
- 7.2.5.1.1. Market size and forecast, by Type
- 7.2.5.1.2. Market size and forecast, by Route of Administration
- 7.2.5.1.3. Market size and forecast, by Distribution Channel
- 7.2.5.2. Canada
- 7.2.5.2.1. Market size and forecast, by Type
- 7.2.5.2.2. Market size and forecast, by Route of Administration
- 7.2.5.2.3. Market size and forecast, by Distribution Channel
- 7.2.5.3. Mexico
- 7.2.5.3.1. Market size and forecast, by Type
- 7.2.5.3.2. Market size and forecast, by Route of Administration
- 7.2.5.3.3. Market size and forecast, by Distribution Channel
- 7.3. Europe
- 7.3.1. Key market trends, growth factors and opportunities
- 7.3.2. Market size and forecast, by Type
- 7.3.3. Market size and forecast, by Route of Administration
- 7.3.4. Market size and forecast, by Distribution Channel
- 7.3.5. Market size and forecast, by country
- 7.3.5.1. Germany
- 7.3.5.1.1. Market size and forecast, by Type
- 7.3.5.1.2. Market size and forecast, by Route of Administration
- 7.3.5.1.3. Market size and forecast, by Distribution Channel
- 7.3.5.2. France
- 7.3.5.2.1. Market size and forecast, by Type
- 7.3.5.2.2. Market size and forecast, by Route of Administration
- 7.3.5.2.3. Market size and forecast, by Distribution Channel
- 7.3.5.3. UK
- 7.3.5.3.1. Market size and forecast, by Type
- 7.3.5.3.2. Market size and forecast, by Route of Administration
- 7.3.5.3.3. Market size and forecast, by Distribution Channel
- 7.3.5.4. Italy
- 7.3.5.4.1. Market size and forecast, by Type
- 7.3.5.4.2. Market size and forecast, by Route of Administration
- 7.3.5.4.3. Market size and forecast, by Distribution Channel
- 7.3.5.5. Spain
- 7.3.5.5.1. Market size and forecast, by Type
- 7.3.5.5.2. Market size and forecast, by Route of Administration
- 7.3.5.5.3. Market size and forecast, by Distribution Channel
- 7.3.5.6. Rest of Europe
- 7.3.5.6.1. Market size and forecast, by Type
- 7.3.5.6.2. Market size and forecast, by Route of Administration
- 7.3.5.6.3. Market size and forecast, by Distribution Channel
- 7.4. Asia-Pacific
- 7.4.1. Key market trends, growth factors and opportunities
- 7.4.2. Market size and forecast, by Type
- 7.4.3. Market size and forecast, by Route of Administration
- 7.4.4. Market size and forecast, by Distribution Channel
- 7.4.5. Market size and forecast, by country
- 7.4.5.1. Japan
- 7.4.5.1.1. Market size and forecast, by Type
- 7.4.5.1.2. Market size and forecast, by Route of Administration
- 7.4.5.1.3. Market size and forecast, by Distribution Channel
- 7.4.5.2. China
- 7.4.5.2.1. Market size and forecast, by Type
- 7.4.5.2.2. Market size and forecast, by Route of Administration
- 7.4.5.2.3. Market size and forecast, by Distribution Channel
- 7.4.5.3. India
- 7.4.5.3.1. Market size and forecast, by Type
- 7.4.5.3.2. Market size and forecast, by Route of Administration
- 7.4.5.3.3. Market size and forecast, by Distribution Channel
- 7.4.5.4. Australia
- 7.4.5.4.1. Market size and forecast, by Type
- 7.4.5.4.2. Market size and forecast, by Route of Administration
- 7.4.5.4.3. Market size and forecast, by Distribution Channel
- 7.4.5.5. South Korea
- 7.4.5.5.1. Market size and forecast, by Type
- 7.4.5.5.2. Market size and forecast, by Route of Administration
- 7.4.5.5.3. Market size and forecast, by Distribution Channel
- 7.4.5.6. Rest of Asia-Pacific
- 7.4.5.6.1. Market size and forecast, by Type
- 7.4.5.6.2. Market size and forecast, by Route of Administration
- 7.4.5.6.3. Market size and forecast, by Distribution Channel
- 7.5. LAMEA
- 7.5.1. Key market trends, growth factors and opportunities
- 7.5.2. Market size and forecast, by Type
- 7.5.3. Market size and forecast, by Route of Administration
- 7.5.4. Market size and forecast, by Distribution Channel
- 7.5.5. Market size and forecast, by country
- 7.5.5.1. Brazil
- 7.5.5.1.1. Market size and forecast, by Type
- 7.5.5.1.2. Market size and forecast, by Route of Administration
- 7.5.5.1.3. Market size and forecast, by Distribution Channel
- 7.5.5.2. Saudi Arabia
- 7.5.5.2.1. Market size and forecast, by Type
- 7.5.5.2.2. Market size and forecast, by Route of Administration
- 7.5.5.2.3. Market size and forecast, by Distribution Channel
- 7.5.5.3. South Africa
- 7.5.5.3.1. Market size and forecast, by Type
- 7.5.5.3.2. Market size and forecast, by Route of Administration
- 7.5.5.3.3. Market size and forecast, by Distribution Channel
- 7.5.5.4. Rest of LAMEA
- 7.5.5.4.1. Market size and forecast, by Type
- 7.5.5.4.2. Market size and forecast, by Route of Administration
- 7.5.5.4.3. Market size and forecast, by Distribution Channel
CHAPTER 8: COMPETITIVE LANDSCAPE
- 8.1. Introduction
- 8.2. Top winning strategies
- 8.3. Product mapping of top 10 player
- 8.4. Competitive dashboard
- 8.5. Competitive heatmap
- 8.6. Top player positioning, 2022
CHAPTER 9: COMPANY PROFILES
- 9.1. Recordati Group
- 9.1.1. Company overview
- 9.1.2. Key executives
- 9.1.3. Company snapshot
- 9.1.4. Operating business segments
- 9.1.5. Product portfolio
- 9.1.6. Business performance
- 9.1.7. Key strategic moves and developments
- 9.2. AstraZeneca plc
- 9.2.1. Company overview
- 9.2.2. Key executives
- 9.2.3. Company snapshot
- 9.2.4. Operating business segments
- 9.2.5. Product portfolio
- 9.2.6. Business performance
- 9.3. Bristol-Myers Squibb Company
- 9.3.1. Company overview
- 9.3.2. Key executives
- 9.3.3. Company snapshot
- 9.3.4. Operating business segments
- 9.3.5. Product portfolio
- 9.3.6. Business performance
- 9.4. Cellectar Biosciences, Inc.
- 9.4.1. Company overview
- 9.4.2. Key executives
- 9.4.3. Company snapshot
- 9.4.4. Operating business segments
- 9.4.5. Product portfolio
- 9.5. Eli Lilly and Company
- 9.5.1. Company overview
- 9.5.2. Key executives
- 9.5.3. Company snapshot
- 9.5.4. Operating business segments
- 9.5.5. Product portfolio
- 9.5.6. Business performance
- 9.6. MacroGenics Inc.
- 9.6.1. Company overview
- 9.6.2. Key executives
- 9.6.3. Company snapshot
- 9.6.4. Operating business segments
- 9.6.5. Product portfolio
- 9.6.6. Business performance
- 9.7. Pfizer Inc.
- 9.7.1. Company overview
- 9.7.2. Key executives
- 9.7.3. Company snapshot
- 9.7.4. Operating business segments
- 9.7.5. Product portfolio
- 9.7.6. Business performance
- 9.8. Teva Pharmaceutical Industries Ltd.
- 9.8.1. Company overview
- 9.8.2. Key executives
- 9.8.3. Company snapshot
- 9.8.4. Operating business segments
- 9.8.5. Product portfolio
- 9.8.6. Business performance
- 9.9. United Therapeutics Corporation
- 9.9.1. Company overview
- 9.9.2. Key executives
- 9.9.3. Company snapshot
- 9.9.4. Operating business segments
- 9.9.5. Product portfolio
- 9.9.6. Business performance
- 9.9.7. Key strategic moves and developments
- 9.10. Y-mabs Therapeutics, Inc.
- 9.10.1. Company overview
- 9.10.2. Key executives
- 9.10.3. Company snapshot
- 9.10.4. Operating business segments
- 9.10.5. Product portfolio
- 9.10.6. Business performance
- 9.10.7. Key strategic moves and developments
LIST OF TABLES
- TABLE 01. GLOBAL NEUROBLASTOMA DRUGS MARKET, BY TYPE, 2022-2032 ($MILLION)
- TABLE 02. NEUROBLASTOMA DRUGS MARKET FOR CHEMOTHERAPY, BY REGION, 2022-2032 ($MILLION)
- TABLE 03. NEUROBLASTOMA DRUGS MARKET FOR IMMUNOTHERAPY, BY REGION, 2022-2032 ($MILLION)
- TABLE 04. NEUROBLASTOMA DRUGS MARKET FOR OTHERS, BY REGION, 2022-2032 ($MILLION)
- TABLE 05. GLOBAL NEUROBLASTOMA DRUGS MARKET, BY ROUTE OF ADMINISTRATION, 2022-2032 ($MILLION)
- TABLE 06. NEUROBLASTOMA DRUGS MARKET FOR ORAL, BY REGION, 2022-2032 ($MILLION)
- TABLE 07. NEUROBLASTOMA DRUGS MARKET FOR INJECTABLE, BY REGION, 2022-2032 ($MILLION)
- TABLE 08. GLOBAL NEUROBLASTOMA DRUGS MARKET, BY DISTRIBUTION CHANNEL, 2022-2032 ($MILLION)
- TABLE 09. NEUROBLASTOMA DRUGS MARKET FOR ONLINE, BY REGION, 2022-2032 ($MILLION)
- TABLE 10. NEUROBLASTOMA DRUGS MARKET FOR OFFLINE, BY REGION, 2022-2032 ($MILLION)
- TABLE 11. NEUROBLASTOMA DRUGS MARKET, BY REGION, 2022-2032 ($MILLION)
- TABLE 12. NORTH AMERICA NEUROBLASTOMA DRUGS MARKET, BY TYPE, 2022-2032 ($MILLION)
- TABLE 13. NORTH AMERICA NEUROBLASTOMA DRUGS MARKET, BY ROUTE OF ADMINISTRATION, 2022-2032 ($MILLION)
- TABLE 14. NORTH AMERICA NEUROBLASTOMA DRUGS MARKET, BY DISTRIBUTION CHANNEL, 2022-2032 ($MILLION)
- TABLE 15. NORTH AMERICA NEUROBLASTOMA DRUGS MARKET, BY COUNTRY, 2022-2032 ($MILLION)
- TABLE 16. U.S. NEUROBLASTOMA DRUGS MARKET, BY TYPE, 2022-2032 ($MILLION)
- TABLE 17. U.S. NEUROBLASTOMA DRUGS MARKET, BY ROUTE OF ADMINISTRATION, 2022-2032 ($MILLION)
- TABLE 18. U.S. NEUROBLASTOMA DRUGS MARKET, BY DISTRIBUTION CHANNEL, 2022-2032 ($MILLION)
- TABLE 19. CANADA NEUROBLASTOMA DRUGS MARKET, BY TYPE, 2022-2032 ($MILLION)
- TABLE 20. CANADA NEUROBLASTOMA DRUGS MARKET, BY ROUTE OF ADMINISTRATION, 2022-2032 ($MILLION)
- TABLE 21. CANADA NEUROBLASTOMA DRUGS MARKET, BY DISTRIBUTION CHANNEL, 2022-2032 ($MILLION)
- TABLE 22. MEXICO NEUROBLASTOMA DRUGS MARKET, BY TYPE, 2022-2032 ($MILLION)
- TABLE 23. MEXICO NEUROBLASTOMA DRUGS MARKET, BY ROUTE OF ADMINISTRATION, 2022-2032 ($MILLION)
- TABLE 24. MEXICO NEUROBLASTOMA DRUGS MARKET, BY DISTRIBUTION CHANNEL, 2022-2032 ($MILLION)
- TABLE 25. EUROPE NEUROBLASTOMA DRUGS MARKET, BY TYPE, 2022-2032 ($MILLION)
- TABLE 26. EUROPE NEUROBLASTOMA DRUGS MARKET, BY ROUTE OF ADMINISTRATION, 2022-2032 ($MILLION)
- TABLE 27. EUROPE NEUROBLASTOMA DRUGS MARKET, BY DISTRIBUTION CHANNEL, 2022-2032 ($MILLION)
- TABLE 28. EUROPE NEUROBLASTOMA DRUGS MARKET, BY COUNTRY, 2022-2032 ($MILLION)
- TABLE 29. GERMANY NEUROBLASTOMA DRUGS MARKET, BY TYPE, 2022-2032 ($MILLION)
- TABLE 30. GERMANY NEUROBLASTOMA DRUGS MARKET, BY ROUTE OF ADMINISTRATION, 2022-2032 ($MILLION)
- TABLE 31. GERMANY NEUROBLASTOMA DRUGS MARKET, BY DISTRIBUTION CHANNEL, 2022-2032 ($MILLION)
- TABLE 32. FRANCE NEUROBLASTOMA DRUGS MARKET, BY TYPE, 2022-2032 ($MILLION)
- TABLE 33. FRANCE NEUROBLASTOMA DRUGS MARKET, BY ROUTE OF ADMINISTRATION, 2022-2032 ($MILLION)
- TABLE 34. FRANCE NEUROBLASTOMA DRUGS MARKET, BY DISTRIBUTION CHANNEL, 2022-2032 ($MILLION)
- TABLE 35. UK NEUROBLASTOMA DRUGS MARKET, BY TYPE, 2022-2032 ($MILLION)
- TABLE 36. UK NEUROBLASTOMA DRUGS MARKET, BY ROUTE OF ADMINISTRATION, 2022-2032 ($MILLION)
- TABLE 37. UK NEUROBLASTOMA DRUGS MARKET, BY DISTRIBUTION CHANNEL, 2022-2032 ($MILLION)
- TABLE 38. ITALY NEUROBLASTOMA DRUGS MARKET, BY TYPE, 2022-2032 ($MILLION)
- TABLE 39. ITALY NEUROBLASTOMA DRUGS MARKET, BY ROUTE OF ADMINISTRATION, 2022-2032 ($MILLION)
- TABLE 40. ITALY NEUROBLASTOMA DRUGS MARKET, BY DISTRIBUTION CHANNEL, 2022-2032 ($MILLION)
- TABLE 41. SPAIN NEUROBLASTOMA DRUGS MARKET, BY TYPE, 2022-2032 ($MILLION)
- TABLE 42. SPAIN NEUROBLASTOMA DRUGS MARKET, BY ROUTE OF ADMINISTRATION, 2022-2032 ($MILLION)
- TABLE 43. SPAIN NEUROBLASTOMA DRUGS MARKET, BY DISTRIBUTION CHANNEL, 2022-2032 ($MILLION)
- TABLE 44. REST OF EUROPE NEUROBLASTOMA DRUGS MARKET, BY TYPE, 2022-2032 ($MILLION)
- TABLE 45. REST OF EUROPE NEUROBLASTOMA DRUGS MARKET, BY ROUTE OF ADMINISTRATION, 2022-2032 ($MILLION)
- TABLE 46. REST OF EUROPE NEUROBLASTOMA DRUGS MARKET, BY DISTRIBUTION CHANNEL, 2022-2032 ($MILLION)
- TABLE 47. ASIA-PACIFIC NEUROBLASTOMA DRUGS MARKET, BY TYPE, 2022-2032 ($MILLION)
- TABLE 48. ASIA-PACIFIC NEUROBLASTOMA DRUGS MARKET, BY ROUTE OF ADMINISTRATION, 2022-2032 ($MILLION)
- TABLE 49. ASIA-PACIFIC NEUROBLASTOMA DRUGS MARKET, BY DISTRIBUTION CHANNEL, 2022-2032 ($MILLION)
- TABLE 50. ASIA-PACIFIC NEUROBLASTOMA DRUGS MARKET, BY COUNTRY, 2022-2032 ($MILLION)
- TABLE 51. JAPAN NEUROBLASTOMA DRUGS MARKET, BY TYPE, 2022-2032 ($MILLION)
- TABLE 52. JAPAN NEUROBLASTOMA DRUGS MARKET, BY ROUTE OF ADMINISTRATION, 2022-2032 ($MILLION)
- TABLE 53. JAPAN NEUROBLASTOMA DRUGS MARKET, BY DISTRIBUTION CHANNEL, 2022-2032 ($MILLION)
- TABLE 54. CHINA NEUROBLASTOMA DRUGS MARKET, BY TYPE, 2022-2032 ($MILLION)
- TABLE 55. CHINA NEUROBLASTOMA DRUGS MARKET, BY ROUTE OF ADMINISTRATION, 2022-2032 ($MILLION)
- TABLE 56. CHINA NEUROBLASTOMA DRUGS MARKET, BY DISTRIBUTION CHANNEL, 2022-2032 ($MILLION)
- TABLE 57. INDIA NEUROBLASTOMA DRUGS MARKET, BY TYPE, 2022-2032 ($MILLION)
- TABLE 58. INDIA NEUROBLASTOMA DRUGS MARKET, BY ROUTE OF ADMINISTRATION, 2022-2032 ($MILLION)
- TABLE 59. INDIA NEUROBLASTOMA DRUGS MARKET, BY DISTRIBUTION CHANNEL, 2022-2032 ($MILLION)
- TABLE 60. AUSTRALIA NEUROBLASTOMA DRUGS MARKET, BY TYPE, 2022-2032 ($MILLION)
- TABLE 61. AUSTRALIA NEUROBLASTOMA DRUGS MARKET, BY ROUTE OF ADMINISTRATION, 2022-2032 ($MILLION)
- TABLE 62. AUSTRALIA NEUROBLASTOMA DRUGS MARKET, BY DISTRIBUTION CHANNEL, 2022-2032 ($MILLION)
- TABLE 63. SOUTH KOREA NEUROBLASTOMA DRUGS MARKET, BY TYPE, 2022-2032 ($MILLION)
- TABLE 64. SOUTH KOREA NEUROBLASTOMA DRUGS MARKET, BY ROUTE OF ADMINISTRATION, 2022-2032 ($MILLION)
- TABLE 65. SOUTH KOREA NEUROBLASTOMA DRUGS MARKET, BY DISTRIBUTION CHANNEL, 2022-2032 ($MILLION)
- TABLE 66. REST OF ASIA-PACIFIC NEUROBLASTOMA DRUGS MARKET, BY TYPE, 2022-2032 ($MILLION)
- TABLE 67. REST OF ASIA-PACIFIC NEUROBLASTOMA DRUGS MARKET, BY ROUTE OF ADMINISTRATION, 2022-2032 ($MILLION)
- TABLE 68. REST OF ASIA-PACIFIC NEUROBLASTOMA DRUGS MARKET, BY DISTRIBUTION CHANNEL, 2022-2032 ($MILLION)
- TABLE 69. LAMEA NEUROBLASTOMA DRUGS MARKET, BY TYPE, 2022-2032 ($MILLION)
- TABLE 70. LAMEA NEUROBLASTOMA DRUGS MARKET, BY ROUTE OF ADMINISTRATION, 2022-2032 ($MILLION)
- TABLE 71. LAMEA NEUROBLASTOMA DRUGS MARKET, BY DISTRIBUTION CHANNEL, 2022-2032 ($MILLION)
- TABLE 72. LAMEA NEUROBLASTOMA DRUGS MARKET, BY COUNTRY, 2022-2032 ($MILLION)
- TABLE 73. BRAZIL NEUROBLASTOMA DRUGS MARKET, BY TYPE, 2022-2032 ($MILLION)
- TABLE 74. BRAZIL NEUROBLASTOMA DRUGS MARKET, BY ROUTE OF ADMINISTRATION, 2022-2032 ($MILLION)
- TABLE 75. BRAZIL NEUROBLASTOMA DRUGS MARKET, BY DISTRIBUTION CHANNEL, 2022-2032 ($MILLION)
- TABLE 76. SAUDI ARABIA NEUROBLASTOMA DRUGS MARKET, BY TYPE, 2022-2032 ($MILLION)
- TABLE 77. SAUDI ARABIA NEUROBLASTOMA DRUGS MARKET, BY ROUTE OF ADMINISTRATION, 2022-2032 ($MILLION)
- TABLE 78. SAUDI ARABIA NEUROBLASTOMA DRUGS MARKET, BY DISTRIBUTION CHANNEL, 2022-2032 ($MILLION)
- TABLE 79. SOUTH AFRICA NEUROBLASTOMA DRUGS MARKET, BY TYPE, 2022-2032 ($MILLION)
- TABLE 80. SOUTH AFRICA NEUROBLASTOMA DRUGS MARKET, BY ROUTE OF ADMINISTRATION, 2022-2032 ($MILLION)
- TABLE 81. SOUTH AFRICA NEUROBLASTOMA DRUGS MARKET, BY DISTRIBUTION CHANNEL, 2022-2032 ($MILLION)
- TABLE 82. REST OF LAMEA NEUROBLASTOMA DRUGS MARKET, BY TYPE, 2022-2032 ($MILLION)
- TABLE 83. REST OF LAMEA NEUROBLASTOMA DRUGS MARKET, BY ROUTE OF ADMINISTRATION, 2022-2032 ($MILLION)
- TABLE 84. REST OF LAMEA NEUROBLASTOMA DRUGS MARKET, BY DISTRIBUTION CHANNEL, 2022-2032 ($MILLION)
- TABLE 85. RECORDATI GROUP: KEY EXECUTIVES
- TABLE 86. RECORDATI GROUP: COMPANY SNAPSHOT
- TABLE 87. RECORDATI GROUP: PRODUCT SEGMENTS
- TABLE 88. RECORDATI GROUP: PRODUCT PORTFOLIO
- TABLE 89. RECORDATI GROUP: KEY STRATERGIES
- TABLE 90. ASTRAZENECA PLC: KEY EXECUTIVES
- TABLE 91. ASTRAZENECA PLC: COMPANY SNAPSHOT
- TABLE 92. ASTRAZENECA PLC: PRODUCT SEGMENTS
- TABLE 93. ASTRAZENECA PLC: PRODUCT PORTFOLIO
- TABLE 94. BRISTOL-MYERS SQUIBB COMPANY: KEY EXECUTIVES
- TABLE 95. BRISTOL-MYERS SQUIBB COMPANY: COMPANY SNAPSHOT
- TABLE 96. BRISTOL-MYERS SQUIBB COMPANY: PRODUCT SEGMENTS
- TABLE 97. BRISTOL-MYERS SQUIBB COMPANY: PRODUCT PORTFOLIO
- TABLE 98. CELLECTAR BIOSCIENCES, INC.: KEY EXECUTIVES
- TABLE 99. CELLECTAR BIOSCIENCES, INC.: COMPANY SNAPSHOT
- TABLE 100. CELLECTAR BIOSCIENCES, INC.: PRODUCT SEGMENTS
- TABLE 101. CELLECTAR BIOSCIENCES, INC.: PRODUCT PORTFOLIO
- TABLE 102. ELI LILLY AND COMPANY: KEY EXECUTIVES
- TABLE 103. ELI LILLY AND COMPANY: COMPANY SNAPSHOT
- TABLE 104. ELI LILLY AND COMPANY: PRODUCT SEGMENTS
- TABLE 105. ELI LILLY AND COMPANY: PRODUCT PORTFOLIO
- TABLE 106. MACROGENICS INC.: KEY EXECUTIVES
- TABLE 107. MACROGENICS INC.: COMPANY SNAPSHOT
- TABLE 108. MACROGENICS INC.: PRODUCT SEGMENTS
- TABLE 109. MACROGENICS INC.: PRODUCT PORTFOLIO
- TABLE 110. PFIZER INC.: KEY EXECUTIVES
- TABLE 111. PFIZER INC.: COMPANY SNAPSHOT
- TABLE 112. PFIZER INC.: PRODUCT SEGMENTS
- TABLE 113. PFIZER INC.: PRODUCT PORTFOLIO
- TABLE 114. TEVA PHARMACEUTICAL INDUSTRIES LTD.: KEY EXECUTIVES
- TABLE 115. TEVA PHARMACEUTICAL INDUSTRIES LTD.: COMPANY SNAPSHOT
- TABLE 116. TEVA PHARMACEUTICAL INDUSTRIES LTD.: PRODUCT SEGMENTS
- TABLE 117. TEVA PHARMACEUTICAL INDUSTRIES LTD.: PRODUCT PORTFOLIO
- TABLE 118. UNITED THERAPEUTICS CORPORATION: KEY EXECUTIVES
- TABLE 119. UNITED THERAPEUTICS CORPORATION: COMPANY SNAPSHOT
- TABLE 120. UNITED THERAPEUTICS CORPORATION: PRODUCT SEGMENTS
- TABLE 121. UNITED THERAPEUTICS CORPORATION: PRODUCT PORTFOLIO
- TABLE 122. UNITED THERAPEUTICS CORPORATION: KEY STRATERGIES
- TABLE 123. Y-MABS THERAPEUTICS, INC.: KEY EXECUTIVES
- TABLE 124. Y-MABS THERAPEUTICS, INC.: COMPANY SNAPSHOT
- TABLE 125. Y-MABS THERAPEUTICS, INC.: PRODUCT SEGMENTS
- TABLE 126. Y-MABS THERAPEUTICS, INC.: PRODUCT PORTFOLIO
- TABLE 127. Y-MABS THERAPEUTICS, INC.: KEY STRATERGIES
LIST OF FIGURES
- FIGURE 01. NEUROBLASTOMA DRUGS MARKET, 2022-2032
- FIGURE 02. SEGMENTATION OF NEUROBLASTOMA DRUGS MARKET,2022-2032
- FIGURE 03. TOP IMPACTING FACTORS IN NEUROBLASTOMA DRUGS MARKET (2022 TO 2032)
- FIGURE 04. TOP INVESTMENT POCKETS IN NEUROBLASTOMA DRUGS MARKET (2023-2032)
- FIGURE 05. MODERATE BARGAINING POWER OF SUPPLIERS
- FIGURE 06. MODERATE THREAT OF NEW ENTRANTS
- FIGURE 07. MODERATE THREAT OF SUBSTITUTES
- FIGURE 08. MODERATE INTENSITY OF RIVALRY
- FIGURE 09. MODERATE BARGAINING POWER OF BUYERS
- FIGURE 10. GLOBAL NEUROBLASTOMA DRUGS MARKET:DRIVERS, RESTRAINTS AND OPPORTUNITIES
- FIGURE 11. NEUROBLASTOMA DRUGS MARKET, BY TYPE, 2022 AND 2032(%)
- FIGURE 12. COMPARATIVE SHARE ANALYSIS OF NEUROBLASTOMA DRUGS MARKET FOR CHEMOTHERAPY, BY COUNTRY 2022 AND 2032(%)
- FIGURE 13. COMPARATIVE SHARE ANALYSIS OF NEUROBLASTOMA DRUGS MARKET FOR IMMUNOTHERAPY, BY COUNTRY 2022 AND 2032(%)
- FIGURE 14. COMPARATIVE SHARE ANALYSIS OF NEUROBLASTOMA DRUGS MARKET FOR OTHERS, BY COUNTRY 2022 AND 2032(%)
- FIGURE 15. NEUROBLASTOMA DRUGS MARKET, BY ROUTE OF ADMINISTRATION, 2022 AND 2032(%)
- FIGURE 16. COMPARATIVE SHARE ANALYSIS OF NEUROBLASTOMA DRUGS MARKET FOR ORAL, BY COUNTRY 2022 AND 2032(%)
- FIGURE 17. COMPARATIVE SHARE ANALYSIS OF NEUROBLASTOMA DRUGS MARKET FOR INJECTABLE, BY COUNTRY 2022 AND 2032(%)
- FIGURE 18. NEUROBLASTOMA DRUGS MARKET, BY DISTRIBUTION CHANNEL, 2022 AND 2032(%)
- FIGURE 19. COMPARATIVE SHARE ANALYSIS OF NEUROBLASTOMA DRUGS MARKET FOR ONLINE, BY COUNTRY 2022 AND 2032(%)
- FIGURE 20. COMPARATIVE SHARE ANALYSIS OF NEUROBLASTOMA DRUGS MARKET FOR OFFLINE, BY COUNTRY 2022 AND 2032(%)
- FIGURE 21. NEUROBLASTOMA DRUGS MARKET BY REGION, 2022 AND 2032(%)
- FIGURE 22. U.S. NEUROBLASTOMA DRUGS MARKET, 2022-2032 ($MILLION)
- FIGURE 23. CANADA NEUROBLASTOMA DRUGS MARKET, 2022-2032 ($MILLION)
- FIGURE 24. MEXICO NEUROBLASTOMA DRUGS MARKET, 2022-2032 ($MILLION)
- FIGURE 25. GERMANY NEUROBLASTOMA DRUGS MARKET, 2022-2032 ($MILLION)
- FIGURE 26. FRANCE NEUROBLASTOMA DRUGS MARKET, 2022-2032 ($MILLION)
- FIGURE 27. UK NEUROBLASTOMA DRUGS MARKET, 2022-2032 ($MILLION)
- FIGURE 28. ITALY NEUROBLASTOMA DRUGS MARKET, 2022-2032 ($MILLION)
- FIGURE 29. SPAIN NEUROBLASTOMA DRUGS MARKET, 2022-2032 ($MILLION)
- FIGURE 30. REST OF EUROPE NEUROBLASTOMA DRUGS MARKET, 2022-2032 ($MILLION)
- FIGURE 31. JAPAN NEUROBLASTOMA DRUGS MARKET, 2022-2032 ($MILLION)
- FIGURE 32. CHINA NEUROBLASTOMA DRUGS MARKET, 2022-2032 ($MILLION)
- FIGURE 33. INDIA NEUROBLASTOMA DRUGS MARKET, 2022-2032 ($MILLION)
- FIGURE 34. AUSTRALIA NEUROBLASTOMA DRUGS MARKET, 2022-2032 ($MILLION)
- FIGURE 35. SOUTH KOREA NEUROBLASTOMA DRUGS MARKET, 2022-2032 ($MILLION)
- FIGURE 36. REST OF ASIA-PACIFIC NEUROBLASTOMA DRUGS MARKET, 2022-2032 ($MILLION)
- FIGURE 37. BRAZIL NEUROBLASTOMA DRUGS MARKET, 2022-2032 ($MILLION)
- FIGURE 38. SAUDI ARABIA NEUROBLASTOMA DRUGS MARKET, 2022-2032 ($MILLION)
- FIGURE 39. SOUTH AFRICA NEUROBLASTOMA DRUGS MARKET, 2022-2032 ($MILLION)
- FIGURE 40. REST OF LAMEA NEUROBLASTOMA DRUGS MARKET, 2022-2032 ($MILLION)
- FIGURE 41. TOP WINNING STRATEGIES, BY YEAR (2020-2023)
- FIGURE 42. TOP WINNING STRATEGIES, BY DEVELOPMENT (2020-2023)
- FIGURE 43. TOP WINNING STRATEGIES, BY COMPANY (2020-2023)
- FIGURE 44. PRODUCT MAPPING OF TOP 10 PLAYERS
- FIGURE 45. COMPETITIVE DASHBOARD
- FIGURE 46. COMPETITIVE HEATMAP: NEUROBLASTOMA DRUGS MARKET
- FIGURE 47. TOP PLAYER POSITIONING, 2022
- FIGURE 48. RECORDATI GROUP: NET REVENUE, 2020-2022 ($MILLION)
- FIGURE 49. RECORDATI GROUP: REVENUE SHARE BY SEGMENT, 2022 (%)
- FIGURE 50. RECORDATI GROUP: REVENUE SHARE BY REGION, 2022 (%)
- FIGURE 51. ASTRAZENECA PLC: NET REVENUE, 2020-2022 ($MILLION)
- FIGURE 52. ASTRAZENECA PLC: REVENUE SHARE BY REGION, 2022 (%)
- FIGURE 53. BRISTOL-MYERS SQUIBB COMPANY: NET REVENUE, 2020-2022 ($MILLION)
- FIGURE 54. BRISTOL-MYERS SQUIBB COMPANY: REVENUE SHARE BY REGION, 2022 (%)
- FIGURE 55. ELI LILLY AND COMPANY: NET REVENUE, 2020-2022 ($MILLION)
- FIGURE 56. ELI LILLY AND COMPANY: REVENUE SHARE BY REGION, 2022 (%)
- FIGURE 57. MACROGENICS INC.: NET REVENUE, 2020-2022 ($MILLION)
- FIGURE 58. PFIZER INC.: NET REVENUE, 2020-2022 ($MILLION)
- FIGURE 59. PFIZER INC.: REVENUE SHARE BY SEGMENT, 2022 (%)
- FIGURE 60. PFIZER INC.: REVENUE SHARE BY REGION, 2022 (%)
- FIGURE 61. TEVA PHARMACEUTICAL INDUSTRIES LTD.: NET REVENUE, 2020-2022 ($MILLION)
- FIGURE 62. TEVA PHARMACEUTICAL INDUSTRIES LTD.: REVENUE SHARE BY SEGMENT, 2022 (%)
- FIGURE 63. TEVA PHARMACEUTICAL INDUSTRIES LTD.: REVENUE SHARE BY REGION, 2022 (%)
- FIGURE 64. UNITED THERAPEUTICS CORPORATION: NET SALES, 2020-2022 ($MILLION)
- FIGURE 65. UNITED THERAPEUTICS CORPORATION: REVENUE SHARE BY REGION, 2022 (%)
- FIGURE 66. Y-MABS THERAPEUTICS, INC.: NET REVENUE, 2020-2022 ($MILLION)


