


 |
市場調查報告書
商品編碼
1446404
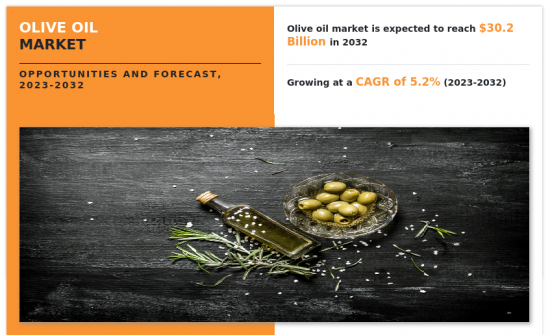
橄欖油市場:按類型、應用、分銷管道分類:2023-2032 年全球機會分析和產業預測Olive Oil Market By Type, By Application, By Distribution Channel : Global Opportunity Analysis and Industry Forecast, 2023-2032 |
||||||
品質保證和認證在橄欖油市場創造巨大機會方面發揮著至關重要的作用。
隨著消費者越來越重視產品的透明度和真實性,獲得原產地命名保護 (PDO) 和特級初榨橄欖油 (EVOO) 印章等公認的認證可以增強對產品品質的信心。這增強了消費者的信心,並在市場上提供了競爭優勢,挑剔的買家尋求確保遵守嚴格的品質標準。透過投資嚴格的品管措施並獲得認證,品牌和生產商可以利用這些憑證來區分他們的產品,獲得高價位,並增加他們對高品質、正宗橄欖油的信任。我們可以抓住不斷成長的需求。此外,品質保證和認證工作為市場差異化和國際市場擴張創造了機會。在食品安全和真實性成為最受關注的時代,經過認證的橄欖油產品成為消費者的可靠選擇。這在消費者可能不熟悉地區差異的全球市場中尤其重要。認證是品質的普遍象徵,為橄欖油生產商進入新市場開闢了道路,提高了品牌聲譽,並為整個橄欖油行業的成長和永續性做出了貢獻。
然而,病蟲害風險威脅著橄欖樹的健康和生產力,對橄欖油市場構成了重大限制。橄欖園容易受到橄欖果蠅等害蟲和各種疾病的影響,包括細菌感染。由於病蟲害防治的需要,病蟲害會降低橄欖產量、降低果實品質並增加生產成本。這些風險的影響可能導致橄欖油供應波動,影響市場穩定並引起價格波動。綜合害蟲管理策略和抗病橄欖品種等積極措施對於降低這些風險並確保穩定和健康的橄欖油供應至關重要。與病蟲害風險相關的不確定性也為橄欖油生產商滿足不斷成長的全球需求帶來了挑戰。消費者對高品質、未受污染的橄欖油的偏好推動了對仔細監測和預防措施的需求,而保持橄欖油市場的強勁需要永續和有彈性的農業,這強調了實踐的重要性。
橄欖油市場分為類型、應用、分銷管道和地區。按類型分類,市場分為精製、初榨、特級初榨和其他。依用途分為食品和飲料、個人護理品、化妝品、藥品等。依分銷通路分為大賣場/超級市場、百貨商店、網路零售、醫藥店。按地區分類,北美(美國、加拿大、墨西哥)、歐洲(英國、德國、法國、義大利、西班牙、其他歐洲國家地區)、亞太地區(中國、日本、印度、澳洲、印尼、其他亞太地區)、 LA,用MEA 分析。
相關人員的主要利益
- 該報告定量分析了 2022 年至 2032 年橄欖油市場分析的細分市場、當前趨勢、估計/趨勢分析和動態,並確定了橄欖油市場的強大機會。
- 我們提供市場研究以及與市場促進因素、市場限制和市場機會相關的資訊。
- 波特的五力分析強調買家和供應商幫助相關人員做出利潤驅動的商業決策並加強供應商-買家網路的力量。
- 對橄欖油市場細分的詳細分析有助於識別市場機會。
- 每個地區的主要國家都根據其對全球市場的收益貢獻繪製了地圖。
- 市場公司定位有助於對標,並清楚了解市場公司的當前地位。
- 該報告包括對區域和全球橄欖油市場趨勢、主要企業、細分市場、應用領域和市場成長策略的分析。
可以使用此報告進行報告客製化(需要額外的成本和時間表)
- 產品中所含原料分析(%)
- 製造能力
- 資本投資明細
- 消費者購買行為分析
- 按產品/細分市場分類的公司市場區隔分析
- 新產品開發/各大公司產品矩陣
- 痛點分析
- 品牌佔有率分析
- 十字交叉細分市場分析—市場規模與預測
- 歷史市場資料
- 導入/匯出分析/資料
- 主要企業詳細資料(Excel 格式,包括位置、聯絡資訊、供應商/供應商網路等)
- 全球/區域/國家層級公司的市場佔有率分析
目錄
第1章簡介
第 2 章執行摘要
第3章市場概況
- 市場定義和範圍
- 主要發現
- 影響因素
- 主要投資機會
- 波特五力分析
- 市場動態
- 促進因素
- 抑制因素
- 機會
第4章橄欖油市場:依類型
- 概述
- 精製
- 處女
- 特級初榨
- 其他
第5章橄欖油市場:依應用分類
- 概述
- 食品和飲料
- 個人護理和化妝品
- 藥品
- 其他
第6章 橄欖油市場:依通路分類
- 概述
- 大賣場/超級市場
- 百貨公司
- 網路零售店
- 醫藥店
第7章 橄欖油市場:依地區
- 概述
- 北美洲
- 美國
- 加拿大
- 墨西哥
- 歐洲
- 英國
- 德國
- 法國
- 義大利
- 西班牙
- 其他
- 亞太地區
- 中國
- 印度
- 日本
- 韓國
- 澳洲
- 其他
- 拉丁美洲
- 巴西
- 阿根廷
- 其他拉丁美洲
- 中東/非洲
- 南非
- 沙烏地阿拉伯
- 其他
第8章 競爭格局
- 介紹
- 關鍵成功策略
- 10家主要企業產品圖譜
- 競爭對手儀表板
- 競爭熱圖
- 2022年主要企業定位
第9章 公司簡介
- Deoleo
- SOVENA
- GRUPPO SALOV
- Del Monte Foods Private Limited
- California Olive Ranch, Inc.
- Borges INTERNATIONAL GROUP
- POMPEIAN
- Cargill
- Conagra Brands
- Modi Naturals Ltd
Quality assurance and certification play a pivotal role in creating significant opportunities in the olive oil market. As consumers increasingly prioritize product transparency and authenticity, obtaining recognized certifications, such as the Protected Designation of Origin (PDO) or the Extra Virgin Olive Oil (EVOO) seal, can instill confidence in the quality of the product. This fosters consumer trust and provides a competitive edge in a market where discerning buyers seek assurance of adherence to stringent quality standards. Brands and producers investing in rigorous quality control measures and obtaining certifications can leverage these credentials to differentiate their products, command premium pricing, and tap into the growing demand for high-quality, authentic olive oil. Moreover, quality assurance and certification initiatives create opportunities for market differentiation and international market penetration. In an era where food safety and authenticity are paramount concerns, certified olive oil products stand out as reliable choices for consumers. This becomes especially pertinent in global markets where consumers may be unfamiliar with regional variations. Certification acts as a universal symbol of quality that opens doors for olive oil producers to access new markets, strengthen their brand reputation, and contributes to the overall growth & sustainability of the olive oil industry.
However, pest and disease risks pose significant restraints on the olive oil market by threatening the health and productivity of olive trees. Olive orchards are vulnerable to pests like the olive fruit fly and various diseases, including bacterial infections. Outbreaks can result in reduced olive yields, lower-quality fruit, and increased production costs due to the need for pest control measures. The impact of these risks can lead to fluctuations in the olive oil supply, affecting market stability and potentially causing price volatility. Proactive measures, such as integrated pest management strategies and disease-resistant olive varieties, are essential to mitigate these risks and ensure a consistent and healthy olive oil supply. The uncertainty associated with pest and disease risks also creates challenges for olive oil producers in meeting the rising global demand. Consumer preferences for high-quality, uncontaminated olive oil drive the need for vigilant monitoring and preventive measures, emphasizing the importance of sustainable and resilient agricultural practices in maintaining a robust olive oil market.
The olive oil market is segmented into type, application, distribution channel, and region. By type, the market is divided into refined, virgin, extra virgin, and others. By application, the market is classified into food & beverage, personal care, and cosmetics. pharmaceuticals, and others. By distribution channel, the market is classified into hypermarkets/supermarkets, departmental stores, online retail, and medical stores. Region-wise, it is analyzed across North America (U.S., Canada, Mexico), Europe (UK, Germany, France, Italy, Spain, and Rest of Europe), Asia-Pacific (China, Japan, India, Australia, Indonesia, and Rest of Asia-Pacific), LA and MEA.
The major players operating in the market focus on key market strategies, such as mergers, product launches, acquisitions, collaborations, and partnerships. They have been also focusing on strengthening their market reach to maintain their goodwill in the ever-competitive market. Some of the key players in the olive oil market include Deoleo, SOVENA, GRUPPO SALOV, Del Monte Foods Private Limited, California Olive Ranch, Inc., Borges INTERNATIONAL GROUP, S.L.U., POMPEIAN, Cargill, Conagra Brands, and Modi Naturals Ltd.
Key Benefits For Stakeholders
- This report provides a quantitative analysis of the market segments, current trends, estimations, and dynamics of the olive oil market analysis from 2022 to 2032 to identify the prevailing olive oil market opportunities.
- The market research is offered along with information related to key drivers, restraints, and opportunities.
- Porter's five forces analysis highlights the potency of buyers and suppliers to enable stakeholders make profit-oriented business decisions and strengthen their supplier-buyer network.
- In-depth analysis of the olive oil market segmentation assists to determine the prevailing market opportunities.
- Major countries in each region are mapped according to their revenue contribution to the global market.
- Market player positioning facilitates benchmarking and provides a clear understanding of the present position of the market players.
- The report includes the analysis of the regional as well as global olive oil market trends, key players, market segments, application areas, and market growth strategies.
Additional benefits you will get with this purchase are:
- Quarterly Update and* (only available with a corporate license, on listed price)
- 5 additional Company Profile of client Choice pre- or Post-purchase, as a free update.
- Free Upcoming Version on the Purchase of Five and Enterprise User License.
- 16 analyst hours of support* (post-purchase, if you find additional data requirements upon review of the report, you may receive support amounting to 16 analyst hours to solve questions, and post-sale queries)
- 15% Free Customization* (in case the scope or segment of the report does not match your requirements, 15% is equivalent to 3 working days of free work, applicable once)
- Free data Pack on the Five and Enterprise User License. (Excel version of the report)
- Free Updated report if the report is 6-12 months old or older.
- 24-hour priority response*
- Free Industry updates and white papers.
Possible Customization with this report (with additional cost and timeline, please talk to the sales executive to know more)
- Analysis of raw material in a product (by %)
- Manufacturing Capacity
- Capital Investment breakdown
- Consumer Buying Behavior Analysis
- Market share analysis of players by products/segments
- New Product Development/ Product Matrix of Key Players
- Pain Point Analysis
- Brands Share Analysis
- Criss-cross segment analysis- market size and forecast
- Historic market data
- Import Export Analysis/Data
- Key player details (including location, contact details, supplier/vendor network etc. in excel format)
- Market share analysis of players at global/region/country level
Key Market Segments
By Distribution Channel
- Hypermarkets/Supermarkets
- Departmental Stores
- Online Retail Stores
- Medical Stores
By Type
- Refined
- Virgin
- Extra Virgin
- Others
By Application
- Personal Care and Cosmetics
- Pharmaceuticals
- Others
- Food and Beverage
By Region
- North America
- U.S.
- Canada
- Mexico
- Europe
- UK
- Germany
- France
- Italy
- Spain
- Rest of Europe
- Asia-Pacific
- China
- India
- Japan
- South Korea
- Australia
- Rest of Asia-Pacific
- Latin America
- Brazil
- Argentina
- Rest of Latin America
- Middle East and Africa
- South Africa
- Saudi Arabia
- Rest Of Mea
Key Market Players:
- Deoleo
- SOVENA
- GRUPPO SALOV
- Del Monte Foods Private Limited
- California Olive Ranch, Inc.
- Borges INTERNATIONAL GROUP
- POMPEIAN
- Cargill
- Conagra Brands
- Modi Naturals Ltd
TABLE OF CONTENTS
CHAPTER 1: INTRODUCTION
- 1.1. Report description
- 1.2. Key market segments
- 1.3. Key benefits to the stakeholders
- 1.4. Research methodology
- 1.4.1. Primary research
- 1.4.2. Secondary research
- 1.4.3. Analyst tools and models
CHAPTER 2: EXECUTIVE SUMMARY
- 2.1. CXO Perspective
CHAPTER 3: MARKET OVERVIEW
- 3.1. Market definition and scope
- 3.2. Key findings
- 3.2.1. Top impacting factors
- 3.2.2. Top investment pockets
- 3.3. Porter's five forces analysis
- 3.4. Market dynamics
- 3.4.1. Drivers
- 3.4.2. Restraints
- 3.4.3. Opportunities
CHAPTER 4: OLIVE OIL MARKET, BY TYPE
- 4.1. Overview
- 4.1.1. Market size and forecast
- 4.2. Refined
- 4.2.1. Key market trends, growth factors and opportunities
- 4.2.2. Market size and forecast, by region
- 4.2.3. Market share analysis by country
- 4.3. Virgin
- 4.3.1. Key market trends, growth factors and opportunities
- 4.3.2. Market size and forecast, by region
- 4.3.3. Market share analysis by country
- 4.4. Extra Virgin
- 4.4.1. Key market trends, growth factors and opportunities
- 4.4.2. Market size and forecast, by region
- 4.4.3. Market share analysis by country
- 4.5. Others
- 4.5.1. Key market trends, growth factors and opportunities
- 4.5.2. Market size and forecast, by region
- 4.5.3. Market share analysis by country
CHAPTER 5: OLIVE OIL MARKET, BY APPLICATION
- 5.1. Overview
- 5.1.1. Market size and forecast
- 5.2. Food and Beverage
- 5.2.1. Key market trends, growth factors and opportunities
- 5.2.2. Market size and forecast, by region
- 5.2.3. Market share analysis by country
- 5.3. Personal Care and Cosmetics
- 5.3.1. Key market trends, growth factors and opportunities
- 5.3.2. Market size and forecast, by region
- 5.3.3. Market share analysis by country
- 5.4. Pharmaceuticals
- 5.4.1. Key market trends, growth factors and opportunities
- 5.4.2. Market size and forecast, by region
- 5.4.3. Market share analysis by country
- 5.5. Others
- 5.5.1. Key market trends, growth factors and opportunities
- 5.5.2. Market size and forecast, by region
- 5.5.3. Market share analysis by country
CHAPTER 6: OLIVE OIL MARKET, BY DISTRIBUTION CHANNEL
- 6.1. Overview
- 6.1.1. Market size and forecast
- 6.2. Hypermarkets/Supermarkets
- 6.2.1. Key market trends, growth factors and opportunities
- 6.2.2. Market size and forecast, by region
- 6.2.3. Market share analysis by country
- 6.3. Departmental Stores
- 6.3.1. Key market trends, growth factors and opportunities
- 6.3.2. Market size and forecast, by region
- 6.3.3. Market share analysis by country
- 6.4. Online Retail Stores
- 6.4.1. Key market trends, growth factors and opportunities
- 6.4.2. Market size and forecast, by region
- 6.4.3. Market share analysis by country
- 6.5. Medical Stores
- 6.5.1. Key market trends, growth factors and opportunities
- 6.5.2. Market size and forecast, by region
- 6.5.3. Market share analysis by country
CHAPTER 7: OLIVE OIL MARKET, BY REGION
- 7.1. Overview
- 7.1.1. Market size and forecast By Region
- 7.2. North America
- 7.2.1. Key market trends, growth factors and opportunities
- 7.2.2. Market size and forecast, by Type
- 7.2.3. Market size and forecast, by Application
- 7.2.4. Market size and forecast, by Distribution Channel
- 7.2.5. Market size and forecast, by country
- 7.2.5.1. U.S.
- 7.2.5.1.1. Market size and forecast, by Type
- 7.2.5.1.2. Market size and forecast, by Application
- 7.2.5.1.3. Market size and forecast, by Distribution Channel
- 7.2.5.2. Canada
- 7.2.5.2.1. Market size and forecast, by Type
- 7.2.5.2.2. Market size and forecast, by Application
- 7.2.5.2.3. Market size and forecast, by Distribution Channel
- 7.2.5.3. Mexico
- 7.2.5.3.1. Market size and forecast, by Type
- 7.2.5.3.2. Market size and forecast, by Application
- 7.2.5.3.3. Market size and forecast, by Distribution Channel
- 7.3. Europe
- 7.3.1. Key market trends, growth factors and opportunities
- 7.3.2. Market size and forecast, by Type
- 7.3.3. Market size and forecast, by Application
- 7.3.4. Market size and forecast, by Distribution Channel
- 7.3.5. Market size and forecast, by country
- 7.3.5.1. UK
- 7.3.5.1.1. Market size and forecast, by Type
- 7.3.5.1.2. Market size and forecast, by Application
- 7.3.5.1.3. Market size and forecast, by Distribution Channel
- 7.3.5.2. Germany
- 7.3.5.2.1. Market size and forecast, by Type
- 7.3.5.2.2. Market size and forecast, by Application
- 7.3.5.2.3. Market size and forecast, by Distribution Channel
- 7.3.5.3. France
- 7.3.5.3.1. Market size and forecast, by Type
- 7.3.5.3.2. Market size and forecast, by Application
- 7.3.5.3.3. Market size and forecast, by Distribution Channel
- 7.3.5.4. Italy
- 7.3.5.4.1. Market size and forecast, by Type
- 7.3.5.4.2. Market size and forecast, by Application
- 7.3.5.4.3. Market size and forecast, by Distribution Channel
- 7.3.5.5. Spain
- 7.3.5.5.1. Market size and forecast, by Type
- 7.3.5.5.2. Market size and forecast, by Application
- 7.3.5.5.3. Market size and forecast, by Distribution Channel
- 7.3.5.6. Rest of Europe
- 7.3.5.6.1. Market size and forecast, by Type
- 7.3.5.6.2. Market size and forecast, by Application
- 7.3.5.6.3. Market size and forecast, by Distribution Channel
- 7.4. Asia-Pacific
- 7.4.1. Key market trends, growth factors and opportunities
- 7.4.2. Market size and forecast, by Type
- 7.4.3. Market size and forecast, by Application
- 7.4.4. Market size and forecast, by Distribution Channel
- 7.4.5. Market size and forecast, by country
- 7.4.5.1. China
- 7.4.5.1.1. Market size and forecast, by Type
- 7.4.5.1.2. Market size and forecast, by Application
- 7.4.5.1.3. Market size and forecast, by Distribution Channel
- 7.4.5.2. India
- 7.4.5.2.1. Market size and forecast, by Type
- 7.4.5.2.2. Market size and forecast, by Application
- 7.4.5.2.3. Market size and forecast, by Distribution Channel
- 7.4.5.3. Japan
- 7.4.5.3.1. Market size and forecast, by Type
- 7.4.5.3.2. Market size and forecast, by Application
- 7.4.5.3.3. Market size and forecast, by Distribution Channel
- 7.4.5.4. South Korea
- 7.4.5.4.1. Market size and forecast, by Type
- 7.4.5.4.2. Market size and forecast, by Application
- 7.4.5.4.3. Market size and forecast, by Distribution Channel
- 7.4.5.5. Australia
- 7.4.5.5.1. Market size and forecast, by Type
- 7.4.5.5.2. Market size and forecast, by Application
- 7.4.5.5.3. Market size and forecast, by Distribution Channel
- 7.4.5.6. Rest of Asia-Pacific
- 7.4.5.6.1. Market size and forecast, by Type
- 7.4.5.6.2. Market size and forecast, by Application
- 7.4.5.6.3. Market size and forecast, by Distribution Channel
- 7.5. Latin America
- 7.5.1. Key market trends, growth factors and opportunities
- 7.5.2. Market size and forecast, by Type
- 7.5.3. Market size and forecast, by Application
- 7.5.4. Market size and forecast, by Distribution Channel
- 7.5.5. Market size and forecast, by country
- 7.5.5.1. Brazil
- 7.5.5.1.1. Market size and forecast, by Type
- 7.5.5.1.2. Market size and forecast, by Application
- 7.5.5.1.3. Market size and forecast, by Distribution Channel
- 7.5.5.2. Argentina
- 7.5.5.2.1. Market size and forecast, by Type
- 7.5.5.2.2. Market size and forecast, by Application
- 7.5.5.2.3. Market size and forecast, by Distribution Channel
- 7.5.5.3. Rest of Latin America
- 7.5.5.3.1. Market size and forecast, by Type
- 7.5.5.3.2. Market size and forecast, by Application
- 7.5.5.3.3. Market size and forecast, by Distribution Channel
- 7.6. Middle East and Africa
- 7.6.1. Key market trends, growth factors and opportunities
- 7.6.2. Market size and forecast, by Type
- 7.6.3. Market size and forecast, by Application
- 7.6.4. Market size and forecast, by Distribution Channel
- 7.6.5. Market size and forecast, by country
- 7.6.5.1. South Africa
- 7.6.5.1.1. Market size and forecast, by Type
- 7.6.5.1.2. Market size and forecast, by Application
- 7.6.5.1.3. Market size and forecast, by Distribution Channel
- 7.6.5.2. Saudi Arabia
- 7.6.5.2.1. Market size and forecast, by Type
- 7.6.5.2.2. Market size and forecast, by Application
- 7.6.5.2.3. Market size and forecast, by Distribution Channel
- 7.6.5.3. Rest Of Mea
- 7.6.5.3.1. Market size and forecast, by Type
- 7.6.5.3.2. Market size and forecast, by Application
- 7.6.5.3.3. Market size and forecast, by Distribution Channel
CHAPTER 8: COMPETITIVE LANDSCAPE
- 8.1. Introduction
- 8.2. Top winning strategies
- 8.3. Product mapping of top 10 player
- 8.4. Competitive dashboard
- 8.5. Competitive heatmap
- 8.6. Top player positioning, 2022
CHAPTER 9: COMPANY PROFILES
- 9.1. Deoleo
- 9.1.1. Company overview
- 9.1.2. Key executives
- 9.1.3. Company snapshot
- 9.1.4. Operating business segments
- 9.1.5. Product portfolio
- 9.1.6. Business performance
- 9.1.7. Key strategic moves and developments
- 9.2. SOVENA
- 9.2.1. Company overview
- 9.2.2. Key executives
- 9.2.3. Company snapshot
- 9.2.4. Operating business segments
- 9.2.5. Product portfolio
- 9.2.6. Business performance
- 9.2.7. Key strategic moves and developments
- 9.3. GRUPPO SALOV
- 9.3.1. Company overview
- 9.3.2. Key executives
- 9.3.3. Company snapshot
- 9.3.4. Operating business segments
- 9.3.5. Product portfolio
- 9.3.6. Business performance
- 9.3.7. Key strategic moves and developments
- 9.4. Del Monte Foods Private Limited
- 9.4.1. Company overview
- 9.4.2. Key executives
- 9.4.3. Company snapshot
- 9.4.4. Operating business segments
- 9.4.5. Product portfolio
- 9.4.6. Business performance
- 9.4.7. Key strategic moves and developments
- 9.5. California Olive Ranch, Inc.
- 9.5.1. Company overview
- 9.5.2. Key executives
- 9.5.3. Company snapshot
- 9.5.4. Operating business segments
- 9.5.5. Product portfolio
- 9.5.6. Business performance
- 9.5.7. Key strategic moves and developments
- 9.6. Borges INTERNATIONAL GROUP
- 9.6.1. Company overview
- 9.6.2. Key executives
- 9.6.3. Company snapshot
- 9.6.4. Operating business segments
- 9.6.5. Product portfolio
- 9.6.6. Business performance
- 9.6.7. Key strategic moves and developments
- 9.7. POMPEIAN
- 9.7.1. Company overview
- 9.7.2. Key executives
- 9.7.3. Company snapshot
- 9.7.4. Operating business segments
- 9.7.5. Product portfolio
- 9.7.6. Business performance
- 9.7.7. Key strategic moves and developments
- 9.8. Cargill
- 9.8.1. Company overview
- 9.8.2. Key executives
- 9.8.3. Company snapshot
- 9.8.4. Operating business segments
- 9.8.5. Product portfolio
- 9.8.6. Business performance
- 9.8.7. Key strategic moves and developments
- 9.9. Conagra Brands
- 9.9.1. Company overview
- 9.9.2. Key executives
- 9.9.3. Company snapshot
- 9.9.4. Operating business segments
- 9.9.5. Product portfolio
- 9.9.6. Business performance
- 9.9.7. Key strategic moves and developments
- 9.10. Modi Naturals Ltd
- 9.10.1. Company overview
- 9.10.2. Key executives
- 9.10.3. Company snapshot
- 9.10.4. Operating business segments
- 9.10.5. Product portfolio
- 9.10.6. Business performance
- 9.10.7. Key strategic moves and developments
LIST OF TABLES
- TABLE 01. GLOBAL OLIVE OIL MARKET, BY TYPE, 2022-2032 ($MILLION)
- TABLE 02. OLIVE OIL MARKET FOR REFINED, BY REGION, 2022-2032 ($MILLION)
- TABLE 03. OLIVE OIL MARKET FOR VIRGIN, BY REGION, 2022-2032 ($MILLION)
- TABLE 04. OLIVE OIL MARKET FOR EXTRA VIRGIN, BY REGION, 2022-2032 ($MILLION)
- TABLE 05. OLIVE OIL MARKET FOR OTHERS, BY REGION, 2022-2032 ($MILLION)
- TABLE 06. GLOBAL OLIVE OIL MARKET, BY APPLICATION, 2022-2032 ($MILLION)
- TABLE 07. OLIVE OIL MARKET FOR FOOD AND BEVERAGE, BY REGION, 2022-2032 ($MILLION)
- TABLE 08. OLIVE OIL MARKET FOR PERSONAL CARE AND COSMETICS, BY REGION, 2022-2032 ($MILLION)
- TABLE 09. OLIVE OIL MARKET FOR PHARMACEUTICALS, BY REGION, 2022-2032 ($MILLION)
- TABLE 10. OLIVE OIL MARKET FOR OTHERS, BY REGION, 2022-2032 ($MILLION)
- TABLE 11. GLOBAL OLIVE OIL MARKET, BY DISTRIBUTION CHANNEL, 2022-2032 ($MILLION)
- TABLE 12. OLIVE OIL MARKET FOR HYPERMARKETS/SUPERMARKETS, BY REGION, 2022-2032 ($MILLION)
- TABLE 13. OLIVE OIL MARKET FOR DEPARTMENTAL STORES, BY REGION, 2022-2032 ($MILLION)
- TABLE 14. OLIVE OIL MARKET FOR ONLINE RETAIL STORES, BY REGION, 2022-2032 ($MILLION)
- TABLE 15. OLIVE OIL MARKET FOR MEDICAL STORES, BY REGION, 2022-2032 ($MILLION)
- TABLE 16. OLIVE OIL MARKET, BY REGION, 2022-2032 ($MILLION)
- TABLE 17. NORTH AMERICA OLIVE OIL MARKET, BY TYPE, 2022-2032 ($MILLION)
- TABLE 18. NORTH AMERICA OLIVE OIL MARKET, BY APPLICATION, 2022-2032 ($MILLION)
- TABLE 19. NORTH AMERICA OLIVE OIL MARKET, BY DISTRIBUTION CHANNEL, 2022-2032 ($MILLION)
- TABLE 20. NORTH AMERICA OLIVE OIL MARKET, BY COUNTRY, 2022-2032 ($MILLION)
- TABLE 21. U.S. OLIVE OIL MARKET, BY TYPE, 2022-2032 ($MILLION)
- TABLE 22. U.S. OLIVE OIL MARKET, BY APPLICATION, 2022-2032 ($MILLION)
- TABLE 23. U.S. OLIVE OIL MARKET, BY DISTRIBUTION CHANNEL, 2022-2032 ($MILLION)
- TABLE 24. CANADA OLIVE OIL MARKET, BY TYPE, 2022-2032 ($MILLION)
- TABLE 25. CANADA OLIVE OIL MARKET, BY APPLICATION, 2022-2032 ($MILLION)
- TABLE 26. CANADA OLIVE OIL MARKET, BY DISTRIBUTION CHANNEL, 2022-2032 ($MILLION)
- TABLE 27. MEXICO OLIVE OIL MARKET, BY TYPE, 2022-2032 ($MILLION)
- TABLE 28. MEXICO OLIVE OIL MARKET, BY APPLICATION, 2022-2032 ($MILLION)
- TABLE 29. MEXICO OLIVE OIL MARKET, BY DISTRIBUTION CHANNEL, 2022-2032 ($MILLION)
- TABLE 30. EUROPE OLIVE OIL MARKET, BY TYPE, 2022-2032 ($MILLION)
- TABLE 31. EUROPE OLIVE OIL MARKET, BY APPLICATION, 2022-2032 ($MILLION)
- TABLE 32. EUROPE OLIVE OIL MARKET, BY DISTRIBUTION CHANNEL, 2022-2032 ($MILLION)
- TABLE 33. EUROPE OLIVE OIL MARKET, BY COUNTRY, 2022-2032 ($MILLION)
- TABLE 34. UK OLIVE OIL MARKET, BY TYPE, 2022-2032 ($MILLION)
- TABLE 35. UK OLIVE OIL MARKET, BY APPLICATION, 2022-2032 ($MILLION)
- TABLE 36. UK OLIVE OIL MARKET, BY DISTRIBUTION CHANNEL, 2022-2032 ($MILLION)
- TABLE 37. GERMANY OLIVE OIL MARKET, BY TYPE, 2022-2032 ($MILLION)
- TABLE 38. GERMANY OLIVE OIL MARKET, BY APPLICATION, 2022-2032 ($MILLION)
- TABLE 39. GERMANY OLIVE OIL MARKET, BY DISTRIBUTION CHANNEL, 2022-2032 ($MILLION)
- TABLE 40. FRANCE OLIVE OIL MARKET, BY TYPE, 2022-2032 ($MILLION)
- TABLE 41. FRANCE OLIVE OIL MARKET, BY APPLICATION, 2022-2032 ($MILLION)
- TABLE 42. FRANCE OLIVE OIL MARKET, BY DISTRIBUTION CHANNEL, 2022-2032 ($MILLION)
- TABLE 43. ITALY OLIVE OIL MARKET, BY TYPE, 2022-2032 ($MILLION)
- TABLE 44. ITALY OLIVE OIL MARKET, BY APPLICATION, 2022-2032 ($MILLION)
- TABLE 45. ITALY OLIVE OIL MARKET, BY DISTRIBUTION CHANNEL, 2022-2032 ($MILLION)
- TABLE 46. SPAIN OLIVE OIL MARKET, BY TYPE, 2022-2032 ($MILLION)
- TABLE 47. SPAIN OLIVE OIL MARKET, BY APPLICATION, 2022-2032 ($MILLION)
- TABLE 48. SPAIN OLIVE OIL MARKET, BY DISTRIBUTION CHANNEL, 2022-2032 ($MILLION)
- TABLE 49. REST OF EUROPE OLIVE OIL MARKET, BY TYPE, 2022-2032 ($MILLION)
- TABLE 50. REST OF EUROPE OLIVE OIL MARKET, BY APPLICATION, 2022-2032 ($MILLION)
- TABLE 51. REST OF EUROPE OLIVE OIL MARKET, BY DISTRIBUTION CHANNEL, 2022-2032 ($MILLION)
- TABLE 52. ASIA-PACIFIC OLIVE OIL MARKET, BY TYPE, 2022-2032 ($MILLION)
- TABLE 53. ASIA-PACIFIC OLIVE OIL MARKET, BY APPLICATION, 2022-2032 ($MILLION)
- TABLE 54. ASIA-PACIFIC OLIVE OIL MARKET, BY DISTRIBUTION CHANNEL, 2022-2032 ($MILLION)
- TABLE 55. ASIA-PACIFIC OLIVE OIL MARKET, BY COUNTRY, 2022-2032 ($MILLION)
- TABLE 56. CHINA OLIVE OIL MARKET, BY TYPE, 2022-2032 ($MILLION)
- TABLE 57. CHINA OLIVE OIL MARKET, BY APPLICATION, 2022-2032 ($MILLION)
- TABLE 58. CHINA OLIVE OIL MARKET, BY DISTRIBUTION CHANNEL, 2022-2032 ($MILLION)
- TABLE 59. INDIA OLIVE OIL MARKET, BY TYPE, 2022-2032 ($MILLION)
- TABLE 60. INDIA OLIVE OIL MARKET, BY APPLICATION, 2022-2032 ($MILLION)
- TABLE 61. INDIA OLIVE OIL MARKET, BY DISTRIBUTION CHANNEL, 2022-2032 ($MILLION)
- TABLE 62. JAPAN OLIVE OIL MARKET, BY TYPE, 2022-2032 ($MILLION)
- TABLE 63. JAPAN OLIVE OIL MARKET, BY APPLICATION, 2022-2032 ($MILLION)
- TABLE 64. JAPAN OLIVE OIL MARKET, BY DISTRIBUTION CHANNEL, 2022-2032 ($MILLION)
- TABLE 65. SOUTH KOREA OLIVE OIL MARKET, BY TYPE, 2022-2032 ($MILLION)
- TABLE 66. SOUTH KOREA OLIVE OIL MARKET, BY APPLICATION, 2022-2032 ($MILLION)
- TABLE 67. SOUTH KOREA OLIVE OIL MARKET, BY DISTRIBUTION CHANNEL, 2022-2032 ($MILLION)
- TABLE 68. AUSTRALIA OLIVE OIL MARKET, BY TYPE, 2022-2032 ($MILLION)
- TABLE 69. AUSTRALIA OLIVE OIL MARKET, BY APPLICATION, 2022-2032 ($MILLION)
- TABLE 70. AUSTRALIA OLIVE OIL MARKET, BY DISTRIBUTION CHANNEL, 2022-2032 ($MILLION)
- TABLE 71. REST OF ASIA-PACIFIC OLIVE OIL MARKET, BY TYPE, 2022-2032 ($MILLION)
- TABLE 72. REST OF ASIA-PACIFIC OLIVE OIL MARKET, BY APPLICATION, 2022-2032 ($MILLION)
- TABLE 73. REST OF ASIA-PACIFIC OLIVE OIL MARKET, BY DISTRIBUTION CHANNEL, 2022-2032 ($MILLION)
- TABLE 74. LATIN AMERICA OLIVE OIL MARKET, BY TYPE, 2022-2032 ($MILLION)
- TABLE 75. LATIN AMERICA OLIVE OIL MARKET, BY APPLICATION, 2022-2032 ($MILLION)
- TABLE 76. LATIN AMERICA OLIVE OIL MARKET, BY DISTRIBUTION CHANNEL, 2022-2032 ($MILLION)
- TABLE 77. LATIN AMERICA OLIVE OIL MARKET, BY COUNTRY, 2022-2032 ($MILLION)
- TABLE 78. BRAZIL OLIVE OIL MARKET, BY TYPE, 2022-2032 ($MILLION)
- TABLE 79. BRAZIL OLIVE OIL MARKET, BY APPLICATION, 2022-2032 ($MILLION)
- TABLE 80. BRAZIL OLIVE OIL MARKET, BY DISTRIBUTION CHANNEL, 2022-2032 ($MILLION)
- TABLE 81. ARGENTINA OLIVE OIL MARKET, BY TYPE, 2022-2032 ($MILLION)
- TABLE 82. ARGENTINA OLIVE OIL MARKET, BY APPLICATION, 2022-2032 ($MILLION)
- TABLE 83. ARGENTINA OLIVE OIL MARKET, BY DISTRIBUTION CHANNEL, 2022-2032 ($MILLION)
- TABLE 84. REST OF LATIN AMERICA OLIVE OIL MARKET, BY TYPE, 2022-2032 ($MILLION)
- TABLE 85. REST OF LATIN AMERICA OLIVE OIL MARKET, BY APPLICATION, 2022-2032 ($MILLION)
- TABLE 86. REST OF LATIN AMERICA OLIVE OIL MARKET, BY DISTRIBUTION CHANNEL, 2022-2032 ($MILLION)
- TABLE 87. MIDDLE EAST AND AFRICA OLIVE OIL MARKET, BY TYPE, 2022-2032 ($MILLION)
- TABLE 88. MIDDLE EAST AND AFRICA OLIVE OIL MARKET, BY APPLICATION, 2022-2032 ($MILLION)
- TABLE 89. MIDDLE EAST AND AFRICA OLIVE OIL MARKET, BY DISTRIBUTION CHANNEL, 2022-2032 ($MILLION)
- TABLE 90. MIDDLE EAST AND AFRICA OLIVE OIL MARKET, BY COUNTRY, 2022-2032 ($MILLION)
- TABLE 91. SOUTH AFRICA OLIVE OIL MARKET, BY TYPE, 2022-2032 ($MILLION)
- TABLE 92. SOUTH AFRICA OLIVE OIL MARKET, BY APPLICATION, 2022-2032 ($MILLION)
- TABLE 93. SOUTH AFRICA OLIVE OIL MARKET, BY DISTRIBUTION CHANNEL, 2022-2032 ($MILLION)
- TABLE 94. SAUDI ARABIA OLIVE OIL MARKET, BY TYPE, 2022-2032 ($MILLION)
- TABLE 95. SAUDI ARABIA OLIVE OIL MARKET, BY APPLICATION, 2022-2032 ($MILLION)
- TABLE 96. SAUDI ARABIA OLIVE OIL MARKET, BY DISTRIBUTION CHANNEL, 2022-2032 ($MILLION)
- TABLE 97. REST OF MEA OLIVE OIL MARKET, BY TYPE, 2022-2032 ($MILLION)
- TABLE 98. REST OF MEA OLIVE OIL MARKET, BY APPLICATION, 2022-2032 ($MILLION)
- TABLE 99. REST OF MEA OLIVE OIL MARKET, BY DISTRIBUTION CHANNEL, 2022-2032 ($MILLION)
- TABLE 100. DEOLEO: KEY EXECUTIVES
- TABLE 101. DEOLEO: COMPANY SNAPSHOT
- TABLE 102. DEOLEO: PRODUCT SEGMENTS
- TABLE 103. DEOLEO: SERVICE SEGMENTS
- TABLE 104. DEOLEO: PRODUCT PORTFOLIO
- TABLE 105. DEOLEO: KEY STRATERGIES
- TABLE 106. SOVENA: KEY EXECUTIVES
- TABLE 107. SOVENA: COMPANY SNAPSHOT
- TABLE 108. SOVENA: PRODUCT SEGMENTS
- TABLE 109. SOVENA: SERVICE SEGMENTS
- TABLE 110. SOVENA: PRODUCT PORTFOLIO
- TABLE 111. SOVENA: KEY STRATERGIES
- TABLE 112. GRUPPO SALOV: KEY EXECUTIVES
- TABLE 113. GRUPPO SALOV: COMPANY SNAPSHOT
- TABLE 114. GRUPPO SALOV: PRODUCT SEGMENTS
- TABLE 115. GRUPPO SALOV: SERVICE SEGMENTS
- TABLE 116. GRUPPO SALOV: PRODUCT PORTFOLIO
- TABLE 117. GRUPPO SALOV: KEY STRATERGIES
- TABLE 118. DEL MONTE FOODS PRIVATE LIMITED: KEY EXECUTIVES
- TABLE 119. DEL MONTE FOODS PRIVATE LIMITED: COMPANY SNAPSHOT
- TABLE 120. DEL MONTE FOODS PRIVATE LIMITED: PRODUCT SEGMENTS
- TABLE 121. DEL MONTE FOODS PRIVATE LIMITED: SERVICE SEGMENTS
- TABLE 122. DEL MONTE FOODS PRIVATE LIMITED: PRODUCT PORTFOLIO
- TABLE 123. DEL MONTE FOODS PRIVATE LIMITED: KEY STRATERGIES
- TABLE 124. CALIFORNIA OLIVE RANCH, INC.: KEY EXECUTIVES
- TABLE 125. CALIFORNIA OLIVE RANCH, INC.: COMPANY SNAPSHOT
- TABLE 126. CALIFORNIA OLIVE RANCH, INC.: PRODUCT SEGMENTS
- TABLE 127. CALIFORNIA OLIVE RANCH, INC.: SERVICE SEGMENTS
- TABLE 128. CALIFORNIA OLIVE RANCH, INC.: PRODUCT PORTFOLIO
- TABLE 129. CALIFORNIA OLIVE RANCH, INC.: KEY STRATERGIES
- TABLE 130. BORGES INTERNATIONAL GROUP: KEY EXECUTIVES
- TABLE 131. BORGES INTERNATIONAL GROUP: COMPANY SNAPSHOT
- TABLE 132. BORGES INTERNATIONAL GROUP: PRODUCT SEGMENTS
- TABLE 133. BORGES INTERNATIONAL GROUP: SERVICE SEGMENTS
- TABLE 134. BORGES INTERNATIONAL GROUP: PRODUCT PORTFOLIO
- TABLE 135. BORGES INTERNATIONAL GROUP: KEY STRATERGIES
- TABLE 136. POMPEIAN: KEY EXECUTIVES
- TABLE 137. POMPEIAN: COMPANY SNAPSHOT
- TABLE 138. POMPEIAN: PRODUCT SEGMENTS
- TABLE 139. POMPEIAN: SERVICE SEGMENTS
- TABLE 140. POMPEIAN: PRODUCT PORTFOLIO
- TABLE 141. POMPEIAN: KEY STRATERGIES
- TABLE 142. CARGILL: KEY EXECUTIVES
- TABLE 143. CARGILL: COMPANY SNAPSHOT
- TABLE 144. CARGILL: PRODUCT SEGMENTS
- TABLE 145. CARGILL: SERVICE SEGMENTS
- TABLE 146. CARGILL: PRODUCT PORTFOLIO
- TABLE 147. CARGILL: KEY STRATERGIES
- TABLE 148. CONAGRA BRANDS: KEY EXECUTIVES
- TABLE 149. CONAGRA BRANDS: COMPANY SNAPSHOT
- TABLE 150. CONAGRA BRANDS: PRODUCT SEGMENTS
- TABLE 151. CONAGRA BRANDS: SERVICE SEGMENTS
- TABLE 152. CONAGRA BRANDS: PRODUCT PORTFOLIO
- TABLE 153. CONAGRA BRANDS: KEY STRATERGIES
- TABLE 154. MODI NATURALS LTD: KEY EXECUTIVES
- TABLE 155. MODI NATURALS LTD: COMPANY SNAPSHOT
- TABLE 156. MODI NATURALS LTD: PRODUCT SEGMENTS
- TABLE 157. MODI NATURALS LTD: SERVICE SEGMENTS
- TABLE 158. MODI NATURALS LTD: PRODUCT PORTFOLIO
- TABLE 159. MODI NATURALS LTD: KEY STRATERGIES
LIST OF FIGURES
- FIGURE 01. OLIVE OIL MARKET, 2022-2032
- FIGURE 02. SEGMENTATION OF OLIVE OIL MARKET,2022-2032
- FIGURE 03. TOP IMPACTING FACTORS IN OLIVE OIL MARKET
- FIGURE 04. TOP INVESTMENT POCKETS IN OLIVE OIL MARKET (2023-2032)
- FIGURE 05. BARGAINING POWER OF SUPPLIERS
- FIGURE 06. BARGAINING POWER OF BUYERS
- FIGURE 07. THREAT OF SUBSTITUTION
- FIGURE 08. THREAT OF SUBSTITUTION
- FIGURE 09. COMPETITIVE RIVALRY
- FIGURE 10. GLOBAL OLIVE OIL MARKET:DRIVERS, RESTRAINTS AND OPPORTUNITIES
- FIGURE 11. OLIVE OIL MARKET, BY TYPE, 2022 AND 2032(%)
- FIGURE 12. COMPARATIVE SHARE ANALYSIS OF OLIVE OIL MARKET FOR REFINED, BY COUNTRY 2022 AND 2032(%)
- FIGURE 13. COMPARATIVE SHARE ANALYSIS OF OLIVE OIL MARKET FOR VIRGIN, BY COUNTRY 2022 AND 2032(%)
- FIGURE 14. COMPARATIVE SHARE ANALYSIS OF OLIVE OIL MARKET FOR EXTRA VIRGIN, BY COUNTRY 2022 AND 2032(%)
- FIGURE 15. COMPARATIVE SHARE ANALYSIS OF OLIVE OIL MARKET FOR OTHERS, BY COUNTRY 2022 AND 2032(%)
- FIGURE 16. OLIVE OIL MARKET, BY APPLICATION, 2022 AND 2032(%)
- FIGURE 17. COMPARATIVE SHARE ANALYSIS OF OLIVE OIL MARKET FOR FOOD AND BEVERAGE, BY COUNTRY 2022 AND 2032(%)
- FIGURE 18. COMPARATIVE SHARE ANALYSIS OF OLIVE OIL MARKET FOR PERSONAL CARE AND COSMETICS, BY COUNTRY 2022 AND 2032(%)
- FIGURE 19. COMPARATIVE SHARE ANALYSIS OF OLIVE OIL MARKET FOR PHARMACEUTICALS, BY COUNTRY 2022 AND 2032(%)
- FIGURE 20. COMPARATIVE SHARE ANALYSIS OF OLIVE OIL MARKET FOR OTHERS, BY COUNTRY 2022 AND 2032(%)
- FIGURE 21. OLIVE OIL MARKET, BY DISTRIBUTION CHANNEL, 2022 AND 2032(%)
- FIGURE 22. COMPARATIVE SHARE ANALYSIS OF OLIVE OIL MARKET FOR HYPERMARKETS/SUPERMARKETS, BY COUNTRY 2022 AND 2032(%)
- FIGURE 23. COMPARATIVE SHARE ANALYSIS OF OLIVE OIL MARKET FOR DEPARTMENTAL STORES, BY COUNTRY 2022 AND 2032(%)
- FIGURE 24. COMPARATIVE SHARE ANALYSIS OF OLIVE OIL MARKET FOR ONLINE RETAIL STORES, BY COUNTRY 2022 AND 2032(%)
- FIGURE 25. COMPARATIVE SHARE ANALYSIS OF OLIVE OIL MARKET FOR MEDICAL STORES, BY COUNTRY 2022 AND 2032(%)
- FIGURE 26. OLIVE OIL MARKET BY REGION, 2022 AND 2032(%)
- FIGURE 27. U.S. OLIVE OIL MARKET, 2022-2032 ($MILLION)
- FIGURE 28. CANADA OLIVE OIL MARKET, 2022-2032 ($MILLION)
- FIGURE 29. MEXICO OLIVE OIL MARKET, 2022-2032 ($MILLION)
- FIGURE 30. UK OLIVE OIL MARKET, 2022-2032 ($MILLION)
- FIGURE 31. GERMANY OLIVE OIL MARKET, 2022-2032 ($MILLION)
- FIGURE 32. FRANCE OLIVE OIL MARKET, 2022-2032 ($MILLION)
- FIGURE 33. ITALY OLIVE OIL MARKET, 2022-2032 ($MILLION)
- FIGURE 34. SPAIN OLIVE OIL MARKET, 2022-2032 ($MILLION)
- FIGURE 35. REST OF EUROPE OLIVE OIL MARKET, 2022-2032 ($MILLION)
- FIGURE 36. CHINA OLIVE OIL MARKET, 2022-2032 ($MILLION)
- FIGURE 37. INDIA OLIVE OIL MARKET, 2022-2032 ($MILLION)
- FIGURE 38. JAPAN OLIVE OIL MARKET, 2022-2032 ($MILLION)
- FIGURE 39. SOUTH KOREA OLIVE OIL MARKET, 2022-2032 ($MILLION)
- FIGURE 40. AUSTRALIA OLIVE OIL MARKET, 2022-2032 ($MILLION)
- FIGURE 41. REST OF ASIA-PACIFIC OLIVE OIL MARKET, 2022-2032 ($MILLION)
- FIGURE 42. BRAZIL OLIVE OIL MARKET, 2022-2032 ($MILLION)
- FIGURE 43. ARGENTINA OLIVE OIL MARKET, 2022-2032 ($MILLION)
- FIGURE 44. REST OF LATIN AMERICA OLIVE OIL MARKET, 2022-2032 ($MILLION)
- FIGURE 45. SOUTH AFRICA OLIVE OIL MARKET, 2022-2032 ($MILLION)
- FIGURE 46. SAUDI ARABIA OLIVE OIL MARKET, 2022-2032 ($MILLION)
- FIGURE 47. REST OF MEA OLIVE OIL MARKET, 2022-2032 ($MILLION)
- FIGURE 48. TOP WINNING STRATEGIES, BY YEAR
- FIGURE 49. TOP WINNING STRATEGIES, BY DEVELOPMENT
- FIGURE 50. TOP WINNING STRATEGIES, BY COMPANY
- FIGURE 51. PRODUCT MAPPING OF TOP 10 PLAYERS
- FIGURE 52. COMPETITIVE DASHBOARD
- FIGURE 53. COMPETITIVE HEATMAP: OLIVE OIL MARKET
- FIGURE 54. TOP PLAYER POSITIONING, 2022
 夾竹桃埃爾卡特全球市場
 全球橄欖油市場:產業分析、規模、佔有率、成長、趨勢和預測(2025-2032)
 全球特級初榨橄欖油市場研究報告 - 產業分析、規模、佔有率、成長、趨勢和預測 2025 年至 2033 年
 橄欖油市場規模、佔有率和成長分析(按類型、應用、包裝、分銷管道和地區)- 2025-2032 年行業預測
 橄欖油市場:按產品類型、按用途、按分銷管道和按地區全球橄欖油市場:預測(2025-2030)2024 年至 2031 年橄欖油市場(按產地、類型、分銷管道、應用和地區劃分)全球橄欖油市場研究報告 - 2024 年至 2032 年產業分析、規模、佔有率、成長、趨勢和預測
 橄欖油全球市場規模、佔有率和趨勢分析報告,按類型、應用、分銷管道、按地區分類的展望和預測,2023-2030 年