


 |
市場調查報告書
商品編碼
1414962
航太複合材料市場:按纖維類型、製造流程和飛機分類:2023-2032 年全球機會分析和產業預測Aerospace Composite Market By Fiber Type, By Manufacturing Process, By Aircraft : Global Opportunity Analysis and Industry Forecast, 2023-2032 |
||||||
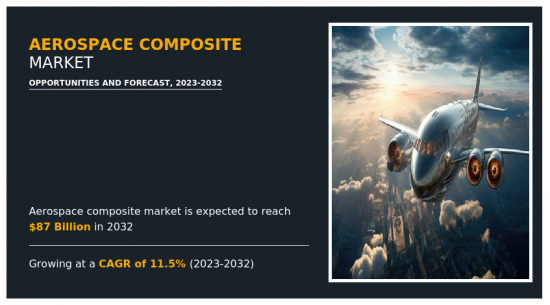
2022年航太複合材料市場規模為296億美元,預估2023年至2032年複合年成長率為11.5%,2032年達870億美元。
航太複合材料的主要優點之一是與鋁等傳統材料相比重量減輕。重量的減輕直接轉化為燃油效率的提高、營運成本的降低以及負載容量的增加。航太複合材料具有出色的強度重量比,並確保堅固的結構完整性。這種強度與耐用性相結合,使材料能夠承受惡劣的環境條件,包括極端溫度和腐蝕性元素。
複合材料為設計人員提供了無與倫比的組件成型彈性,實現了空氣動力學效率和以前不可能實現的創新結構。這種彈性可以輕鬆創建複雜的流線型形狀,從而提高整體性能。航太複合材料本質上具有耐腐蝕性,這是延長飛機和太空船使用壽命的關鍵因素。這種耐腐蝕降低了維護要求並提高了長期可靠性。
自動化積層法製程帶來了前所未有的精度和效率,徹底改變了航太複合材料的製造。傳統上,複合材料是手工積層法的,這是一個集中且耗時的過程,有時會導致不一致。採用自動積層法製程和機器人系統根據預先定義的設計逐層精確地放置複合材料。這種自動化可確保更高的準確性並減少人為錯誤和變異性。此外,由於機器人不間斷地連續工作,生產計畫也大大縮短。
航太複合材料為滿足快速擴張的航空旅行市場的需求提供了引人注目的解決方案。這種採用的主要動力是該材料令人印象深刻的輕質特性和結構強度的結合。隨著航空公司努力最佳化燃油效率,減輕複合材料的重量是關鍵因素。重量減輕直接導致燃料消耗降低,進而降低成本和環境影響。
複合材料具有優異的隔熱性能,減少外界溫度變化對結構部件的影響。這項特性對於在軌道任務期間遇到極端溫差的太空船尤其有價值。航太複合材料表現出卓越的損傷容限,一些材料旨在抵抗和遏制損傷而不損害整體結構的完整性。此特性可防止因局部損壞而導致的災難性故障,並提高安全性。
目錄
第1章簡介
第 2 章執行摘要
第3章市場概況
- 市場定義和範圍
- 主要發現
- 影響因素
- 主要投資機會
- 波特五力分析
- 市場動態
- 促進因素
- 航太領域對輕量材料提高燃油效率的需求
- 奈米技術融入航太領域複合材料的開發
- 抑制因素
- 航太複合材料的初始成本較高
- 機會
- 對下一代飛機的需求不斷成長
- 促進因素
- 價值鏈分析
- 關鍵監管分析
- 專利形勢
- 價格分析
第4章航太複合材料市場:依纖維類型
- 概述
- 碳纖維
- 玻璃纖維
- 醯胺纖維
- 其他
第5章航太複合材料市場:依製造程序分類
- 概述
- ATL 或法新社
- 纏繞成型
- 樹脂轉注成形
- 手工積層
- 其他
第6章航太複合材料市場:透過飛機
- 概述
- 民航機
- 商務及通用航空
- 民用直升機
- 其他
第7章航太複合材料市場:按地區
- 概述
- 北美洲
- 美國
- 加拿大
- 墨西哥
- 歐洲
- 德國
- 法國
- 英國
- 西班牙
- 義大利
- 其他
- 亞太地區
- 中國
- 印度
- 日本
- 韓國
- 澳洲
- 其他
- 拉丁美洲/中東/非洲
- 巴西
- 南非
- 沙烏地阿拉伯
- 其他
第8章 競爭形勢
- 介紹
- 關鍵成功策略
- 10家主要企業產品圖譜
- 競爭對手儀表板
- 競爭熱圖
- 2022年主要企業定位
第9章 公司簡介
- Bally Ribbon Mills
- DuPont
- Hexcel Corporation
- Mitsubishi Electric Corporation
- SGL Carbon
- Solvay
- Spirit AeroSystems, Inc.
- TEIJIN LIMITED.
- TORAY INDUSTRIES, INC.
- VX Aerospace Corporation
According to a new report published by Allied Market Research, titled, "Aerospace Composite Market," The aerospace composite market size was valued at $29.6 billion in 2022, and is estimated to reach $87 billion by 2032, growing at a CAGR of 11.5% from 2023 to 2032.
One of the primary advantages of aerospace composite is the reduction in weight compared to traditional materials like aluminum. This weight reduction directly translates to improved fuel efficiency, lower operational costs, and increased payload capacity. Aerospace composites exhibit exceptional strength-to-weight ratios, ensuring robust structural integrity. This strength is coupled with durability, leading to materials that withstand harsh environmental conditions, including extreme temperatures and corrosive elements.
Composites offer designers unparalleled flexibility in shaping components, allowing for aerodynamic efficiency and innovative structures that were previously unattainable. This flexibility facilitates the creation of complex, streamlined forms that enhance overall performance. Aerospace composites are inherently resistant to corrosion, a critical factor in extending the lifespan of aircraft and spacecraft. This resistance reduces maintenance requirements and enhances long-term reliability.
Automated lay-up processes have revolutionized the manufacturing of aerospace composites by introducing a level of precision and efficiency previously unattainable. Traditionally, composite materials were manually laid up, a labor-intensive and time-consuming process that sometimes resulted in inconsistencies. The automated lay-up processes and robotic systems are employed to precisely position composite materials layer by layer, following predefined designs. This automation ensures a higher degree of accuracy, reducing human errors and variability. In addition, it significantly accelerates the production timeline, as robots work continuously without the need for breaks.
Aerospace composites offer a compelling solution to the demands imposed by the surging air travel market. The primary driver behind this adoption is the material's remarkable combination of lightweight properties and structural strength. As airlines strive to optimize fuel efficiency, the reduced weight of composite materials becomes a pivotal factor. This weight reduction translates directly into lower fuel consumption, resulting in cost savings and a reduced environmental impact.
Composites offer excellent thermal insulation properties, reducing the impact of external temperature variations on the structural components. This feature is particularly valuable in spacecraft, where extreme temperature differentials are encountered during orbital missions. Aerospace composites exhibit remarkable damage tolerance, with some materials designed to resist and contain damage without compromising the overall structure's integrity. This quality enhances safety by preventing catastrophic failures in the event of localized damage.
The aerospace composite market share is segmented into fiber type, manufacturing process, aircraft, and region. On the basis of fiber type, the market is classified into carbon fiber, glass fiber, aramid fiber, and others. On the basis of the manufacturing process, the market is divided into ATL or AFP, filament winding, resin transfer molding, hand layup, and others. On the basis of the aircraft, the market is categorized into commercial aircraft, business and general aviation, civil helicopters, and others. Region-wise, the market is studied across North America, Europe, Asia-Pacific, and LAMEA.
Based on aircraft, commercial aircraft dominated the aerospace composite market. Aerospace composites have found increasing use in the interior components of commercial aircraft. Cabin structures, including walls, ceilings, and flooring, benefit from the lightweight and durable nature of composites. This reduces the overall weight of the aircraft and allows for innovative interior designs, contributing to passenger comfort and satisfaction. The doors and hatches of commercial aircraft are subjected to rigorous operational cycles and must meet stringent safety standards. Aerospace composites provide a suitable solution by offering high strength and durability while minimizing weight. This contributes to the overall safety and efficiency of aircraft operations.
Integration of nanotechnology in composite development in aerospace drives aerospace composite market growth. Nanotechnology integration into composite development is transforming the aerospace industry. Nanocomposites, a fusion of nanotechnology and traditional composites, bring about significant improvements in mechanical properties, durability, and lightweight features for aircraft. These materials showcase superior thermal and electrical conductivity, crucial for effective heat dissipation and integration of advanced electronic systems in aerospace applications. Furthermore, the incorporation of nanotechnology has streamlined manufacturing processes, allowing for scalable production of nanocomposite components.
In addition, the report covers profiles of key industry participants such as Bally Ribbon Mills, DuPont, Hexcel Corporation, Mitsubishi Electric Corporation, SGL Carbon, Solvay, Spirit AeroSystems, Inc., TEIJIN LIMITED., Toray Industries Inc, VX Aerospace Corporation.
Key Benefits For Stakeholders
- This report provides a quantitative analysis of the market segments, current trends, estimations, and dynamics of the aerospace composite market analysis from 2022 to 2032 to identify the prevailing aerospace composite market opportunities.
- The market research is offered along with information related to key drivers, restraints, and opportunities.
- Porter's five forces analysis highlights the potency of buyers and suppliers to enable stakeholders make profit-oriented business decisions and strengthen their supplier-buyer network.
- In-depth analysis of the aerospace composite market forecast assists to determine the prevailing market opportunities.
- Major countries in each region are mapped according to their revenue contribution to the global market.
- Market player positioning facilitates benchmarking and provides a clear understanding of the present position of the market players.
- The report includes the analysis of the regional as well as global aerospace composite market trends, key players, market segments, application areas, and market growth strategies.
Additional benefits you will get with this purchase are:
- Quarterly Update and* (only available with a corporate license, on listed price)
- 5 additional Company Profile of client Choice pre- or Post-purchase, as a free update.
- Free Upcoming Version on the Purchase of Five and Enterprise User License.
- 16 analyst hours of support* (post-purchase, if you find additional data requirements upon review of the report, you may receive support amounting to 16 analyst hours to solve questions, and post-sale queries)
- 15% Free Customization* (in case the scope or segment of the report does not match your requirements, 15% is equivalent to 3 working days of free work, applicable once)
- Free data Pack on the Five and Enterprise User License. (Excel version of the report)
- Free Updated report if the report is 6-12 months old or older.
- 24-hour priority response*
- Free Industry updates and white papers.
Possible Customization with this report (with additional cost and timeline, please talk to the sales executive to know more)
- Investment Opportunities
- Product Life Cycles
- Upcoming/New Entrant by Regions
- Technology Trend Analysis
- Market share analysis of players by products/segments
- New Product Development/ Product Matrix of Key Players
- Patient/epidemiology data at country, region, global level
- Regulatory Guidelines
- Additional company profiles with specific to client's interest
- Additional country or region analysis- market size and forecast
- Average Selling Price Analysis / Price Point Analysis
- Expanded list for Company Profiles
- Historic market data
- Key player details (including location, contact details, supplier/vendor network etc. in excel format)
- SWOT Analysis
- Volume Market Size and Forecast
Key Market Segments
By Fiber Type
- Carbon Fiber
- Glass Fiber
- Aramid Fiber
- Other
By Manufacturing Process
- ATL or AFP
- Filament Winding
- Resin Transfer Molding
- Hand Layup
- Other
By Aircraft
- Commercial Aircraft
- Business and General Avation
- Civil Helicoptor
- Other
By Region
- North America
- U.S.
- Canada
- Mexico
- Europe
- Germany
- France
- UK
- Spain
- Italy
- Rest of Europe
- Asia-Pacific
- China
- India
- Japan
- South Korea
- Australia
- Rest of Asia-Pacific
- LAMEA
- Brazil
- South Africa
- Saudi Arabia
- Rest of LAMEA
Key Market Players:
- DuPont
- VX Aerospace Corporation
- Bally Ribbon Mills
- Hexcel Corporation
- TEIJIN LIMITED.
- Solvay
- Mitsubishi Electric Corporation
- SGL Carbon
- TORAY INDUSTRIES, INC.
- Spirit AeroSystems, Inc.
TABLE OF CONTENTS
CHAPTER 1: INTRODUCTION
- 1.1. Report description
- 1.2. Key market segments
- 1.3. Key benefits to the stakeholders
- 1.4. Research methodology
- 1.4.1. Primary research
- 1.4.2. Secondary research
- 1.4.3. Analyst tools and models
CHAPTER 2: EXECUTIVE SUMMARY
- 2.1. CXO Perspective
CHAPTER 3: MARKET OVERVIEW
- 3.1. Market definition and scope
- 3.2. Key findings
- 3.2.1. Top impacting factors
- 3.2.2. Top investment pockets
- 3.3. Porter's five forces analysis
- 3.3.1. Moderate bargaining power of suppliers
- 3.3.2. High threat of new entrants
- 3.3.3. Moderate threat of substitutes
- 3.3.4. Moderate intensity of rivalry
- 3.3.5. Moderate bargaining power of buyers
- 3.4. Market dynamics
- 3.4.1. Drivers
- 3.4.1.1. Lightweight material demand for fuel efficiency in aerospace
- 3.4.1.2. Integration of nanotechnology in composite development in aerospace
- 3.4.2. Restraints
- 3.4.2.1. High initial costs of composite materials in aerospace
- 3.4.3. Opportunities
- 3.4.3.1. Rise in demand for next-generation aircraft
- 3.4.1. Drivers
- 3.5. Value Chain Analysis
- 3.6. Key Regulation Analysis
- 3.7. Patent Landscape
- 3.8. Pricing Analysis
CHAPTER 4: AEROSPACE COMPOSITE MARKET, BY FIBER TYPE
- 4.1. Overview
- 4.1.1. Market size and forecast
- 4.2. Carbon Fiber
- 4.2.1. Key market trends, growth factors and opportunities
- 4.2.2. Market size and forecast, by region
- 4.2.3. Market share analysis by country
- 4.3. Glass Fiber
- 4.3.1. Key market trends, growth factors and opportunities
- 4.3.2. Market size and forecast, by region
- 4.3.3. Market share analysis by country
- 4.4. Aramid Fiber
- 4.4.1. Key market trends, growth factors and opportunities
- 4.4.2. Market size and forecast, by region
- 4.4.3. Market share analysis by country
- 4.5. Other
- 4.5.1. Key market trends, growth factors and opportunities
- 4.5.2. Market size and forecast, by region
- 4.5.3. Market share analysis by country
CHAPTER 5: AEROSPACE COMPOSITE MARKET, BY MANUFACTURING PROCESS
- 5.1. Overview
- 5.1.1. Market size and forecast
- 5.2. ATL or AFP
- 5.2.1. Key market trends, growth factors and opportunities
- 5.2.2. Market size and forecast, by region
- 5.2.3. Market share analysis by country
- 5.3. Filament Winding
- 5.3.1. Key market trends, growth factors and opportunities
- 5.3.2. Market size and forecast, by region
- 5.3.3. Market share analysis by country
- 5.4. Resin Transfer Molding
- 5.4.1. Key market trends, growth factors and opportunities
- 5.4.2. Market size and forecast, by region
- 5.4.3. Market share analysis by country
- 5.5. Hand Layup
- 5.5.1. Key market trends, growth factors and opportunities
- 5.5.2. Market size and forecast, by region
- 5.5.3. Market share analysis by country
- 5.6. Other
- 5.6.1. Key market trends, growth factors and opportunities
- 5.6.2. Market size and forecast, by region
- 5.6.3. Market share analysis by country
CHAPTER 6: AEROSPACE COMPOSITE MARKET, BY AIRCRAFT
- 6.1. Overview
- 6.1.1. Market size and forecast
- 6.2. Commercial Aircraft
- 6.2.1. Key market trends, growth factors and opportunities
- 6.2.2. Market size and forecast, by region
- 6.2.3. Market share analysis by country
- 6.3. Business and General Avation
- 6.3.1. Key market trends, growth factors and opportunities
- 6.3.2. Market size and forecast, by region
- 6.3.3. Market share analysis by country
- 6.4. Civil Helicoptor
- 6.4.1. Key market trends, growth factors and opportunities
- 6.4.2. Market size and forecast, by region
- 6.4.3. Market share analysis by country
- 6.5. Other
- 6.5.1. Key market trends, growth factors and opportunities
- 6.5.2. Market size and forecast, by region
- 6.5.3. Market share analysis by country
CHAPTER 7: AEROSPACE COMPOSITE MARKET, BY REGION
- 7.1. Overview
- 7.1.1. Market size and forecast By Region
- 7.2. North America
- 7.2.1. Key market trends, growth factors and opportunities
- 7.2.2. Market size and forecast, by Fiber Type
- 7.2.3. Market size and forecast, by Manufacturing Process
- 7.2.4. Market size and forecast, by Aircraft
- 7.2.5. Market size and forecast, by country
- 7.2.5.1. U.S.
- 7.2.5.1.1. Market size and forecast, by Fiber Type
- 7.2.5.1.2. Market size and forecast, by Manufacturing Process
- 7.2.5.1.3. Market size and forecast, by Aircraft
- 7.2.5.2. Canada
- 7.2.5.2.1. Market size and forecast, by Fiber Type
- 7.2.5.2.2. Market size and forecast, by Manufacturing Process
- 7.2.5.2.3. Market size and forecast, by Aircraft
- 7.2.5.3. Mexico
- 7.2.5.3.1. Market size and forecast, by Fiber Type
- 7.2.5.3.2. Market size and forecast, by Manufacturing Process
- 7.2.5.3.3. Market size and forecast, by Aircraft
- 7.3. Europe
- 7.3.1. Key market trends, growth factors and opportunities
- 7.3.2. Market size and forecast, by Fiber Type
- 7.3.3. Market size and forecast, by Manufacturing Process
- 7.3.4. Market size and forecast, by Aircraft
- 7.3.5. Market size and forecast, by country
- 7.3.5.1. Germany
- 7.3.5.1.1. Market size and forecast, by Fiber Type
- 7.3.5.1.2. Market size and forecast, by Manufacturing Process
- 7.3.5.1.3. Market size and forecast, by Aircraft
- 7.3.5.2. France
- 7.3.5.2.1. Market size and forecast, by Fiber Type
- 7.3.5.2.2. Market size and forecast, by Manufacturing Process
- 7.3.5.2.3. Market size and forecast, by Aircraft
- 7.3.5.3. UK
- 7.3.5.3.1. Market size and forecast, by Fiber Type
- 7.3.5.3.2. Market size and forecast, by Manufacturing Process
- 7.3.5.3.3. Market size and forecast, by Aircraft
- 7.3.5.4. Spain
- 7.3.5.4.1. Market size and forecast, by Fiber Type
- 7.3.5.4.2. Market size and forecast, by Manufacturing Process
- 7.3.5.4.3. Market size and forecast, by Aircraft
- 7.3.5.5. Italy
- 7.3.5.5.1. Market size and forecast, by Fiber Type
- 7.3.5.5.2. Market size and forecast, by Manufacturing Process
- 7.3.5.5.3. Market size and forecast, by Aircraft
- 7.3.5.6. Rest of Europe
- 7.3.5.6.1. Market size and forecast, by Fiber Type
- 7.3.5.6.2. Market size and forecast, by Manufacturing Process
- 7.3.5.6.3. Market size and forecast, by Aircraft
- 7.4. Asia-Pacific
- 7.4.1. Key market trends, growth factors and opportunities
- 7.4.2. Market size and forecast, by Fiber Type
- 7.4.3. Market size and forecast, by Manufacturing Process
- 7.4.4. Market size and forecast, by Aircraft
- 7.4.5. Market size and forecast, by country
- 7.4.5.1. China
- 7.4.5.1.1. Market size and forecast, by Fiber Type
- 7.4.5.1.2. Market size and forecast, by Manufacturing Process
- 7.4.5.1.3. Market size and forecast, by Aircraft
- 7.4.5.2. India
- 7.4.5.2.1. Market size and forecast, by Fiber Type
- 7.4.5.2.2. Market size and forecast, by Manufacturing Process
- 7.4.5.2.3. Market size and forecast, by Aircraft
- 7.4.5.3. Japan
- 7.4.5.3.1. Market size and forecast, by Fiber Type
- 7.4.5.3.2. Market size and forecast, by Manufacturing Process
- 7.4.5.3.3. Market size and forecast, by Aircraft
- 7.4.5.4. South Korea
- 7.4.5.4.1. Market size and forecast, by Fiber Type
- 7.4.5.4.2. Market size and forecast, by Manufacturing Process
- 7.4.5.4.3. Market size and forecast, by Aircraft
- 7.4.5.5. Australia
- 7.4.5.5.1. Market size and forecast, by Fiber Type
- 7.4.5.5.2. Market size and forecast, by Manufacturing Process
- 7.4.5.5.3. Market size and forecast, by Aircraft
- 7.4.5.6. Rest of Asia-Pacific
- 7.4.5.6.1. Market size and forecast, by Fiber Type
- 7.4.5.6.2. Market size and forecast, by Manufacturing Process
- 7.4.5.6.3. Market size and forecast, by Aircraft
- 7.5. LAMEA
- 7.5.1. Key market trends, growth factors and opportunities
- 7.5.2. Market size and forecast, by Fiber Type
- 7.5.3. Market size and forecast, by Manufacturing Process
- 7.5.4. Market size and forecast, by Aircraft
- 7.5.5. Market size and forecast, by country
- 7.5.5.1. Brazil
- 7.5.5.1.1. Market size and forecast, by Fiber Type
- 7.5.5.1.2. Market size and forecast, by Manufacturing Process
- 7.5.5.1.3. Market size and forecast, by Aircraft
- 7.5.5.2. South Africa
- 7.5.5.2.1. Market size and forecast, by Fiber Type
- 7.5.5.2.2. Market size and forecast, by Manufacturing Process
- 7.5.5.2.3. Market size and forecast, by Aircraft
- 7.5.5.3. Saudi Arabia
- 7.5.5.3.1. Market size and forecast, by Fiber Type
- 7.5.5.3.2. Market size and forecast, by Manufacturing Process
- 7.5.5.3.3. Market size and forecast, by Aircraft
- 7.5.5.4. Rest of LAMEA
- 7.5.5.4.1. Market size and forecast, by Fiber Type
- 7.5.5.4.2. Market size and forecast, by Manufacturing Process
- 7.5.5.4.3. Market size and forecast, by Aircraft
CHAPTER 8: COMPETITIVE LANDSCAPE
- 8.1. Introduction
- 8.2. Top winning strategies
- 8.3. Product mapping of top 10 player
- 8.4. Competitive dashboard
- 8.5. Competitive heatmap
- 8.6. Top player positioning, 2022
CHAPTER 9: COMPANY PROFILES
- 9.1. Bally Ribbon Mills
- 9.1.1. Company overview
- 9.1.2. Key executives
- 9.1.3. Company snapshot
- 9.1.4. Operating business segments
- 9.1.5. Product portfolio
- 9.2. DuPont
- 9.2.1. Company overview
- 9.2.2. Key executives
- 9.2.3. Company snapshot
- 9.2.4. Operating business segments
- 9.2.5. Product portfolio
- 9.2.6. Business performance
- 9.3. Hexcel Corporation
- 9.3.1. Company overview
- 9.3.2. Key executives
- 9.3.3. Company snapshot
- 9.3.4. Operating business segments
- 9.3.5. Product portfolio
- 9.3.6. Business performance
- 9.3.7. Key strategic moves and developments
- 9.4. Mitsubishi Electric Corporation
- 9.4.1. Company overview
- 9.4.2. Key executives
- 9.4.3. Company snapshot
- 9.4.4. Operating business segments
- 9.4.5. Product portfolio
- 9.4.6. Business performance
- 9.5. SGL Carbon
- 9.5.1. Company overview
- 9.5.2. Key executives
- 9.5.3. Company snapshot
- 9.5.4. Operating business segments
- 9.5.5. Product portfolio
- 9.5.6. Business performance
- 9.6. Solvay
- 9.6.1. Company overview
- 9.6.2. Key executives
- 9.6.3. Company snapshot
- 9.6.4. Operating business segments
- 9.6.5. Product portfolio
- 9.6.6. Business performance
- 9.6.7. Key strategic moves and developments
- 9.7. Spirit AeroSystems, Inc.
- 9.7.1. Company overview
- 9.7.2. Key executives
- 9.7.3. Company snapshot
- 9.7.4. Operating business segments
- 9.7.5. Product portfolio
- 9.7.6. Business performance
- 9.8. TEIJIN LIMITED.
- 9.8.1. Company overview
- 9.8.2. Key executives
- 9.8.3. Company snapshot
- 9.8.4. Operating business segments
- 9.8.5. Product portfolio
- 9.8.6. Business performance
- 9.9. TORAY INDUSTRIES, INC.
- 9.9.1. Company overview
- 9.9.2. Key executives
- 9.9.3. Company snapshot
- 9.9.4. Operating business segments
- 9.9.5. Product portfolio
- 9.9.6. Business performance
- 9.10. VX Aerospace Corporation
- 9.10.1. Company overview
- 9.10.2. Key executives
- 9.10.3. Company snapshot
- 9.10.4. Operating business segments
- 9.10.5. Product portfolio
LIST OF TABLES
- TABLE 01. GLOBAL AEROSPACE COMPOSITE MARKET, BY FIBER TYPE, 2022-2032 ($MILLION)
- TABLE 02. GLOBAL AEROSPACE COMPOSITE MARKET, BY FIBER TYPE, 2022-2032 (KILOTON)
- TABLE 03. AEROSPACE COMPOSITE MARKET FOR CARBON FIBER, BY REGION, 2022-2032 ($MILLION)
- TABLE 04. AEROSPACE COMPOSITE MARKET FOR CARBON FIBER, BY REGION, 2022-2032 (KILOTON)
- TABLE 05. AEROSPACE COMPOSITE MARKET FOR GLASS FIBER, BY REGION, 2022-2032 ($MILLION)
- TABLE 06. AEROSPACE COMPOSITE MARKET FOR GLASS FIBER, BY REGION, 2022-2032 (KILOTON)
- TABLE 07. AEROSPACE COMPOSITE MARKET FOR ARAMID FIBER, BY REGION, 2022-2032 ($MILLION)
- TABLE 08. AEROSPACE COMPOSITE MARKET FOR ARAMID FIBER, BY REGION, 2022-2032 (KILOTON)
- TABLE 09. AEROSPACE COMPOSITE MARKET FOR OTHER, BY REGION, 2022-2032 ($MILLION)
- TABLE 10. AEROSPACE COMPOSITE MARKET FOR OTHER, BY REGION, 2022-2032 (KILOTON)
- TABLE 11. GLOBAL AEROSPACE COMPOSITE MARKET, BY MANUFACTURING PROCESS, 2022-2032 ($MILLION)
- TABLE 12. GLOBAL AEROSPACE COMPOSITE MARKET, BY MANUFACTURING PROCESS, 2022-2032 (KILOTON)
- TABLE 13. AEROSPACE COMPOSITE MARKET FOR ATL OR AFP, BY REGION, 2022-2032 ($MILLION)
- TABLE 14. AEROSPACE COMPOSITE MARKET FOR ATL OR AFP, BY REGION, 2022-2032 (KILOTON)
- TABLE 15. AEROSPACE COMPOSITE MARKET FOR FILAMENT WINDING, BY REGION, 2022-2032 ($MILLION)
- TABLE 16. AEROSPACE COMPOSITE MARKET FOR FILAMENT WINDING, BY REGION, 2022-2032 (KILOTON)
- TABLE 17. AEROSPACE COMPOSITE MARKET FOR RESIN TRANSFER MOLDING, BY REGION, 2022-2032 ($MILLION)
- TABLE 18. AEROSPACE COMPOSITE MARKET FOR RESIN TRANSFER MOLDING, BY REGION, 2022-2032 (KILOTON)
- TABLE 19. AEROSPACE COMPOSITE MARKET FOR HAND LAYUP, BY REGION, 2022-2032 ($MILLION)
- TABLE 20. AEROSPACE COMPOSITE MARKET FOR HAND LAYUP, BY REGION, 2022-2032 (KILOTON)
- TABLE 21. AEROSPACE COMPOSITE MARKET FOR OTHER, BY REGION, 2022-2032 ($MILLION)
- TABLE 22. AEROSPACE COMPOSITE MARKET FOR OTHER, BY REGION, 2022-2032 (KILOTON)
- TABLE 23. GLOBAL AEROSPACE COMPOSITE MARKET, BY AIRCRAFT, 2022-2032 ($MILLION)
- TABLE 24. GLOBAL AEROSPACE COMPOSITE MARKET, BY AIRCRAFT, 2022-2032 (KILOTON)
- TABLE 25. AEROSPACE COMPOSITE MARKET FOR COMMERCIAL AIRCRAFT, BY REGION, 2022-2032 ($MILLION)
- TABLE 26. AEROSPACE COMPOSITE MARKET FOR COMMERCIAL AIRCRAFT, BY REGION, 2022-2032 (KILOTON)
- TABLE 27. AEROSPACE COMPOSITE MARKET FOR BUSINESS AND GENERAL AVATION, BY REGION, 2022-2032 ($MILLION)
- TABLE 28. AEROSPACE COMPOSITE MARKET FOR BUSINESS AND GENERAL AVATION, BY REGION, 2022-2032 (KILOTON)
- TABLE 29. AEROSPACE COMPOSITE MARKET FOR CIVIL HELICOPTOR, BY REGION, 2022-2032 ($MILLION)
- TABLE 30. AEROSPACE COMPOSITE MARKET FOR CIVIL HELICOPTOR, BY REGION, 2022-2032 (KILOTON)
- TABLE 31. AEROSPACE COMPOSITE MARKET FOR OTHER, BY REGION, 2022-2032 ($MILLION)
- TABLE 32. AEROSPACE COMPOSITE MARKET FOR OTHER, BY REGION, 2022-2032 (KILOTON)
- TABLE 33. AEROSPACE COMPOSITE MARKET, BY REGION, 2022-2032 ($MILLION)
- TABLE 34. AEROSPACE COMPOSITE MARKET, BY REGION, 2022-2032 (KILOTON)
- TABLE 35. NORTH AMERICA AEROSPACE COMPOSITE MARKET, BY FIBER TYPE, 2022-2032 ($MILLION)
- TABLE 36. NORTH AMERICA AEROSPACE COMPOSITE MARKET, BY FIBER TYPE, 2022-2032 (KILOTON)
- TABLE 37. NORTH AMERICA AEROSPACE COMPOSITE MARKET, BY MANUFACTURING PROCESS, 2022-2032 ($MILLION)
- TABLE 38. NORTH AMERICA AEROSPACE COMPOSITE MARKET, BY MANUFACTURING PROCESS, 2022-2032 (KILOTON)
- TABLE 39. NORTH AMERICA AEROSPACE COMPOSITE MARKET, BY AIRCRAFT, 2022-2032 ($MILLION)
- TABLE 40. NORTH AMERICA AEROSPACE COMPOSITE MARKET, BY AIRCRAFT, 2022-2032 (KILOTON)
- TABLE 41. NORTH AMERICA AEROSPACE COMPOSITE MARKET, BY COUNTRY, 2022-2032 ($MILLION)
- TABLE 42. NORTH AMERICA AEROSPACE COMPOSITE MARKET, BY COUNTRY, 2022-2032 (KILOTON)
- TABLE 43. U.S. AEROSPACE COMPOSITE MARKET, BY FIBER TYPE, 2022-2032 ($MILLION)
- TABLE 44. U.S. AEROSPACE COMPOSITE MARKET, BY FIBER TYPE, 2022-2032 (KILOTON)
- TABLE 45. U.S. AEROSPACE COMPOSITE MARKET, BY MANUFACTURING PROCESS, 2022-2032 ($MILLION)
- TABLE 46. U.S. AEROSPACE COMPOSITE MARKET, BY MANUFACTURING PROCESS, 2022-2032 (KILOTON)
- TABLE 47. U.S. AEROSPACE COMPOSITE MARKET, BY AIRCRAFT, 2022-2032 ($MILLION)
- TABLE 48. U.S. AEROSPACE COMPOSITE MARKET, BY AIRCRAFT, 2022-2032 (KILOTON)
- TABLE 49. CANADA AEROSPACE COMPOSITE MARKET, BY FIBER TYPE, 2022-2032 ($MILLION)
- TABLE 50. CANADA AEROSPACE COMPOSITE MARKET, BY FIBER TYPE, 2022-2032 (KILOTON)
- TABLE 51. CANADA AEROSPACE COMPOSITE MARKET, BY MANUFACTURING PROCESS, 2022-2032 ($MILLION)
- TABLE 52. CANADA AEROSPACE COMPOSITE MARKET, BY MANUFACTURING PROCESS, 2022-2032 (KILOTON)
- TABLE 53. CANADA AEROSPACE COMPOSITE MARKET, BY AIRCRAFT, 2022-2032 ($MILLION)
- TABLE 54. CANADA AEROSPACE COMPOSITE MARKET, BY AIRCRAFT, 2022-2032 (KILOTON)
- TABLE 55. MEXICO AEROSPACE COMPOSITE MARKET, BY FIBER TYPE, 2022-2032 ($MILLION)
- TABLE 56. MEXICO AEROSPACE COMPOSITE MARKET, BY FIBER TYPE, 2022-2032 (KILOTON)
- TABLE 57. MEXICO AEROSPACE COMPOSITE MARKET, BY MANUFACTURING PROCESS, 2022-2032 ($MILLION)
- TABLE 58. MEXICO AEROSPACE COMPOSITE MARKET, BY MANUFACTURING PROCESS, 2022-2032 (KILOTON)
- TABLE 59. MEXICO AEROSPACE COMPOSITE MARKET, BY AIRCRAFT, 2022-2032 ($MILLION)
- TABLE 60. MEXICO AEROSPACE COMPOSITE MARKET, BY AIRCRAFT, 2022-2032 (KILOTON)
- TABLE 61. EUROPE AEROSPACE COMPOSITE MARKET, BY FIBER TYPE, 2022-2032 ($MILLION)
- TABLE 62. EUROPE AEROSPACE COMPOSITE MARKET, BY FIBER TYPE, 2022-2032 (KILOTON)
- TABLE 63. EUROPE AEROSPACE COMPOSITE MARKET, BY MANUFACTURING PROCESS, 2022-2032 ($MILLION)
- TABLE 64. EUROPE AEROSPACE COMPOSITE MARKET, BY MANUFACTURING PROCESS, 2022-2032 (KILOTON)
- TABLE 65. EUROPE AEROSPACE COMPOSITE MARKET, BY AIRCRAFT, 2022-2032 ($MILLION)
- TABLE 66. EUROPE AEROSPACE COMPOSITE MARKET, BY AIRCRAFT, 2022-2032 (KILOTON)
- TABLE 67. EUROPE AEROSPACE COMPOSITE MARKET, BY COUNTRY, 2022-2032 ($MILLION)
- TABLE 68. EUROPE AEROSPACE COMPOSITE MARKET, BY COUNTRY, 2022-2032 (KILOTON)
- TABLE 69. GERMANY AEROSPACE COMPOSITE MARKET, BY FIBER TYPE, 2022-2032 ($MILLION)
- TABLE 70. GERMANY AEROSPACE COMPOSITE MARKET, BY FIBER TYPE, 2022-2032 (KILOTON)
- TABLE 71. GERMANY AEROSPACE COMPOSITE MARKET, BY MANUFACTURING PROCESS, 2022-2032 ($MILLION)
- TABLE 72. GERMANY AEROSPACE COMPOSITE MARKET, BY MANUFACTURING PROCESS, 2022-2032 (KILOTON)
- TABLE 73. GERMANY AEROSPACE COMPOSITE MARKET, BY AIRCRAFT, 2022-2032 ($MILLION)
- TABLE 74. GERMANY AEROSPACE COMPOSITE MARKET, BY AIRCRAFT, 2022-2032 (KILOTON)
- TABLE 75. FRANCE AEROSPACE COMPOSITE MARKET, BY FIBER TYPE, 2022-2032 ($MILLION)
- TABLE 76. FRANCE AEROSPACE COMPOSITE MARKET, BY FIBER TYPE, 2022-2032 (KILOTON)
- TABLE 77. FRANCE AEROSPACE COMPOSITE MARKET, BY MANUFACTURING PROCESS, 2022-2032 ($MILLION)
- TABLE 78. FRANCE AEROSPACE COMPOSITE MARKET, BY MANUFACTURING PROCESS, 2022-2032 (KILOTON)
- TABLE 79. FRANCE AEROSPACE COMPOSITE MARKET, BY AIRCRAFT, 2022-2032 ($MILLION)
- TABLE 80. FRANCE AEROSPACE COMPOSITE MARKET, BY AIRCRAFT, 2022-2032 (KILOTON)
- TABLE 81. UK AEROSPACE COMPOSITE MARKET, BY FIBER TYPE, 2022-2032 ($MILLION)
- TABLE 82. UK AEROSPACE COMPOSITE MARKET, BY FIBER TYPE, 2022-2032 (KILOTON)
- TABLE 83. UK AEROSPACE COMPOSITE MARKET, BY MANUFACTURING PROCESS, 2022-2032 ($MILLION)
- TABLE 84. UK AEROSPACE COMPOSITE MARKET, BY MANUFACTURING PROCESS, 2022-2032 (KILOTON)
- TABLE 85. UK AEROSPACE COMPOSITE MARKET, BY AIRCRAFT, 2022-2032 ($MILLION)
- TABLE 86. UK AEROSPACE COMPOSITE MARKET, BY AIRCRAFT, 2022-2032 (KILOTON)
- TABLE 87. SPAIN AEROSPACE COMPOSITE MARKET, BY FIBER TYPE, 2022-2032 ($MILLION)
- TABLE 88. SPAIN AEROSPACE COMPOSITE MARKET, BY FIBER TYPE, 2022-2032 (KILOTON)
- TABLE 89. SPAIN AEROSPACE COMPOSITE MARKET, BY MANUFACTURING PROCESS, 2022-2032 ($MILLION)
- TABLE 90. SPAIN AEROSPACE COMPOSITE MARKET, BY MANUFACTURING PROCESS, 2022-2032 (KILOTON)
- TABLE 91. SPAIN AEROSPACE COMPOSITE MARKET, BY AIRCRAFT, 2022-2032 ($MILLION)
- TABLE 92. SPAIN AEROSPACE COMPOSITE MARKET, BY AIRCRAFT, 2022-2032 (KILOTON)
- TABLE 93. ITALY AEROSPACE COMPOSITE MARKET, BY FIBER TYPE, 2022-2032 ($MILLION)
- TABLE 94. ITALY AEROSPACE COMPOSITE MARKET, BY FIBER TYPE, 2022-2032 (KILOTON)
- TABLE 95. ITALY AEROSPACE COMPOSITE MARKET, BY MANUFACTURING PROCESS, 2022-2032 ($MILLION)
- TABLE 96. ITALY AEROSPACE COMPOSITE MARKET, BY MANUFACTURING PROCESS, 2022-2032 (KILOTON)
- TABLE 97. ITALY AEROSPACE COMPOSITE MARKET, BY AIRCRAFT, 2022-2032 ($MILLION)
- TABLE 98. ITALY AEROSPACE COMPOSITE MARKET, BY AIRCRAFT, 2022-2032 (KILOTON)
- TABLE 99. REST OF EUROPE AEROSPACE COMPOSITE MARKET, BY FIBER TYPE, 2022-2032 ($MILLION)
- TABLE 100. REST OF EUROPE AEROSPACE COMPOSITE MARKET, BY FIBER TYPE, 2022-2032 (KILOTON)
- TABLE 101. REST OF EUROPE AEROSPACE COMPOSITE MARKET, BY MANUFACTURING PROCESS, 2022-2032 ($MILLION)
- TABLE 102. REST OF EUROPE AEROSPACE COMPOSITE MARKET, BY MANUFACTURING PROCESS, 2022-2032 (KILOTON)
- TABLE 103. REST OF EUROPE AEROSPACE COMPOSITE MARKET, BY AIRCRAFT, 2022-2032 ($MILLION)
- TABLE 104. REST OF EUROPE AEROSPACE COMPOSITE MARKET, BY AIRCRAFT, 2022-2032 (KILOTON)
- TABLE 105. ASIA-PACIFIC AEROSPACE COMPOSITE MARKET, BY FIBER TYPE, 2022-2032 ($MILLION)
- TABLE 106. ASIA-PACIFIC AEROSPACE COMPOSITE MARKET, BY FIBER TYPE, 2022-2032 (KILOTON)
- TABLE 107. ASIA-PACIFIC AEROSPACE COMPOSITE MARKET, BY MANUFACTURING PROCESS, 2022-2032 ($MILLION)
- TABLE 108. ASIA-PACIFIC AEROSPACE COMPOSITE MARKET, BY MANUFACTURING PROCESS, 2022-2032 (KILOTON)
- TABLE 109. ASIA-PACIFIC AEROSPACE COMPOSITE MARKET, BY AIRCRAFT, 2022-2032 ($MILLION)
- TABLE 110. ASIA-PACIFIC AEROSPACE COMPOSITE MARKET, BY AIRCRAFT, 2022-2032 (KILOTON)
- TABLE 111. ASIA-PACIFIC AEROSPACE COMPOSITE MARKET, BY COUNTRY, 2022-2032 ($MILLION)
- TABLE 112. ASIA-PACIFIC AEROSPACE COMPOSITE MARKET, BY COUNTRY, 2022-2032 (KILOTON)
- TABLE 113. CHINA AEROSPACE COMPOSITE MARKET, BY FIBER TYPE, 2022-2032 ($MILLION)
- TABLE 114. CHINA AEROSPACE COMPOSITE MARKET, BY FIBER TYPE, 2022-2032 (KILOTON)
- TABLE 115. CHINA AEROSPACE COMPOSITE MARKET, BY MANUFACTURING PROCESS, 2022-2032 ($MILLION)
- TABLE 116. CHINA AEROSPACE COMPOSITE MARKET, BY MANUFACTURING PROCESS, 2022-2032 (KILOTON)
- TABLE 117. CHINA AEROSPACE COMPOSITE MARKET, BY AIRCRAFT, 2022-2032 ($MILLION)
- TABLE 118. CHINA AEROSPACE COMPOSITE MARKET, BY AIRCRAFT, 2022-2032 (KILOTON)
- TABLE 119. INDIA AEROSPACE COMPOSITE MARKET, BY FIBER TYPE, 2022-2032 ($MILLION)
- TABLE 120. INDIA AEROSPACE COMPOSITE MARKET, BY FIBER TYPE, 2022-2032 (KILOTON)
- TABLE 121. INDIA AEROSPACE COMPOSITE MARKET, BY MANUFACTURING PROCESS, 2022-2032 ($MILLION)
- TABLE 122. INDIA AEROSPACE COMPOSITE MARKET, BY MANUFACTURING PROCESS, 2022-2032 (KILOTON)
- TABLE 123. INDIA AEROSPACE COMPOSITE MARKET, BY AIRCRAFT, 2022-2032 ($MILLION)
- TABLE 124. INDIA AEROSPACE COMPOSITE MARKET, BY AIRCRAFT, 2022-2032 (KILOTON)
- TABLE 125. JAPAN AEROSPACE COMPOSITE MARKET, BY FIBER TYPE, 2022-2032 ($MILLION)
- TABLE 126. JAPAN AEROSPACE COMPOSITE MARKET, BY FIBER TYPE, 2022-2032 (KILOTON)
- TABLE 127. JAPAN AEROSPACE COMPOSITE MARKET, BY MANUFACTURING PROCESS, 2022-2032 ($MILLION)
- TABLE 128. JAPAN AEROSPACE COMPOSITE MARKET, BY MANUFACTURING PROCESS, 2022-2032 (KILOTON)
- TABLE 129. JAPAN AEROSPACE COMPOSITE MARKET, BY AIRCRAFT, 2022-2032 ($MILLION)
- TABLE 130. JAPAN AEROSPACE COMPOSITE MARKET, BY AIRCRAFT, 2022-2032 (KILOTON)
- TABLE 131. SOUTH KOREA AEROSPACE COMPOSITE MARKET, BY FIBER TYPE, 2022-2032 ($MILLION)
- TABLE 132. SOUTH KOREA AEROSPACE COMPOSITE MARKET, BY FIBER TYPE, 2022-2032 (KILOTON)
- TABLE 133. SOUTH KOREA AEROSPACE COMPOSITE MARKET, BY MANUFACTURING PROCESS, 2022-2032 ($MILLION)
- TABLE 134. SOUTH KOREA AEROSPACE COMPOSITE MARKET, BY MANUFACTURING PROCESS, 2022-2032 (KILOTON)
- TABLE 135. SOUTH KOREA AEROSPACE COMPOSITE MARKET, BY AIRCRAFT, 2022-2032 ($MILLION)
- TABLE 136. SOUTH KOREA AEROSPACE COMPOSITE MARKET, BY AIRCRAFT, 2022-2032 (KILOTON)
- TABLE 137. AUSTRALIA AEROSPACE COMPOSITE MARKET, BY FIBER TYPE, 2022-2032 ($MILLION)
- TABLE 138. AUSTRALIA AEROSPACE COMPOSITE MARKET, BY FIBER TYPE, 2022-2032 (KILOTON)
- TABLE 139. AUSTRALIA AEROSPACE COMPOSITE MARKET, BY MANUFACTURING PROCESS, 2022-2032 ($MILLION)
- TABLE 140. AUSTRALIA AEROSPACE COMPOSITE MARKET, BY MANUFACTURING PROCESS, 2022-2032 (KILOTON)
- TABLE 141. AUSTRALIA AEROSPACE COMPOSITE MARKET, BY AIRCRAFT, 2022-2032 ($MILLION)
- TABLE 142. AUSTRALIA AEROSPACE COMPOSITE MARKET, BY AIRCRAFT, 2022-2032 (KILOTON)
- TABLE 143. REST OF ASIA-PACIFIC AEROSPACE COMPOSITE MARKET, BY FIBER TYPE, 2022-2032 ($MILLION)
- TABLE 144. REST OF ASIA-PACIFIC AEROSPACE COMPOSITE MARKET, BY FIBER TYPE, 2022-2032 (KILOTON)
- TABLE 145. REST OF ASIA-PACIFIC AEROSPACE COMPOSITE MARKET, BY MANUFACTURING PROCESS, 2022-2032 ($MILLION)
- TABLE 146. REST OF ASIA-PACIFIC AEROSPACE COMPOSITE MARKET, BY MANUFACTURING PROCESS, 2022-2032 (KILOTON)
- TABLE 147. REST OF ASIA-PACIFIC AEROSPACE COMPOSITE MARKET, BY AIRCRAFT, 2022-2032 ($MILLION)
- TABLE 148. REST OF ASIA-PACIFIC AEROSPACE COMPOSITE MARKET, BY AIRCRAFT, 2022-2032 (KILOTON)
- TABLE 149. LAMEA AEROSPACE COMPOSITE MARKET, BY FIBER TYPE, 2022-2032 ($MILLION)
- TABLE 150. LAMEA AEROSPACE COMPOSITE MARKET, BY FIBER TYPE, 2022-2032 (KILOTON)
- TABLE 151. LAMEA AEROSPACE COMPOSITE MARKET, BY MANUFACTURING PROCESS, 2022-2032 ($MILLION)
- TABLE 152. LAMEA AEROSPACE COMPOSITE MARKET, BY MANUFACTURING PROCESS, 2022-2032 (KILOTON)
- TABLE 153. LAMEA AEROSPACE COMPOSITE MARKET, BY AIRCRAFT, 2022-2032 ($MILLION)
- TABLE 154. LAMEA AEROSPACE COMPOSITE MARKET, BY AIRCRAFT, 2022-2032 (KILOTON)
- TABLE 155. LAMEA AEROSPACE COMPOSITE MARKET, BY COUNTRY, 2022-2032 ($MILLION)
- TABLE 156. LAMEA AEROSPACE COMPOSITE MARKET, BY COUNTRY, 2022-2032 (KILOTON)
- TABLE 157. BRAZIL AEROSPACE COMPOSITE MARKET, BY FIBER TYPE, 2022-2032 ($MILLION)
- TABLE 158. BRAZIL AEROSPACE COMPOSITE MARKET, BY FIBER TYPE, 2022-2032 (KILOTON)
- TABLE 159. BRAZIL AEROSPACE COMPOSITE MARKET, BY MANUFACTURING PROCESS, 2022-2032 ($MILLION)
- TABLE 160. BRAZIL AEROSPACE COMPOSITE MARKET, BY MANUFACTURING PROCESS, 2022-2032 (KILOTON)
- TABLE 161. BRAZIL AEROSPACE COMPOSITE MARKET, BY AIRCRAFT, 2022-2032 ($MILLION)
- TABLE 162. BRAZIL AEROSPACE COMPOSITE MARKET, BY AIRCRAFT, 2022-2032 (KILOTON)
- TABLE 163. SOUTH AFRICA AEROSPACE COMPOSITE MARKET, BY FIBER TYPE, 2022-2032 ($MILLION)
- TABLE 164. SOUTH AFRICA AEROSPACE COMPOSITE MARKET, BY FIBER TYPE, 2022-2032 (KILOTON)
- TABLE 165. SOUTH AFRICA AEROSPACE COMPOSITE MARKET, BY MANUFACTURING PROCESS, 2022-2032 ($MILLION)
- TABLE 166. SOUTH AFRICA AEROSPACE COMPOSITE MARKET, BY MANUFACTURING PROCESS, 2022-2032 (KILOTON)
- TABLE 167. SOUTH AFRICA AEROSPACE COMPOSITE MARKET, BY AIRCRAFT, 2022-2032 ($MILLION)
- TABLE 168. SOUTH AFRICA AEROSPACE COMPOSITE MARKET, BY AIRCRAFT, 2022-2032 (KILOTON)
- TABLE 169. SAUDI ARABIA AEROSPACE COMPOSITE MARKET, BY FIBER TYPE, 2022-2032 ($MILLION)
- TABLE 170. SAUDI ARABIA AEROSPACE COMPOSITE MARKET, BY FIBER TYPE, 2022-2032 (KILOTON)
- TABLE 171. SAUDI ARABIA AEROSPACE COMPOSITE MARKET, BY MANUFACTURING PROCESS, 2022-2032 ($MILLION)
- TABLE 172. SAUDI ARABIA AEROSPACE COMPOSITE MARKET, BY MANUFACTURING PROCESS, 2022-2032 (KILOTON)
- TABLE 173. SAUDI ARABIA AEROSPACE COMPOSITE MARKET, BY AIRCRAFT, 2022-2032 ($MILLION)
- TABLE 174. SAUDI ARABIA AEROSPACE COMPOSITE MARKET, BY AIRCRAFT, 2022-2032 (KILOTON)
- TABLE 175. REST OF LAMEA AEROSPACE COMPOSITE MARKET, BY FIBER TYPE, 2022-2032 ($MILLION)
- TABLE 176. REST OF LAMEA AEROSPACE COMPOSITE MARKET, BY FIBER TYPE, 2022-2032 (KILOTON)
- TABLE 177. REST OF LAMEA AEROSPACE COMPOSITE MARKET, BY MANUFACTURING PROCESS, 2022-2032 ($MILLION)
- TABLE 178. REST OF LAMEA AEROSPACE COMPOSITE MARKET, BY MANUFACTURING PROCESS, 2022-2032 (KILOTON)
- TABLE 179. REST OF LAMEA AEROSPACE COMPOSITE MARKET, BY AIRCRAFT, 2022-2032 ($MILLION)
- TABLE 180. REST OF LAMEA AEROSPACE COMPOSITE MARKET, BY AIRCRAFT, 2022-2032 (KILOTON)
- TABLE 181. BALLY RIBBON MILLS: KEY EXECUTIVES
- TABLE 182. BALLY RIBBON MILLS: COMPANY SNAPSHOT
- TABLE 183. BALLY RIBBON MILLS: PRODUCT SEGMENTS
- TABLE 184. BALLY RIBBON MILLS: PRODUCT PORTFOLIO
- TABLE 185. DUPONT: KEY EXECUTIVES
- TABLE 186. DUPONT: COMPANY SNAPSHOT
- TABLE 187. DUPONT: PRODUCT SEGMENTS
- TABLE 188. DUPONT: PRODUCT PORTFOLIO
- TABLE 189. HEXCEL CORPORATION: KEY EXECUTIVES
- TABLE 190. HEXCEL CORPORATION: COMPANY SNAPSHOT
- TABLE 191. HEXCEL CORPORATION: PRODUCT SEGMENTS
- TABLE 192. HEXCEL CORPORATION: PRODUCT PORTFOLIO
- TABLE 193. HEXCEL CORPORATION: KEY STRATERGIES
- TABLE 194. MITSUBISHI ELECTRIC CORPORATION: KEY EXECUTIVES
- TABLE 195. MITSUBISHI ELECTRIC CORPORATION: COMPANY SNAPSHOT
- TABLE 196. MITSUBISHI ELECTRIC CORPORATION: PRODUCT SEGMENTS
- TABLE 197. MITSUBISHI ELECTRIC CORPORATION: PRODUCT PORTFOLIO
- TABLE 198. SGL CARBON: KEY EXECUTIVES
- TABLE 199. SGL CARBON: COMPANY SNAPSHOT
- TABLE 200. SGL CARBON: PRODUCT SEGMENTS
- TABLE 201. SGL CARBON: PRODUCT PORTFOLIO
- TABLE 202. SOLVAY: KEY EXECUTIVES
- TABLE 203. SOLVAY: COMPANY SNAPSHOT
- TABLE 204. SOLVAY: PRODUCT SEGMENTS
- TABLE 205. SOLVAY: PRODUCT PORTFOLIO
- TABLE 206. SOLVAY: KEY STRATERGIES
- TABLE 207. SPIRIT AEROSYSTEMS, INC.: KEY EXECUTIVES
- TABLE 208. SPIRIT AEROSYSTEMS, INC.: COMPANY SNAPSHOT
- TABLE 209. SPIRIT AEROSYSTEMS, INC.: PRODUCT SEGMENTS
- TABLE 210. SPIRIT AEROSYSTEMS, INC.: PRODUCT PORTFOLIO
- TABLE 211. TEIJIN LIMITED.: KEY EXECUTIVES
- TABLE 212. TEIJIN LIMITED.: COMPANY SNAPSHOT
- TABLE 213. TEIJIN LIMITED.: PRODUCT SEGMENTS
- TABLE 214. TEIJIN LIMITED.: PRODUCT PORTFOLIO
- TABLE 215. TORAY INDUSTRIES, INC.: KEY EXECUTIVES
- TABLE 216. TORAY INDUSTRIES, INC.: COMPANY SNAPSHOT
- TABLE 217. TORAY INDUSTRIES, INC.: PRODUCT SEGMENTS
- TABLE 218. TORAY INDUSTRIES, INC.: PRODUCT PORTFOLIO
- TABLE 219. VX AEROSPACE CORPORATION: KEY EXECUTIVES
- TABLE 220. VX AEROSPACE CORPORATION: COMPANY SNAPSHOT
- TABLE 221. VX AEROSPACE CORPORATION: PRODUCT SEGMENTS
- TABLE 222. VX AEROSPACE CORPORATION: PRODUCT PORTFOLIO
LIST OF FIGURES
- FIGURE 01. AEROSPACE COMPOSITE MARKET, 2022-2032
- FIGURE 02. SEGMENTATION OF AEROSPACE COMPOSITE MARKET,2022-2032
- FIGURE 03. TOP IMPACTING FACTORS IN AEROSPACE COMPOSITE MARKET (2022 TO 2032)
- FIGURE 04. TOP INVESTMENT POCKETS IN AEROSPACE COMPOSITE MARKET (2023-2032)
- FIGURE 05. MODERATE BARGAINING POWER OF SUPPLIERS
- FIGURE 06. HIGH THREAT OF NEW ENTRANTS
- FIGURE 07. MODERATE THREAT OF SUBSTITUTES
- FIGURE 08. MODERATE INTENSITY OF RIVALRY
- FIGURE 09. MODERATE BARGAINING POWER OF BUYERS
- FIGURE 10. GLOBAL AEROSPACE COMPOSITE MARKET:DRIVERS, RESTRAINTS AND OPPORTUNITIES
- FIGURE 11. IMPACT OF KEY REGULATION: AEROSPACE COMPOSITE MARKET
- FIGURE 12. PATENT ANALYSIS BY COMPANY
- FIGURE 13. PATENT ANALYSIS BY COUNTRY
- FIGURE 14. PRICING ANALYSIS: AEROSPACE COMPOSITE MARKET 2022 AND 2032
- FIGURE 15. AEROSPACE COMPOSITE MARKET, BY FIBER TYPE, 2022 AND 2032(%)
- FIGURE 16. COMPARATIVE SHARE ANALYSIS OF AEROSPACE COMPOSITE MARKET FOR CARBON FIBER, BY COUNTRY 2022 AND 2032(%)
- FIGURE 17. COMPARATIVE SHARE ANALYSIS OF AEROSPACE COMPOSITE MARKET FOR GLASS FIBER, BY COUNTRY 2022 AND 2032(%)
- FIGURE 18. COMPARATIVE SHARE ANALYSIS OF AEROSPACE COMPOSITE MARKET FOR ARAMID FIBER, BY COUNTRY 2022 AND 2032(%)
- FIGURE 19. COMPARATIVE SHARE ANALYSIS OF AEROSPACE COMPOSITE MARKET FOR OTHER, BY COUNTRY 2022 AND 2032(%)
- FIGURE 20. AEROSPACE COMPOSITE MARKET, BY MANUFACTURING PROCESS, 2022 AND 2032(%)
- FIGURE 21. COMPARATIVE SHARE ANALYSIS OF AEROSPACE COMPOSITE MARKET FOR ATL OR AFP, BY COUNTRY 2022 AND 2032(%)
- FIGURE 22. COMPARATIVE SHARE ANALYSIS OF AEROSPACE COMPOSITE MARKET FOR FILAMENT WINDING, BY COUNTRY 2022 AND 2032(%)
- FIGURE 23. COMPARATIVE SHARE ANALYSIS OF AEROSPACE COMPOSITE MARKET FOR RESIN TRANSFER MOLDING, BY COUNTRY 2022 AND 2032(%)
- FIGURE 24. COMPARATIVE SHARE ANALYSIS OF AEROSPACE COMPOSITE MARKET FOR HAND LAYUP, BY COUNTRY 2022 AND 2032(%)
- FIGURE 25. COMPARATIVE SHARE ANALYSIS OF AEROSPACE COMPOSITE MARKET FOR OTHER, BY COUNTRY 2022 AND 2032(%)
- FIGURE 26. AEROSPACE COMPOSITE MARKET, BY AIRCRAFT, 2022 AND 2032(%)
- FIGURE 27. COMPARATIVE SHARE ANALYSIS OF AEROSPACE COMPOSITE MARKET FOR COMMERCIAL AIRCRAFT, BY COUNTRY 2022 AND 2032(%)
- FIGURE 28. COMPARATIVE SHARE ANALYSIS OF AEROSPACE COMPOSITE MARKET FOR BUSINESS AND GENERAL AVATION, BY COUNTRY 2022 AND 2032(%)
- FIGURE 29. COMPARATIVE SHARE ANALYSIS OF AEROSPACE COMPOSITE MARKET FOR CIVIL HELICOPTOR, BY COUNTRY 2022 AND 2032(%)
- FIGURE 30. COMPARATIVE SHARE ANALYSIS OF AEROSPACE COMPOSITE MARKET FOR OTHER, BY COUNTRY 2022 AND 2032(%)
- FIGURE 31. AEROSPACE COMPOSITE MARKET BY REGION, 2022 AND 2032(%)
- FIGURE 32. U.S. AEROSPACE COMPOSITE MARKET, 2022-2032 ($MILLION)
- FIGURE 33. CANADA AEROSPACE COMPOSITE MARKET, 2022-2032 ($MILLION)
- FIGURE 34. MEXICO AEROSPACE COMPOSITE MARKET, 2022-2032 ($MILLION)
- FIGURE 35. GERMANY AEROSPACE COMPOSITE MARKET, 2022-2032 ($MILLION)
- FIGURE 36. FRANCE AEROSPACE COMPOSITE MARKET, 2022-2032 ($MILLION)
- FIGURE 37. UK AEROSPACE COMPOSITE MARKET, 2022-2032 ($MILLION)
- FIGURE 38. SPAIN AEROSPACE COMPOSITE MARKET, 2022-2032 ($MILLION)
- FIGURE 39. ITALY AEROSPACE COMPOSITE MARKET, 2022-2032 ($MILLION)
- FIGURE 40. REST OF EUROPE AEROSPACE COMPOSITE MARKET, 2022-2032 ($MILLION)
- FIGURE 41. CHINA AEROSPACE COMPOSITE MARKET, 2022-2032 ($MILLION)
- FIGURE 42. INDIA AEROSPACE COMPOSITE MARKET, 2022-2032 ($MILLION)
- FIGURE 43. JAPAN AEROSPACE COMPOSITE MARKET, 2022-2032 ($MILLION)
- FIGURE 44. SOUTH KOREA AEROSPACE COMPOSITE MARKET, 2022-2032 ($MILLION)
- FIGURE 45. AUSTRALIA AEROSPACE COMPOSITE MARKET, 2022-2032 ($MILLION)
- FIGURE 46. REST OF ASIA-PACIFIC AEROSPACE COMPOSITE MARKET, 2022-2032 ($MILLION)
- FIGURE 47. BRAZIL AEROSPACE COMPOSITE MARKET, 2022-2032 ($MILLION)
- FIGURE 48. SOUTH AFRICA AEROSPACE COMPOSITE MARKET, 2022-2032 ($MILLION)
- FIGURE 49. SAUDI ARABIA AEROSPACE COMPOSITE MARKET, 2022-2032 ($MILLION)
- FIGURE 50. REST OF LAMEA AEROSPACE COMPOSITE MARKET, 2022-2032 ($MILLION)
- FIGURE 51. TOP WINNING STRATEGIES, BY YEAR (2021-2022)
- FIGURE 52. TOP WINNING STRATEGIES, BY DEVELOPMENT (2021-2022)
- FIGURE 53. TOP WINNING STRATEGIES, BY COMPANY (2021-2022)
- FIGURE 54. PRODUCT MAPPING OF TOP 10 PLAYERS
- FIGURE 55. COMPETITIVE DASHBOARD
- FIGURE 56. COMPETITIVE HEATMAP: AEROSPACE COMPOSITE MARKET
- FIGURE 57. TOP PLAYER POSITIONING, 2022
- FIGURE 58. DUPONT: NET SALES, 2020-2022 ($MILLION)
- FIGURE 59. DUPONT: RESEARCH & DEVELOPMENT EXPENDITURE, 2020-2022 ($MILLION)
- FIGURE 60. DUPONT: REVENUE SHARE BY SEGMENT, 2022 (%)
- FIGURE 61. DUPONT: REVENUE SHARE BY REGION, 2022 (%)
- FIGURE 62. HEXCEL CORPORATION: NET SALES, 2020-2022 ($MILLION)
- FIGURE 63. HEXCEL CORPORATION: REVENUE SHARE BY SEGMENT, 2022 (%)
- FIGURE 64. HEXCEL CORPORATION: REVENUE SHARE BY REGION, 2022 (%)
- FIGURE 65. MITSUBISHI ELECTRIC CORPORATION: NET REVENUE, 2020-2022 ($MILLION)
- FIGURE 66. MITSUBISHI ELECTRIC CORPORATION: REVENUE SHARE BY SEGMENT, 2022 (%)
- FIGURE 67. MITSUBISHI ELECTRIC CORPORATION: REVENUE SHARE BY REGION, 2022 (%)
- FIGURE 68. SGL CARBON: NET REVENUE, 2020-2022 ($MILLION)
- FIGURE 69. SGL CARBON: RESEARCH & DEVELOPMENT EXPENDITURE, 2020-2022 ($MILLION)
- FIGURE 70. SGL CARBON: REVENUE SHARE BY SEGMENT, 2022 (%)
- FIGURE 71. SGL CARBON: REVENUE SHARE BY REGION, 2022 (%)
- FIGURE 72. SOLVAY: NET SALES, 2020-2022 ($MILLION)
- FIGURE 73. SOLVAY: RESEARCH & DEVELOPMENT EXPENDITURE, 2020-2022 ($MILLION)
- FIGURE 74. SOLVAY: REVENUE SHARE BY REGION, 2022 (%)
- FIGURE 75. SOLVAY: REVENUE SHARE BY REGION, 2022 (%)
- FIGURE 76. SPIRIT AEROSYSTEMS, INC.: NET REVENUE, 2020-2022 ($MILLION)
- FIGURE 77. SPIRIT AEROSYSTEMS, INC.: REVENUE SHARE BY SEGMENT, 2022 (%)
- FIGURE 78. TEIJIN LIMITED.: NET SALES, 2020-2022 ($MILLION)
- FIGURE 79. TEIJIN LIMITED.: REVENUE SHARE BY SEGMENT, 2022 (%)
- FIGURE 80. TEIJIN LIMITED.: REVENUE SHARE BY REGION, 2022 (%)
- FIGURE 81. TORAY INDUSTRIES, INC.: NET REVENUE, 2020-2022 ($MILLION)
- FIGURE 82. TORAY INDUSTRIES, INC.: REVENUE SHARE BY SEGMENT, 2022 (%)
- FIGURE 83. TORAY INDUSTRIES, INC.: REVENUE SHARE BY REGION, 2022 (%)
 2024-2028年全球航太複合材料市場
 2024-2028年航太領域複合材料與鋁合金的全球市場
 2024 年無人複合材料世界市場報告
 航空引擎複合材料市場:按組件、類型和應用分類 - 2024-2030 年全球預測
 高速飛機和飛彈複合材料市場:按纖維類型、樹脂類型、製造流程、應用和最終用途分類 - 2024-2030 年全球預測
 2024 年航太複合材料全球市場報告
 2024年航太複合鋁合金全球市場報告
 全球無人駕駛複合材料市場研究報告 - 2023年至2030年行業分析、規模、佔有率、成長、趨勢和預測
 全球航太複合材料市場:2024-2034
 航太和無人駕駛複合複合材料市場 - 全球和區域分析:2023-2033