


 |
市場調查報告書
商品編碼
1414885
印刷電子市場:按技術、材料和應用分類:2023-2032年全球機會分析和產業預測Printed Electronics Market By Technology, By Material, By Application : Global Opportunity Analysis and Industry Forecast, 2023-2032 |
||||||
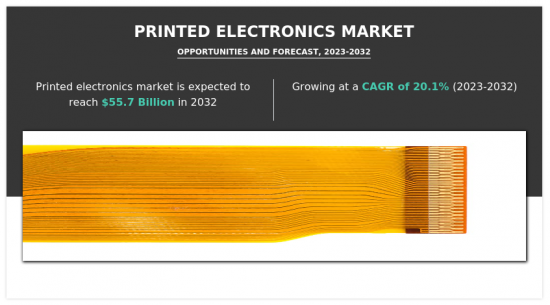
2022年印刷電子市場的市場規模預計為94億美元,預計到2032年將達到557億美元,2023年至2032年的年複合成長率為20.1%。
印刷電子是一個發展中的領域,有可能改變電氣設備的製造方式。這種創新方法包括印刷電子材料,例如:
- 將導電油墨或有機聚合物印刷到各種表面上。隨著該領域發展步伐的加快,有必要研究印刷電子環境的促進因素、效益、約束、約束、機會和技術突破。
對軟性和輕型電子產品不斷成長的需求是印刷電子產品採用的主要驅動力。雖然傳統的製造技術通常是僵化且昂貴的,但印刷電子產品提供了經濟且更靈活的選擇。此外,人們對物聯網(IoT)設備的興趣日益濃厚,需要低成本、大量生產,這使得印刷電子產品成為一個有吸引力的選擇。此外,環境永續性也是一個重要的促進因素,因為印刷電子產品比傳統製造產生的廢棄物更少,有機和生物分解性組件的使用符合全球綠色技術的趨勢,這是一個促成因素。此外,醫療感測器和診斷設備可以在軟性、生物相容性基板上印製電子產品,使它們能夠貼合人體而不會引起不適。這為穿戴式健康監測設備和植入式感測器開闢了新的可能性,有可能改變患者的照護和診斷。
然而,印刷電子產品面臨著限制市場成長的各種障礙。一個主要障礙是與常規矽基電路相比性能較低。印刷電子產品中使用的材料可能不如傳統材料導電或耐用,這限制了它們在高性能設備中的使用。印刷電子產品的主要障礙之一是可建構的電路的複雜性受到限制。利用印刷技術,可能很難創建具有當今電子元件所需精度的複雜設計。與傳統製造流程相比,一個顯著的限制是列印過程緩慢且吞吐量低。對於需要高速、大量生產的應用來說,這可能是主要缺點。
印刷電子產品的使用預計將在各行業加速發展。能量收集是預計成長的領域之一。印刷太陽能電池和能源儲存設備為各種電子設備提供長期電力源,從小型感測器到大型應用,例如:
- 智慧建築。將能源採集功能引進印刷電子產品符合世界向再生能源和節能設備的轉變。透過持續的研究和開發計劃,印刷電子產品有著光明的未來。隨著材料科學和印刷技術的進步,印刷電子設備的性能和容量有望激增。靈活、輕巧的顯示器可以連接到意想不到的表面,將日常物品變成互動式小工具。這使得創新的產品設計和使用者體驗成為可能。汽車產業可以受益於印刷電子產品來生產軟性顯示器、感測器和其他組件。
供應鏈崩壞是對印刷電子產品最直接、最重大的影響之一。封鎖、旅行限制和員工短缺擾亂了作為印刷電子業務支柱的供應商、製造商和經銷商的複雜網路。這導致了關鍵材料的獲取延遲,包括:
- 製造印刷電子設備所需的導電油墨、基板和其他組件。採取靈活且富有想像力的策略的公司不僅克服了眼前的挑戰,而且還為自己奠定了長期成功的基礎。例如,目的是生產印刷電子解決方案以防止病毒傳播的研發激增。
目錄
第1章 簡介
第2章 執行摘要
第3章 市場概況
- 市場定義和範圍
- 主要發現
- 影響因素
- 主要投資機會
- 波特五力分析
- 市場動態
- 促進因素
- 抑制因素
- 機會
- 平均售價
- 市場佔有率分析
- 品牌佔有率分析
- 貿易資料分析
- 產品消費
- 價值鏈分析
- 關鍵監管分析
- 專利形勢
- 贖回場景
- 監管指引
第4章 印刷電子市場:依技術分類
- 概述
- 噴墨印刷
- 網版印刷
- 凹版印刷
- 彈性凸版印刷
第5章 印刷電子市場:依材料分類
- 概述
- 墨水
- 基板
第6章 印刷電子市場:依應用分類
- 概述
- 展示
- 太陽能
- 照明
- RFID
- 其他
第7章 印刷電子市場,依地區
- 概述
- 北美洲
- 美國
- 加拿大
- 墨西哥
- 歐洲
- 德國
- 英國
- 法國
- 西班牙
- 義大利
- 其他
- 亞太地區
- 中國
- 日本
- 印度
- 韓國
- 澳洲
- 其他
- 拉丁美洲、中東、非洲
- 巴西
- 阿拉伯聯合大公國
- 沙烏地阿拉伯
- 南非
- 其他
第8章 競爭形勢
- 介紹
- 關鍵成功策略
- 10家主要企業產品圖譜
- 競爭對手儀表板
- 競爭熱圖
- 2022年主要企業定位
第9章 公司簡介
- Samsung Electronics Co., Ltd.
- LG Display Co., Ltd.
- Molex LLC
- Agfa-Gevaert Group
- Palo Alto Research Center Incorporated(PARC)
- DuPont(EI)De Nemours
- Nissha Co. Ltd
- BASF SE
- NovaCentrix
- E Ink Holdings Inc.
According to a new report published by Allied Market Research, titled, "Printed Electronics Market," The printed electronics market was valued at $9.4 billion in 2022, and is estimated to reach $55.7 billion by 2032, growing at a CAGR of 20.1% from 2023 to 2032.
Printed electronics is a developing area that has the potential to transform the way electrical devices are made. This innovative method includes the printing of electronic materials such as conductive inks and organic polymers onto diverse surfaces. As the sector develops pace, it is vital to investigate the drivers, benefits, constraints, restraints, opportunities, and technical breakthroughs that characterize the printed electronics environment.
Rise in the demand for flexible and lightweight electronic devices is a main driver of printed electronics adoption. Traditional manufacturing techniques are usually rigid and costly, whereas printed electronics provide economical and more flexible options. Furthermore, the surge interest in Internet of Things (IoT) devices has led to the demand for low-cost, high-volume production procedures, making printed electronics a tempting alternative. In addition, another key driver is the environmental sustainability of printed electronics compared to traditional manufacturing, as this printing approach generates less waste, and the use of organic and biodegradable components aligns with the global trend toward green technology. Moreover, medical sensors and diagnostic equipment may conform to the human body without causing discomfort due to the ability to print electronics on flexible and biocompatible substrates. This opens new opportunities for wearable health monitoring devices and implanted sensors, with the potential to transform patient care and diagnostics.
However, printed electronics have various obstacles that restrict market growth. The lower performance compared to ordinary silicon-based circuits is a significant barrier. The materials used in printed electronics may not be as conductive or durable as traditional materials, limiting their use in high-performance devices. One of the major hurdles of printed electronics is the limited complexity of circuits that may be built. Printing technology may now struggle to create intricate designs with the accuracy required for current electrical components. When compared to traditional manufacturing processes, one notable limitation is that printing procedures are slower and have a lower throughput. This can be a significant drawback for applications that need high-speed, high-volume production.
The use of printed electronics in a variety of industries will accelerate. Energy harvesting is one area where growth is expected. Printed solar cells and energy storage devices offer a long-term power source for electronic devices ranging from small sensors to larger applications such as smart buildings. The introduction of energy-harvesting capabilities into printed electronics aligns with the global shift toward renewable energy and energy-efficient devices. Printed electronics has a bright future, due to ongoing R&D initiatives. The performance and capacities of printed electrical devices are expected to surge as material science and printing technology advance. Flexible and lightweight displays may be put onto unexpected surfaces, transforming everyday objects into interactive gadgets. This allows for innovative product designs and user experiences. The automotive industry may profit from printed electronics and to produce flexible displays, sensors, and other components.
The breakdown of supply networks has been one of the most immediate and important impacts of the outbreak on printed electronics. Lockdowns, travel restrictions, and staffing shortages disturbed the complex network of suppliers, manufacturers, and distributors that constitutes the backbone of the printed electronics business. This resulted in delays in acquiring crucial materials such as conductive inks, substrates, and other components needed for the manufacture of printed electronic devices. Companies who adopted a flexible and imaginative strategy not only overcame the immediate challenges, but also positioned themselves for long-term success. For instance, there was a surge in R&D work aimed at producing printed electronics solutions to prevent virus spread.
The key players profiled in this report include: Samsung Electronics Co., Ltd., LG Display Co., Ltd., Molex LLC, Agfa-Gevaert Group, Palo Alto Research Center Incorporated (PARC), DuPont de Nemours, Inc., Nissha Co., Ltd., BASF, Nova Centrix, and E Ink Holdings Inc. The market players are continuously striving to achieve a dominant position in this competitive market using strategies such as research and development (R&D) and focus on sustainable and flexible materials.
Key Benefits For Stakeholders
- This report provides a quantitative analysis of the market segments, current trends, estimations, and dynamics of the printed electronics market analysis from 2022 to 2032 to identify the prevailing printed electronics market opportunities.
- The market research is offered along with information related to key drivers, restraints, and opportunities.
- Porter's five forces analysis highlights the potency of buyers and suppliers to enable stakeholders make profit-oriented business decisions and strengthen their supplier-buyer network.
- In-depth analysis of the printed electronics market segmentation assists to determine the prevailing market opportunities.
- Major countries in each region are mapped according to their revenue contribution to the global market.
- Market player positioning facilitates benchmarking and provides a clear understanding of the present position of the market players.
- The report includes the analysis of the regional as well as global printed electronics market trends, key players, market segments, application areas, and market growth strategies.
Additional benefits you will get with this purchase are:
- Quarterly Update and* (only available with a corporate license, on listed price)
- 5 additional Company Profile of client Choice pre- or Post-purchase, as a free update.
- Free Upcoming Version on the Purchase of Five and Enterprise User License.
- 16 analyst hours of support* (post-purchase, if you find additional data requirements upon review of the report, you may receive support amounting to 16 analyst hours to solve questions, and post-sale queries)
- 15% Free Customization* (in case the scope or segment of the report does not match your requirements, 15% is equivalent to 3 working days of free work, applicable once)
- Free data Pack on the Five and Enterprise User License. (Excel version of the report)
- Free Updated report if the report is 6-12 months old or older.
- 24-hour priority response*
- Free Industry updates and white papers.
Possible Customization with this report (with additional cost and timeline, please talk to the sales executive to know more)
- Product Benchmarking / Product specification and applications
- Upcoming/New Entrant by Regions
- Technology Trend Analysis
- Go To Market Strategy
- Market share analysis of players by products/segments
- New Product Development/ Product Matrix of Key Players
- Patient/epidemiology data at country, region, global level
- Regulatory Guidelines
- Additional company profiles with specific to client's interest
- Additional country or region analysis- market size and forecast
- Criss-cross segment analysis- market size and forecast
- Expanded list for Company Profiles
- Historic market data
- Key player details (including location, contact details, supplier/vendor network etc. in excel format)
- List of customers/consumers/raw material suppliers- value chain analysis
- Market share analysis of players at global/region/country level
- SWOT Analysis
Key Market Segments
By Technology
- Inkjet Printing
- Screen Printing
- Gravure Printing
- Flexographic Printing
By Material
- Inks
- Substrates
By Application
- Display
- Photovoltaic
- Lighting
- RFID
- Others
By Region
- North America
- U.S.
- Canada
- Mexico
- Europe
- Germany
- UK
- France
- Spain
- Italy
- Rest of Europe
- Asia-Pacific
- China
- Japan
- India
- South Korea
- Australia
- Rest of Asia-Pacific
- LAMEA
- Brazil
- United Arab Emirates
- Saudi Arabia
- South Africa
- Rest of LAMEA
Key Market Players:
- Samsung Electronics Co., Ltd.
- LG Display Co., Ltd.
- Molex LLC
- Agfa-Gevaert Group
- Palo Alto Research Center Incorporated (PARC)
- DuPont (EI) De Nemours
- Nissha Co. Ltd
- BASF SE
- NovaCentrix
- E Ink Holdings Inc.
TABLE OF CONTENTS
CHAPTER 1: INTRODUCTION
- 1.1. Report description
- 1.2. Key market segments
- 1.3. Key benefits to the stakeholders
- 1.4. Research methodology
- 1.4.1. Primary research
- 1.4.2. Secondary research
- 1.4.3. Analyst tools and models
CHAPTER 2: EXECUTIVE SUMMARY
- 2.1. CXO Perspective
CHAPTER 3: MARKET OVERVIEW
- 3.1. Market definition and scope
- 3.2. Key findings
- 3.2.1. Top impacting factors
- 3.2.2. Top investment pockets
- 3.3. Porter's five forces analysis
- 3.4. Market dynamics
- 3.4.1. Drivers
- 3.4.2. Restraints
- 3.4.3. Opportunities
- 3.5. Average Selling Price
- 3.6. Market Share Analysis
- 3.7. Brand Share Analysis
- 3.8. Trade Data Analysis
- 3.9. Product Consumption
- 3.10. Value Chain Analysis
- 3.11. Key Regulation Analysis
- 3.12. Patent Landscape
- 3.13. Reimbursement Scenario
- 3.14. Regulatory Guidelines
CHAPTER 4: PRINTED ELECTRONICS MARKET, BY TECHNOLOGY
- 4.1. Overview
- 4.1.1. Market size and forecast
- 4.2. Inkjet Printing
- 4.2.1. Key market trends, growth factors and opportunities
- 4.2.2. Market size and forecast, by region
- 4.2.3. Market share analysis by country
- 4.3. Screen Printing
- 4.3.1. Key market trends, growth factors and opportunities
- 4.3.2. Market size and forecast, by region
- 4.3.3. Market share analysis by country
- 4.4. Gravure Printing
- 4.4.1. Key market trends, growth factors and opportunities
- 4.4.2. Market size and forecast, by region
- 4.4.3. Market share analysis by country
- 4.5. Flexographic Printing
- 4.5.1. Key market trends, growth factors and opportunities
- 4.5.2. Market size and forecast, by region
- 4.5.3. Market share analysis by country
CHAPTER 5: PRINTED ELECTRONICS MARKET, BY MATERIAL
- 5.1. Overview
- 5.1.1. Market size and forecast
- 5.2. Inks
- 5.2.1. Key market trends, growth factors and opportunities
- 5.2.2. Market size and forecast, by region
- 5.2.3. Market share analysis by country
- 5.3. Substrates
- 5.3.1. Key market trends, growth factors and opportunities
- 5.3.2. Market size and forecast, by region
- 5.3.3. Market share analysis by country
CHAPTER 6: PRINTED ELECTRONICS MARKET, BY APPLICATION
- 6.1. Overview
- 6.1.1. Market size and forecast
- 6.2. Display
- 6.2.1. Key market trends, growth factors and opportunities
- 6.2.2. Market size and forecast, by region
- 6.2.3. Market share analysis by country
- 6.3. Photovoltaic
- 6.3.1. Key market trends, growth factors and opportunities
- 6.3.2. Market size and forecast, by region
- 6.3.3. Market share analysis by country
- 6.4. Lighting
- 6.4.1. Key market trends, growth factors and opportunities
- 6.4.2. Market size and forecast, by region
- 6.4.3. Market share analysis by country
- 6.5. RFID
- 6.5.1. Key market trends, growth factors and opportunities
- 6.5.2. Market size and forecast, by region
- 6.5.3. Market share analysis by country
- 6.6. Others
- 6.6.1. Key market trends, growth factors and opportunities
- 6.6.2. Market size and forecast, by region
- 6.6.3. Market share analysis by country
CHAPTER 7: PRINTED ELECTRONICS MARKET, BY REGION
- 7.1. Overview
- 7.1.1. Market size and forecast By Region
- 7.2. North America
- 7.2.1. Key market trends, growth factors and opportunities
- 7.2.2. Market size and forecast, by Technology
- 7.2.3. Market size and forecast, by Material
- 7.2.4. Market size and forecast, by Application
- 7.2.5. Market size and forecast, by country
- 7.2.5.1. U.S.
- 7.2.5.1.1. Market size and forecast, by Technology
- 7.2.5.1.2. Market size and forecast, by Material
- 7.2.5.1.3. Market size and forecast, by Application
- 7.2.5.2. Canada
- 7.2.5.2.1. Market size and forecast, by Technology
- 7.2.5.2.2. Market size and forecast, by Material
- 7.2.5.2.3. Market size and forecast, by Application
- 7.2.5.3. Mexico
- 7.2.5.3.1. Market size and forecast, by Technology
- 7.2.5.3.2. Market size and forecast, by Material
- 7.2.5.3.3. Market size and forecast, by Application
- 7.3. Europe
- 7.3.1. Key market trends, growth factors and opportunities
- 7.3.2. Market size and forecast, by Technology
- 7.3.3. Market size and forecast, by Material
- 7.3.4. Market size and forecast, by Application
- 7.3.5. Market size and forecast, by country
- 7.3.5.1. Germany
- 7.3.5.1.1. Market size and forecast, by Technology
- 7.3.5.1.2. Market size and forecast, by Material
- 7.3.5.1.3. Market size and forecast, by Application
- 7.3.5.2. UK
- 7.3.5.2.1. Market size and forecast, by Technology
- 7.3.5.2.2. Market size and forecast, by Material
- 7.3.5.2.3. Market size and forecast, by Application
- 7.3.5.3. France
- 7.3.5.3.1. Market size and forecast, by Technology
- 7.3.5.3.2. Market size and forecast, by Material
- 7.3.5.3.3. Market size and forecast, by Application
- 7.3.5.4. Spain
- 7.3.5.4.1. Market size and forecast, by Technology
- 7.3.5.4.2. Market size and forecast, by Material
- 7.3.5.4.3. Market size and forecast, by Application
- 7.3.5.5. Italy
- 7.3.5.5.1. Market size and forecast, by Technology
- 7.3.5.5.2. Market size and forecast, by Material
- 7.3.5.5.3. Market size and forecast, by Application
- 7.3.5.6. Rest of Europe
- 7.3.5.6.1. Market size and forecast, by Technology
- 7.3.5.6.2. Market size and forecast, by Material
- 7.3.5.6.3. Market size and forecast, by Application
- 7.4. Asia-Pacific
- 7.4.1. Key market trends, growth factors and opportunities
- 7.4.2. Market size and forecast, by Technology
- 7.4.3. Market size and forecast, by Material
- 7.4.4. Market size and forecast, by Application
- 7.4.5. Market size and forecast, by country
- 7.4.5.1. China
- 7.4.5.1.1. Market size and forecast, by Technology
- 7.4.5.1.2. Market size and forecast, by Material
- 7.4.5.1.3. Market size and forecast, by Application
- 7.4.5.2. Japan
- 7.4.5.2.1. Market size and forecast, by Technology
- 7.4.5.2.2. Market size and forecast, by Material
- 7.4.5.2.3. Market size and forecast, by Application
- 7.4.5.3. India
- 7.4.5.3.1. Market size and forecast, by Technology
- 7.4.5.3.2. Market size and forecast, by Material
- 7.4.5.3.3. Market size and forecast, by Application
- 7.4.5.4. South Korea
- 7.4.5.4.1. Market size and forecast, by Technology
- 7.4.5.4.2. Market size and forecast, by Material
- 7.4.5.4.3. Market size and forecast, by Application
- 7.4.5.5. Australia
- 7.4.5.5.1. Market size and forecast, by Technology
- 7.4.5.5.2. Market size and forecast, by Material
- 7.4.5.5.3. Market size and forecast, by Application
- 7.4.5.6. Rest of Asia-Pacific
- 7.4.5.6.1. Market size and forecast, by Technology
- 7.4.5.6.2. Market size and forecast, by Material
- 7.4.5.6.3. Market size and forecast, by Application
- 7.5. LAMEA
- 7.5.1. Key market trends, growth factors and opportunities
- 7.5.2. Market size and forecast, by Technology
- 7.5.3. Market size and forecast, by Material
- 7.5.4. Market size and forecast, by Application
- 7.5.5. Market size and forecast, by country
- 7.5.5.1. Brazil
- 7.5.5.1.1. Market size and forecast, by Technology
- 7.5.5.1.2. Market size and forecast, by Material
- 7.5.5.1.3. Market size and forecast, by Application
- 7.5.5.2. United Arab Emirates
- 7.5.5.2.1. Market size and forecast, by Technology
- 7.5.5.2.2. Market size and forecast, by Material
- 7.5.5.2.3. Market size and forecast, by Application
- 7.5.5.3. Saudi Arabia
- 7.5.5.3.1. Market size and forecast, by Technology
- 7.5.5.3.2. Market size and forecast, by Material
- 7.5.5.3.3. Market size and forecast, by Application
- 7.5.5.4. South Africa
- 7.5.5.4.1. Market size and forecast, by Technology
- 7.5.5.4.2. Market size and forecast, by Material
- 7.5.5.4.3. Market size and forecast, by Application
- 7.5.5.5. Rest of LAMEA
- 7.5.5.5.1. Market size and forecast, by Technology
- 7.5.5.5.2. Market size and forecast, by Material
- 7.5.5.5.3. Market size and forecast, by Application
CHAPTER 8: COMPETITIVE LANDSCAPE
- 8.1. Introduction
- 8.2. Top winning strategies
- 8.3. Product mapping of top 10 player
- 8.4. Competitive dashboard
- 8.5. Competitive heatmap
- 8.6. Top player positioning, 2022
CHAPTER 9: COMPANY PROFILES
- 9.1. Samsung Electronics Co., Ltd.
- 9.1.1. Company overview
- 9.1.2. Key executives
- 9.1.3. Company snapshot
- 9.2. LG Display Co., Ltd.
- 9.2.1. Company overview
- 9.2.2. Key executives
- 9.2.3. Company snapshot
- 9.3. Molex LLC
- 9.3.1. Company overview
- 9.3.2. Key executives
- 9.3.3. Company snapshot
- 9.4. Agfa-Gevaert Group
- 9.4.1. Company overview
- 9.4.2. Key executives
- 9.4.3. Company snapshot
- 9.5. Palo Alto Research Center Incorporated (PARC)
- 9.5.1. Company overview
- 9.5.2. Key executives
- 9.5.3. Company snapshot
- 9.6. DuPont (EI) De Nemours
- 9.6.1. Company overview
- 9.6.2. Key executives
- 9.6.3. Company snapshot
- 9.7. Nissha Co. Ltd
- 9.7.1. Company overview
- 9.7.2. Key executives
- 9.7.3. Company snapshot
- 9.8. BASF SE
- 9.8.1. Company overview
- 9.8.2. Key executives
- 9.8.3. Company snapshot
- 9.9. NovaCentrix
- 9.9.1. Company overview
- 9.9.2. Key executives
- 9.9.3. Company snapshot
- 9.10. E Ink Holdings Inc.
- 9.10.1. Company overview
- 9.10.2. Key executives
- 9.10.3. Company snapshot
LIST OF TABLES
- TABLE 01. GLOBAL PRINTED ELECTRONICS MARKET, BY TECHNOLOGY, 2022-2032 ($MILLION)
- TABLE 02. PRINTED ELECTRONICS MARKET FOR INKJET PRINTING, BY REGION, 2022-2032 ($MILLION)
- TABLE 03. PRINTED ELECTRONICS MARKET FOR SCREEN PRINTING, BY REGION, 2022-2032 ($MILLION)
- TABLE 04. PRINTED ELECTRONICS MARKET FOR GRAVURE PRINTING, BY REGION, 2022-2032 ($MILLION)
- TABLE 05. PRINTED ELECTRONICS MARKET FOR FLEXOGRAPHIC PRINTING, BY REGION, 2022-2032 ($MILLION)
- TABLE 06. GLOBAL PRINTED ELECTRONICS MARKET, BY MATERIAL, 2022-2032 ($MILLION)
- TABLE 07. PRINTED ELECTRONICS MARKET FOR INKS, BY REGION, 2022-2032 ($MILLION)
- TABLE 08. PRINTED ELECTRONICS MARKET FOR SUBSTRATES, BY REGION, 2022-2032 ($MILLION)
- TABLE 09. GLOBAL PRINTED ELECTRONICS MARKET, BY APPLICATION, 2022-2032 ($MILLION)
- TABLE 10. PRINTED ELECTRONICS MARKET FOR DISPLAY, BY REGION, 2022-2032 ($MILLION)
- TABLE 11. PRINTED ELECTRONICS MARKET FOR PHOTOVOLTAIC, BY REGION, 2022-2032 ($MILLION)
- TABLE 12. PRINTED ELECTRONICS MARKET FOR LIGHTING, BY REGION, 2022-2032 ($MILLION)
- TABLE 13. PRINTED ELECTRONICS MARKET FOR RFID, BY REGION, 2022-2032 ($MILLION)
- TABLE 14. PRINTED ELECTRONICS MARKET FOR OTHERS, BY REGION, 2022-2032 ($MILLION)
- TABLE 15. PRINTED ELECTRONICS MARKET, BY REGION, 2022-2032 ($MILLION)
- TABLE 16. NORTH AMERICA PRINTED ELECTRONICS MARKET, BY TECHNOLOGY, 2022-2032 ($MILLION)
- TABLE 17. NORTH AMERICA PRINTED ELECTRONICS MARKET, BY MATERIAL, 2022-2032 ($MILLION)
- TABLE 18. NORTH AMERICA PRINTED ELECTRONICS MARKET, BY APPLICATION, 2022-2032 ($MILLION)
- TABLE 19. NORTH AMERICA PRINTED ELECTRONICS MARKET, BY COUNTRY, 2022-2032 ($MILLION)
- TABLE 20. U.S. PRINTED ELECTRONICS MARKET, BY TECHNOLOGY, 2022-2032 ($MILLION)
- TABLE 21. U.S. PRINTED ELECTRONICS MARKET, BY MATERIAL, 2022-2032 ($MILLION)
- TABLE 22. U.S. PRINTED ELECTRONICS MARKET, BY APPLICATION, 2022-2032 ($MILLION)
- TABLE 23. CANADA PRINTED ELECTRONICS MARKET, BY TECHNOLOGY, 2022-2032 ($MILLION)
- TABLE 24. CANADA PRINTED ELECTRONICS MARKET, BY MATERIAL, 2022-2032 ($MILLION)
- TABLE 25. CANADA PRINTED ELECTRONICS MARKET, BY APPLICATION, 2022-2032 ($MILLION)
- TABLE 26. MEXICO PRINTED ELECTRONICS MARKET, BY TECHNOLOGY, 2022-2032 ($MILLION)
- TABLE 27. MEXICO PRINTED ELECTRONICS MARKET, BY MATERIAL, 2022-2032 ($MILLION)
- TABLE 28. MEXICO PRINTED ELECTRONICS MARKET, BY APPLICATION, 2022-2032 ($MILLION)
- TABLE 29. EUROPE PRINTED ELECTRONICS MARKET, BY TECHNOLOGY, 2022-2032 ($MILLION)
- TABLE 30. EUROPE PRINTED ELECTRONICS MARKET, BY MATERIAL, 2022-2032 ($MILLION)
- TABLE 31. EUROPE PRINTED ELECTRONICS MARKET, BY APPLICATION, 2022-2032 ($MILLION)
- TABLE 32. EUROPE PRINTED ELECTRONICS MARKET, BY COUNTRY, 2022-2032 ($MILLION)
- TABLE 33. GERMANY PRINTED ELECTRONICS MARKET, BY TECHNOLOGY, 2022-2032 ($MILLION)
- TABLE 34. GERMANY PRINTED ELECTRONICS MARKET, BY MATERIAL, 2022-2032 ($MILLION)
- TABLE 35. GERMANY PRINTED ELECTRONICS MARKET, BY APPLICATION, 2022-2032 ($MILLION)
- TABLE 36. UK PRINTED ELECTRONICS MARKET, BY TECHNOLOGY, 2022-2032 ($MILLION)
- TABLE 37. UK PRINTED ELECTRONICS MARKET, BY MATERIAL, 2022-2032 ($MILLION)
- TABLE 38. UK PRINTED ELECTRONICS MARKET, BY APPLICATION, 2022-2032 ($MILLION)
- TABLE 39. FRANCE PRINTED ELECTRONICS MARKET, BY TECHNOLOGY, 2022-2032 ($MILLION)
- TABLE 40. FRANCE PRINTED ELECTRONICS MARKET, BY MATERIAL, 2022-2032 ($MILLION)
- TABLE 41. FRANCE PRINTED ELECTRONICS MARKET, BY APPLICATION, 2022-2032 ($MILLION)
- TABLE 42. SPAIN PRINTED ELECTRONICS MARKET, BY TECHNOLOGY, 2022-2032 ($MILLION)
- TABLE 43. SPAIN PRINTED ELECTRONICS MARKET, BY MATERIAL, 2022-2032 ($MILLION)
- TABLE 44. SPAIN PRINTED ELECTRONICS MARKET, BY APPLICATION, 2022-2032 ($MILLION)
- TABLE 45. ITALY PRINTED ELECTRONICS MARKET, BY TECHNOLOGY, 2022-2032 ($MILLION)
- TABLE 46. ITALY PRINTED ELECTRONICS MARKET, BY MATERIAL, 2022-2032 ($MILLION)
- TABLE 47. ITALY PRINTED ELECTRONICS MARKET, BY APPLICATION, 2022-2032 ($MILLION)
- TABLE 48. REST OF EUROPE PRINTED ELECTRONICS MARKET, BY TECHNOLOGY, 2022-2032 ($MILLION)
- TABLE 49. REST OF EUROPE PRINTED ELECTRONICS MARKET, BY MATERIAL, 2022-2032 ($MILLION)
- TABLE 50. REST OF EUROPE PRINTED ELECTRONICS MARKET, BY APPLICATION, 2022-2032 ($MILLION)
- TABLE 51. ASIA-PACIFIC PRINTED ELECTRONICS MARKET, BY TECHNOLOGY, 2022-2032 ($MILLION)
- TABLE 52. ASIA-PACIFIC PRINTED ELECTRONICS MARKET, BY MATERIAL, 2022-2032 ($MILLION)
- TABLE 53. ASIA-PACIFIC PRINTED ELECTRONICS MARKET, BY APPLICATION, 2022-2032 ($MILLION)
- TABLE 54. ASIA-PACIFIC PRINTED ELECTRONICS MARKET, BY COUNTRY, 2022-2032 ($MILLION)
- TABLE 55. CHINA PRINTED ELECTRONICS MARKET, BY TECHNOLOGY, 2022-2032 ($MILLION)
- TABLE 56. CHINA PRINTED ELECTRONICS MARKET, BY MATERIAL, 2022-2032 ($MILLION)
- TABLE 57. CHINA PRINTED ELECTRONICS MARKET, BY APPLICATION, 2022-2032 ($MILLION)
- TABLE 58. JAPAN PRINTED ELECTRONICS MARKET, BY TECHNOLOGY, 2022-2032 ($MILLION)
- TABLE 59. JAPAN PRINTED ELECTRONICS MARKET, BY MATERIAL, 2022-2032 ($MILLION)
- TABLE 60. JAPAN PRINTED ELECTRONICS MARKET, BY APPLICATION, 2022-2032 ($MILLION)
- TABLE 61. INDIA PRINTED ELECTRONICS MARKET, BY TECHNOLOGY, 2022-2032 ($MILLION)
- TABLE 62. INDIA PRINTED ELECTRONICS MARKET, BY MATERIAL, 2022-2032 ($MILLION)
- TABLE 63. INDIA PRINTED ELECTRONICS MARKET, BY APPLICATION, 2022-2032 ($MILLION)
- TABLE 64. SOUTH KOREA PRINTED ELECTRONICS MARKET, BY TECHNOLOGY, 2022-2032 ($MILLION)
- TABLE 65. SOUTH KOREA PRINTED ELECTRONICS MARKET, BY MATERIAL, 2022-2032 ($MILLION)
- TABLE 66. SOUTH KOREA PRINTED ELECTRONICS MARKET, BY APPLICATION, 2022-2032 ($MILLION)
- TABLE 67. AUSTRALIA PRINTED ELECTRONICS MARKET, BY TECHNOLOGY, 2022-2032 ($MILLION)
- TABLE 68. AUSTRALIA PRINTED ELECTRONICS MARKET, BY MATERIAL, 2022-2032 ($MILLION)
- TABLE 69. AUSTRALIA PRINTED ELECTRONICS MARKET, BY APPLICATION, 2022-2032 ($MILLION)
- TABLE 70. REST OF ASIA-PACIFIC PRINTED ELECTRONICS MARKET, BY TECHNOLOGY, 2022-2032 ($MILLION)
- TABLE 71. REST OF ASIA-PACIFIC PRINTED ELECTRONICS MARKET, BY MATERIAL, 2022-2032 ($MILLION)
- TABLE 72. REST OF ASIA-PACIFIC PRINTED ELECTRONICS MARKET, BY APPLICATION, 2022-2032 ($MILLION)
- TABLE 73. LAMEA PRINTED ELECTRONICS MARKET, BY TECHNOLOGY, 2022-2032 ($MILLION)
- TABLE 74. LAMEA PRINTED ELECTRONICS MARKET, BY MATERIAL, 2022-2032 ($MILLION)
- TABLE 75. LAMEA PRINTED ELECTRONICS MARKET, BY APPLICATION, 2022-2032 ($MILLION)
- TABLE 76. LAMEA PRINTED ELECTRONICS MARKET, BY COUNTRY, 2022-2032 ($MILLION)
- TABLE 77. BRAZIL PRINTED ELECTRONICS MARKET, BY TECHNOLOGY, 2022-2032 ($MILLION)
- TABLE 78. BRAZIL PRINTED ELECTRONICS MARKET, BY MATERIAL, 2022-2032 ($MILLION)
- TABLE 79. BRAZIL PRINTED ELECTRONICS MARKET, BY APPLICATION, 2022-2032 ($MILLION)
- TABLE 80. UNITED ARAB EMIRATES PRINTED ELECTRONICS MARKET, BY TECHNOLOGY, 2022-2032 ($MILLION)
- TABLE 81. UNITED ARAB EMIRATES PRINTED ELECTRONICS MARKET, BY MATERIAL, 2022-2032 ($MILLION)
- TABLE 82. UNITED ARAB EMIRATES PRINTED ELECTRONICS MARKET, BY APPLICATION, 2022-2032 ($MILLION)
- TABLE 83. SAUDI ARABIA PRINTED ELECTRONICS MARKET, BY TECHNOLOGY, 2022-2032 ($MILLION)
- TABLE 84. SAUDI ARABIA PRINTED ELECTRONICS MARKET, BY MATERIAL, 2022-2032 ($MILLION)
- TABLE 85. SAUDI ARABIA PRINTED ELECTRONICS MARKET, BY APPLICATION, 2022-2032 ($MILLION)
- TABLE 86. SOUTH AFRICA PRINTED ELECTRONICS MARKET, BY TECHNOLOGY, 2022-2032 ($MILLION)
- TABLE 87. SOUTH AFRICA PRINTED ELECTRONICS MARKET, BY MATERIAL, 2022-2032 ($MILLION)
- TABLE 88. SOUTH AFRICA PRINTED ELECTRONICS MARKET, BY APPLICATION, 2022-2032 ($MILLION)
- TABLE 89. REST OF LAMEA PRINTED ELECTRONICS MARKET, BY TECHNOLOGY, 2022-2032 ($MILLION)
- TABLE 90. REST OF LAMEA PRINTED ELECTRONICS MARKET, BY MATERIAL, 2022-2032 ($MILLION)
- TABLE 91. REST OF LAMEA PRINTED ELECTRONICS MARKET, BY APPLICATION, 2022-2032 ($MILLION)
- TABLE 92. SAMSUNG ELECTRONICS CO., LTD.: KEY EXECUTIVES
- TABLE 93. SAMSUNG ELECTRONICS CO., LTD.: COMPANY SNAPSHOT
- TABLE 94. LG DISPLAY CO., LTD.: KEY EXECUTIVES
- TABLE 95. LG DISPLAY CO., LTD.: COMPANY SNAPSHOT
- TABLE 96. MOLEX LLC: KEY EXECUTIVES
- TABLE 97. MOLEX LLC: COMPANY SNAPSHOT
- TABLE 98. AGFA-GEVAERT GROUP: KEY EXECUTIVES
- TABLE 99. AGFA-GEVAERT GROUP: COMPANY SNAPSHOT
- TABLE 100. PALO ALTO RESEARCH CENTER INCORPORATED (PARC): KEY EXECUTIVES
- TABLE 101. PALO ALTO RESEARCH CENTER INCORPORATED (PARC): COMPANY SNAPSHOT
- TABLE 102. DUPONT (EI) DE NEMOURS: KEY EXECUTIVES
- TABLE 103. DUPONT (EI) DE NEMOURS: COMPANY SNAPSHOT
- TABLE 104. NISSHA CO. LTD: KEY EXECUTIVES
- TABLE 105. NISSHA CO. LTD: COMPANY SNAPSHOT
- TABLE 106. BASF SE: KEY EXECUTIVES
- TABLE 107. BASF SE: COMPANY SNAPSHOT
- TABLE 108. NOVACENTRIX: KEY EXECUTIVES
- TABLE 109. NOVACENTRIX: COMPANY SNAPSHOT
- TABLE 110. E INK HOLDINGS INC.: KEY EXECUTIVES
- TABLE 111. E INK HOLDINGS INC.: COMPANY SNAPSHOT
LIST OF FIGURES
- FIGURE 01. PRINTED ELECTRONICS MARKET, 2022-2032
- FIGURE 02. SEGMENTATION OF PRINTED ELECTRONICS MARKET,2022-2032
- FIGURE 03. TOP IMPACTING FACTORS IN PRINTED ELECTRONICS MARKET
- FIGURE 04. TOP INVESTMENT POCKETS IN PRINTED ELECTRONICS MARKET (2023-2032)
- FIGURE 05. BARGAINING POWER OF SUPPLIERS
- FIGURE 06. BARGAINING POWER OF BUYERS
- FIGURE 07. THREAT OF SUBSTITUTION
- FIGURE 08. THREAT OF SUBSTITUTION
- FIGURE 09. COMPETITIVE RIVALRY
- FIGURE 10. GLOBAL PRINTED ELECTRONICS MARKET:DRIVERS, RESTRAINTS AND OPPORTUNITIES
- FIGURE 11. IMPACT OF KEY REGULATION: PRINTED ELECTRONICS MARKET
- FIGURE 12. PATENT ANALYSIS BY COMPANY
- FIGURE 13. PATENT ANALYSIS BY COUNTRY
- FIGURE 14. REGULATORY GUIDELINES: PRINTED ELECTRONICS MARKET
- FIGURE 15. PRINTED ELECTRONICS MARKET, BY TECHNOLOGY, 2022 AND 2032(%)
- FIGURE 16. COMPARATIVE SHARE ANALYSIS OF PRINTED ELECTRONICS MARKET FOR INKJET PRINTING, BY COUNTRY 2022 AND 2032(%)
- FIGURE 17. COMPARATIVE SHARE ANALYSIS OF PRINTED ELECTRONICS MARKET FOR SCREEN PRINTING, BY COUNTRY 2022 AND 2032(%)
- FIGURE 18. COMPARATIVE SHARE ANALYSIS OF PRINTED ELECTRONICS MARKET FOR GRAVURE PRINTING, BY COUNTRY 2022 AND 2032(%)
- FIGURE 19. COMPARATIVE SHARE ANALYSIS OF PRINTED ELECTRONICS MARKET FOR FLEXOGRAPHIC PRINTING, BY COUNTRY 2022 AND 2032(%)
- FIGURE 20. PRINTED ELECTRONICS MARKET, BY MATERIAL, 2022 AND 2032(%)
- FIGURE 21. COMPARATIVE SHARE ANALYSIS OF PRINTED ELECTRONICS MARKET FOR INKS, BY COUNTRY 2022 AND 2032(%)
- FIGURE 22. COMPARATIVE SHARE ANALYSIS OF PRINTED ELECTRONICS MARKET FOR SUBSTRATES, BY COUNTRY 2022 AND 2032(%)
- FIGURE 23. PRINTED ELECTRONICS MARKET, BY APPLICATION, 2022 AND 2032(%)
- FIGURE 24. COMPARATIVE SHARE ANALYSIS OF PRINTED ELECTRONICS MARKET FOR DISPLAY, BY COUNTRY 2022 AND 2032(%)
- FIGURE 25. COMPARATIVE SHARE ANALYSIS OF PRINTED ELECTRONICS MARKET FOR PHOTOVOLTAIC, BY COUNTRY 2022 AND 2032(%)
- FIGURE 26. COMPARATIVE SHARE ANALYSIS OF PRINTED ELECTRONICS MARKET FOR LIGHTING, BY COUNTRY 2022 AND 2032(%)
- FIGURE 27. COMPARATIVE SHARE ANALYSIS OF PRINTED ELECTRONICS MARKET FOR RFID, BY COUNTRY 2022 AND 2032(%)
- FIGURE 28. COMPARATIVE SHARE ANALYSIS OF PRINTED ELECTRONICS MARKET FOR OTHERS, BY COUNTRY 2022 AND 2032(%)
- FIGURE 29. PRINTED ELECTRONICS MARKET BY REGION, 2022 AND 2032(%)
- FIGURE 30. U.S. PRINTED ELECTRONICS MARKET, 2022-2032 ($MILLION)
- FIGURE 31. CANADA PRINTED ELECTRONICS MARKET, 2022-2032 ($MILLION)
- FIGURE 32. MEXICO PRINTED ELECTRONICS MARKET, 2022-2032 ($MILLION)
- FIGURE 33. GERMANY PRINTED ELECTRONICS MARKET, 2022-2032 ($MILLION)
- FIGURE 34. UK PRINTED ELECTRONICS MARKET, 2022-2032 ($MILLION)
- FIGURE 35. FRANCE PRINTED ELECTRONICS MARKET, 2022-2032 ($MILLION)
- FIGURE 36. SPAIN PRINTED ELECTRONICS MARKET, 2022-2032 ($MILLION)
- FIGURE 37. ITALY PRINTED ELECTRONICS MARKET, 2022-2032 ($MILLION)
- FIGURE 38. REST OF EUROPE PRINTED ELECTRONICS MARKET, 2022-2032 ($MILLION)
- FIGURE 39. CHINA PRINTED ELECTRONICS MARKET, 2022-2032 ($MILLION)
- FIGURE 40. JAPAN PRINTED ELECTRONICS MARKET, 2022-2032 ($MILLION)
- FIGURE 41. INDIA PRINTED ELECTRONICS MARKET, 2022-2032 ($MILLION)
- FIGURE 42. SOUTH KOREA PRINTED ELECTRONICS MARKET, 2022-2032 ($MILLION)
- FIGURE 43. AUSTRALIA PRINTED ELECTRONICS MARKET, 2022-2032 ($MILLION)
- FIGURE 44. REST OF ASIA-PACIFIC PRINTED ELECTRONICS MARKET, 2022-2032 ($MILLION)
- FIGURE 45. BRAZIL PRINTED ELECTRONICS MARKET, 2022-2032 ($MILLION)
- FIGURE 46. UNITED ARAB EMIRATES PRINTED ELECTRONICS MARKET, 2022-2032 ($MILLION)
- FIGURE 47. SAUDI ARABIA PRINTED ELECTRONICS MARKET, 2022-2032 ($MILLION)
- FIGURE 48. SOUTH AFRICA PRINTED ELECTRONICS MARKET, 2022-2032 ($MILLION)
- FIGURE 49. REST OF LAMEA PRINTED ELECTRONICS MARKET, 2022-2032 ($MILLION)
- FIGURE 50. PRODUCT MAPPING OF TOP 10 PLAYERS
- FIGURE 51. COMPETITIVE DASHBOARD
- FIGURE 52. COMPETITIVE HEATMAP: PRINTED ELECTRONICS MARKET
- FIGURE 53. TOP PLAYER POSITIONING, 2022
 全球印刷電子市場規模、佔有率、成長分析(按印刷技術、材料、組件分類)- 產業預測,2024-2031 年
 全球汽車印刷電子市場研究報告 - 2024 年至 2032 年產業分析、規模、佔有率、成長、趨勢與預測
 汽車印刷電子市場(技術:柔印、噴墨印刷、網版印刷、膠印等;材料:基材和油墨)- 2023-2031 年全球產業分析、規模、佔有率、成長、趨勢和預測
 印刷電子材料市場:按材料、最終用途分類 - 2024-2030 年全球預測
 印刷電子市場:2023-2028 年全球產業趨勢、佔有率、規模、成長、機會與預測
 印刷電子市場 - 2018-2028 年全球產業規模、佔有率、趨勢、機會與預測,按印刷製程、材料、設備、最終用戶、地區、競爭細分
 印刷電子市場(技術:柔印、噴墨印刷、網版印刷、膠印等;材料:基材和油墨)- 2023-2031 年全球產業分析、規模、佔有率、成長、趨勢和預測
 SMT鋼網印刷機的全球市場:2018-2029年
 全球印刷電子市場
 印刷電子市場:依技術(3D 列印、柔版印刷、凹版印刷)、材料(油墨、基板)、產業、用途分類 - 2023-2030 年全球預測