


 |
市場調查報告書
商品編碼
1414755
AdBlue 市場:按方法、按應用分類:2023-2032 年全球機會分析與產業預測Adblue Market By Method (Pre Combustion, Post Combustion), By Application (Commercial Vehicles, Non road mobile machines, Cars and passenger Vehicles, Railways, Others): Global Opportunity Analysis and Industry Forecast, 2023-2032 |
||||||
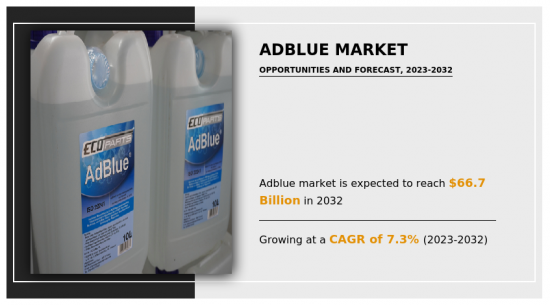
2022 年 AdBlue 市值為 331 億美元,預計到 2032 年將達到 667 億美元,2023 年至 2032 年複合年成長率為 7.3%。
包括卡車和巴士在內的商用車車隊的擴張預計將成為 AdBlue 市場的主要動力。這種成長是由於多種因素造成的。隨著全球經濟持續擴張,貨物和人員運輸的需求迅速增加,因此有必要增加我們持有中的商用車數量。世界各國政府正在實施嚴格的排放氣體法規,例如:
1 嚴格的排放氣體法規(例如歐洲的歐盟 VI 和美國的EPA 標準)已經實施,並且強制使用 AdBlue 以減少這些車輛排放的氮氧化物 (NOx)。因此,車隊營運商擴大採用選擇性催化還原 (SCR) 技術,該技術依靠 AdBlue 來減少氮氧化物,以遵守這些法規。因此,隨著商用車行業的不斷擴張、遵守環境法規並為更清潔、更永續的交通生態系統做出貢獻,AdBlue 市場將持續成長。
缺乏 AdBlue(柴油引擎廢氣處理液 (DEF))分配和加註基礎設施是 AdBlue 市場的主要抑制因素。 AdBlue 是減少配備選擇性催化還原 (SCR) 系統的柴油車氮氧化物 (NOx)排放的重要成分。然而,AdBlue 加註站和分銷網路的可用性有限阻礙了 AdBlue 的普及。基礎設施的缺乏可能會妨礙駕駛者的便利性和可及性,並阻止他們使用 AdBlue,這反過來又可能對 AdBlue 市場產生負面影響。在缺乏 AdBlue 基礎設施的地區,汽車業者可能難以採購和補充 AdBlue,這可能會導致營運中斷。此外,基礎設施的缺乏導致 AdBlue 供應商的運輸成本較高,而這些成本可能轉嫁給最終用戶,使 AdBlue 成為成本效益較低的排放氣體解決方案。
環保意識的增強對汽車產業有直接影響,尤其是柴油引擎汽車,它是氮氧化物(NOx)排放的主要來源。 AdBlue 是一種用於選擇性催化還原 (SCR) 系統的基於尿素的解決方案,已成為減少這些排放並滿足嚴格的排放標準和法規的重要元素。隨著消費者需要更清潔、更永續的交通選擇,AdBlue 在滿足這些需求方面發揮著至關重要的作用。 AdBlue 不僅可以減少有害的氮氧化物排放,而且還提供了一種環保的替代品,使其成為具有環保意識的消費者的一個有吸引力的選擇。因此,由於環保意識的提高和消費者對環保技術的需求,AdBlue 市場將帶來利潤豐厚的機會。
目錄
第1章簡介
第 2 章執行摘要
第3章市場概況
- 市場定義和範圍
- 主要發現
- 影響因素
- 主要投資機會
- 波特五力分析
- 市場動態
- 促進因素
- 擴大商用車車隊,包括卡車和公車
- 增加政府獎勵
- 抑制因素
- 缺乏基礎設施
- 機會
- 環保意識不斷增強,消費者對環保技術的需求不斷提高
- 促進因素
- 價值鏈分析
- 關鍵監管分析
- 專利形勢
- 監管指引
第 4 章 AdBlue 市場:依方法分類
- 概述
- 預燃燒
- 後燃燒
第5章 AdBlue 市場:依應用分類
- 概述
- 商用車
- 非道路移動機械
- 汽車/小客車
- 鐵路
- 其他
第6章 AdBlue 市場:按地區
- 概述
- 北美洲
- 美國
- 加拿大
- 墨西哥
- 歐洲
- 德國
- 英國
- 法國
- 西班牙
- 義大利
- 其他
- 亞太地區
- 中國
- 印度
- 日本
- 韓國
- 澳洲
- 其他
- 拉丁美洲/中東/非洲
- 巴西
- 沙烏地阿拉伯
- 南非
- 其他
第7章 競爭形勢
- 介紹
- 關鍵成功策略
- 10家主要企業產品圖譜
- 競爭對手儀表板
- 競爭熱圖
- 2022年主要企業定位
第8章 公司簡介
- BASF SE
- CrossChem Limited
- Yara
- Shell plc
- Nissan Chemical Corporation
- TotalEnergies
- Cummins Inc.
- Mitsui Chemicals India Pvt. Ltd.
- CF Industries Holdings, Inc.
- Bharat Petroleum Corporation Limited
According to a new report published by Allied Market Research, titled, "Adblue Market," The adblue market was valued at $33.1 billion in 2022, and is estimated to reach $66.7 billion by 2032, growing at a CAGR of 7.3% from 2023 to 2032.
The expansion of commercial vehicle fleets, including trucks and buses, is poised to be a significant driver for the Adblue market. This growth is attributed to several factors. The demand for the transportation of goods and people has surged as the global economy continues to expand, necessitating a larger fleet of commercial vehicles. Governments globally are implementing stringent emissions regulations, such as Euro VI in Europe and EPA standards in the U.S., mandating the use of Adblue to reduce nitrogen oxide (NOx) emissions from these vehicles. Consequently, fleet operators are increasingly adopting Selective Catalytic Reduction (SCR) technology, which relies on Adblue for NOx reduction, to comply with these regulations. As a result, the Adblue market is set to experience sustained growth as the commercial vehicle sector continues to expand and adhere to environmental mandates, contributing to a cleaner and more sustainable transportation ecosystem.
The lack of infrastructure for Adblue, or diesel exhaust fluid (DEF), distribution and refilling poses a significant restraint on the Adblue market. Adblue is an essential component in reducing nitrogen oxide (NOx) emissions from diesel vehicles equipped with selective catalytic reduction (SCR) systems. However, the limited availability of Adblue refilling stations and distribution networks can impede its widespread adoption. This deficiency in infrastructure hampers the convenience and accessibility for vehicle operators, potentially deterring them from using Adblue and, in turn, negatively impacting the Adblue market. In regions where Adblue infrastructure is lacking, vehicle operators may face difficulties in sourcing and refilling Adblue, leading to operational disruptions. In addition, the lack of infrastructure can result in increased transportation costs for Adblue suppliers, which may then be passed on to end-users, making it a less cost-effective emissions reduction solution.
Increased environmental awareness has a direct impact on the automotive industry, particularly diesel-powered vehicles, which are a significant source of nitrogen oxide (NOx) emissions. Adblue, a urea-based solution used in selective catalytic reduction (SCR) systems, has become a vital component for mitigating these emissions and aligning with stringent emission standards and regulations. Adblue plays a pivotal role in meeting these demands as consumers seek cleaner and more sustainable transportation options. It not only aids in reducing harmful NOx emissions but also provides an eco-friendly alternative, making it an attractive choice for environmentally conscious consumers. Thus, the Adblue market is poised to witness lucrative opportunities due to the growing environmental consciousness and consumer demand for eco-friendly technologies.
The Adblue market is segmented on the basis of method, application, and region. By method, the market is divided into pre-combustion and post-combustion. On the basis of the application, the market is categorized into commercial vehicles, non-road mobile machines, cars and passenger vehicles, railways, and others. region-wise, the market is studied across North America, Europe, Asia-Pacific, and LAMEA.
The major players operating in the global Adblue market are BASF SE, CrossChem, Yara, Shell plc, Nissan Chemical Corporation, TotalEnergies, Cummins Inc., Mitsui Chemicals India Pvt. Ltd., CF Industries Holdings, Inc. and Bharat Petroleum Corporation Ltd. Other players include Chevron, Exxon Mobil Corporation, Sinopec, Mitsubishi Chemical, EcoBlue, Hyundai Xteer, TerraCair and BlueDEF.
Key Benefits For Stakeholders
- This report provides a quantitative analysis of the market segments, current trends, estimations, and dynamics of the adblue market analysis from 2022 to 2032 to identify the prevailing adblue market opportunities.
- The market research is offered along with information related to key drivers, restraints, and opportunities.
- Porter's five forces analysis highlights the potency of buyers and suppliers to enable stakeholders make profit-oriented business decisions and strengthen their supplier-buyer network.
- In-depth analysis of the adblue market segmentation assists to determine the prevailing market opportunities.
- Major countries in each region are mapped according to their revenue contribution to the global market.
- Market player positioning facilitates benchmarking and provides a clear understanding of the present position of the market players.
- The report includes the analysis of the regional as well as global adblue market trends, key players, market segments, application areas, and market growth strategies.
Additional benefits you will get with this purchase are:
- Quarterly Update and* (only available with a corporate license, on listed price)
- 5 additional Company Profile of client Choice pre- or Post-purchase, as a free update.
- Free Upcoming Version on the Purchase of Five and Enterprise User License.
- 16 analyst hours of support* (post-purchase, if you find additional data requirements upon review of the report, you may receive support amounting to 16 analyst hours to solve questions, and post-sale queries)
- 15% Free Customization* (in case the scope or segment of the report does not match your requirements, 15% is equivalent to 3 working days of free work, applicable once)
- Free data Pack on the Five and Enterprise User License. (Excel version of the report)
- Free Updated report if the report is 6-12 months old or older.
- 24-hour priority response*
- Free Industry updates and white papers.
Possible Customization with this report (with additional cost and timeline, please talk to the sales executive to know more)
- Analysis of raw material in a product (by %)
- Manufacturing Capacity
- Product Benchmarking / Product specification and applications
- Supply Chain Analysis & Vendor Margins
- Upcoming/New Entrant by Regions
- Technology Trend Analysis
- Consumer Preference and Product Specifications
- Go To Market Strategy
- Regulatory Guidelines
- Additional company profiles with specific to client's interest
- Additional country or region analysis- market size and forecast
- Average Selling Price Analysis / Price Point Analysis
- Criss-cross segment analysis- market size and forecast
- Expanded list for Company Profiles
- Import Export Analysis/Data
- Key player details (including location, contact details, supplier/vendor network etc. in excel format)
- List of customers/consumers/raw material suppliers- value chain analysis
- Product Consumption Analysis
- SWOT Analysis
Key Market Segments
By Method
- Pre Combustion
- Post Combustion
By Application
- Commercial Vehicles
- Non road mobile machines
- Cars and passenger Vehicles
- Railways
- Others
By Region
- North America
- U.S.
- Canada
- Mexico
- Europe
- Germany
- UK
- France
- Spain
- Italy
- Rest of Europe
- Asia-Pacific
- China
- India
- Japan
- South Korea
- Australia
- Rest of Asia-Pacific
- LAMEA
- Brazil
- Saudi Arabia
- South Africa
- Rest of LAMEA
Key Market Players:
- BASF SE
- Shell plc
- TotalEnergies
- Cummins Inc.
- Mitsui Chemicals India Pvt. Ltd.
- Yara
- Nissan Chemical Corporation
- CF Industries Holdings, Inc.
- CrossChem Limited
- Bharat Petroleum Corporation Limited
TABLE OF CONTENTS
CHAPTER 1: INTRODUCTION
- 1.1. Report description
- 1.2. Key market segments
- 1.3. Key benefits to the stakeholders
- 1.4. Research methodology
- 1.4.1. Primary research
- 1.4.2. Secondary research
- 1.4.3. Analyst tools and models
CHAPTER 2: EXECUTIVE SUMMARY
- 2.1. CXO Perspective
CHAPTER 3: MARKET OVERVIEW
- 3.1. Market definition and scope
- 3.2. Key findings
- 3.2.1. Top impacting factors
- 3.2.2. Top investment pockets
- 3.3. Porter's five forces analysis
- 3.3.1. Moderate bargaining power of suppliers
- 3.3.2. Moderate threat of new entrants
- 3.3.3. Moderate threat of substitutes
- 3.3.4. Moderate intensity of rivalry
- 3.3.5. Moderate bargaining power of buyers
- 3.4. Market dynamics
- 3.4.1. Drivers
- 3.4.1.1. Expanding commercial vehicle fleets, including trucks and buses
- 3.4.1.2. Increasing government incentives
- 3.4.2. Restraints
- 3.4.2.1. Lack of infrastructure
- 3.4.3. Opportunities
- 3.4.3.1. The increasing environmental awareness and consumer demand for eco-friendly technologies
- 3.4.1. Drivers
- 3.5. Value Chain Analysis
- 3.6. Key Regulation Analysis
- 3.7. Patent Landscape
- 3.8. Regulatory Guidelines
CHAPTER 4: ADBLUE MARKET, BY METHOD
- 4.1. Overview
- 4.1.1. Market size and forecast
- 4.2. Pre Combustion
- 4.2.1. Key market trends, growth factors and opportunities
- 4.2.2. Market size and forecast, by region
- 4.2.3. Market share analysis by country
- 4.3. Post Combustion
- 4.3.1. Key market trends, growth factors and opportunities
- 4.3.2. Market size and forecast, by region
- 4.3.3. Market share analysis by country
CHAPTER 5: ADBLUE MARKET, BY APPLICATION
- 5.1. Overview
- 5.1.1. Market size and forecast
- 5.2. Commercial Vehicles
- 5.2.1. Key market trends, growth factors and opportunities
- 5.2.2. Market size and forecast, by region
- 5.2.3. Market share analysis by country
- 5.3. Non road mobile machines
- 5.3.1. Key market trends, growth factors and opportunities
- 5.3.2. Market size and forecast, by region
- 5.3.3. Market share analysis by country
- 5.4. Cars and passenger Vehicles
- 5.4.1. Key market trends, growth factors and opportunities
- 5.4.2. Market size and forecast, by region
- 5.4.3. Market share analysis by country
- 5.5. Railways
- 5.5.1. Key market trends, growth factors and opportunities
- 5.5.2. Market size and forecast, by region
- 5.5.3. Market share analysis by country
- 5.6. Others
- 5.6.1. Key market trends, growth factors and opportunities
- 5.6.2. Market size and forecast, by region
- 5.6.3. Market share analysis by country
CHAPTER 6: ADBLUE MARKET, BY REGION
- 6.1. Overview
- 6.1.1. Market size and forecast By Region
- 6.2. North America
- 6.2.1. Key market trends, growth factors and opportunities
- 6.2.2. Market size and forecast, by Method
- 6.2.3. Market size and forecast, by Application
- 6.2.4. Market size and forecast, by country
- 6.2.4.1. U.S.
- 6.2.4.1.1. Market size and forecast, by Method
- 6.2.4.1.2. Market size and forecast, by Application
- 6.2.4.2. Canada
- 6.2.4.2.1. Market size and forecast, by Method
- 6.2.4.2.2. Market size and forecast, by Application
- 6.2.4.3. Mexico
- 6.2.4.3.1. Market size and forecast, by Method
- 6.2.4.3.2. Market size and forecast, by Application
- 6.3. Europe
- 6.3.1. Key market trends, growth factors and opportunities
- 6.3.2. Market size and forecast, by Method
- 6.3.3. Market size and forecast, by Application
- 6.3.4. Market size and forecast, by country
- 6.3.4.1. Germany
- 6.3.4.1.1. Market size and forecast, by Method
- 6.3.4.1.2. Market size and forecast, by Application
- 6.3.4.2. UK
- 6.3.4.2.1. Market size and forecast, by Method
- 6.3.4.2.2. Market size and forecast, by Application
- 6.3.4.3. France
- 6.3.4.3.1. Market size and forecast, by Method
- 6.3.4.3.2. Market size and forecast, by Application
- 6.3.4.4. Spain
- 6.3.4.4.1. Market size and forecast, by Method
- 6.3.4.4.2. Market size and forecast, by Application
- 6.3.4.5. Italy
- 6.3.4.5.1. Market size and forecast, by Method
- 6.3.4.5.2. Market size and forecast, by Application
- 6.3.4.6. Rest of Europe
- 6.3.4.6.1. Market size and forecast, by Method
- 6.3.4.6.2. Market size and forecast, by Application
- 6.4. Asia-Pacific
- 6.4.1. Key market trends, growth factors and opportunities
- 6.4.2. Market size and forecast, by Method
- 6.4.3. Market size and forecast, by Application
- 6.4.4. Market size and forecast, by country
- 6.4.4.1. China
- 6.4.4.1.1. Market size and forecast, by Method
- 6.4.4.1.2. Market size and forecast, by Application
- 6.4.4.2. India
- 6.4.4.2.1. Market size and forecast, by Method
- 6.4.4.2.2. Market size and forecast, by Application
- 6.4.4.3. Japan
- 6.4.4.3.1. Market size and forecast, by Method
- 6.4.4.3.2. Market size and forecast, by Application
- 6.4.4.4. South Korea
- 6.4.4.4.1. Market size and forecast, by Method
- 6.4.4.4.2. Market size and forecast, by Application
- 6.4.4.5. Australia
- 6.4.4.5.1. Market size and forecast, by Method
- 6.4.4.5.2. Market size and forecast, by Application
- 6.4.4.6. Rest of Asia-Pacific
- 6.4.4.6.1. Market size and forecast, by Method
- 6.4.4.6.2. Market size and forecast, by Application
- 6.5. LAMEA
- 6.5.1. Key market trends, growth factors and opportunities
- 6.5.2. Market size and forecast, by Method
- 6.5.3. Market size and forecast, by Application
- 6.5.4. Market size and forecast, by country
- 6.5.4.1. Brazil
- 6.5.4.1.1. Market size and forecast, by Method
- 6.5.4.1.2. Market size and forecast, by Application
- 6.5.4.2. Saudi Arabia
- 6.5.4.2.1. Market size and forecast, by Method
- 6.5.4.2.2. Market size and forecast, by Application
- 6.5.4.3. South Africa
- 6.5.4.3.1. Market size and forecast, by Method
- 6.5.4.3.2. Market size and forecast, by Application
- 6.5.4.4. Rest of LAMEA
- 6.5.4.4.1. Market size and forecast, by Method
- 6.5.4.4.2. Market size and forecast, by Application
CHAPTER 7: COMPETITIVE LANDSCAPE
- 7.1. Introduction
- 7.2. Top winning strategies
- 7.3. Product mapping of top 10 player
- 7.4. Competitive dashboard
- 7.5. Competitive heatmap
- 7.6. Top player positioning, 2022
CHAPTER 8: COMPANY PROFILES
- 8.1. BASF SE
- 8.1.1. Company overview
- 8.1.2. Key executives
- 8.1.3. Company snapshot
- 8.1.4. Operating business segments
- 8.1.5. Product portfolio
- 8.1.6. Business performance
- 8.2. CrossChem Limited
- 8.2.1. Company overview
- 8.2.2. Key executives
- 8.2.3. Company snapshot
- 8.2.4. Operating business segments
- 8.2.5. Product portfolio
- 8.2.6. Key strategic moves and developments
- 8.3. Yara
- 8.3.1. Company overview
- 8.3.2. Key executives
- 8.3.3. Company snapshot
- 8.3.4. Operating business segments
- 8.3.5. Product portfolio
- 8.3.6. Business performance
- 8.4. Shell plc
- 8.4.1. Company overview
- 8.4.2. Key executives
- 8.4.3. Company snapshot
- 8.4.4. Operating business segments
- 8.4.5. Product portfolio
- 8.4.6. Business performance
- 8.5. Nissan Chemical Corporation
- 8.5.1. Company overview
- 8.5.2. Key executives
- 8.5.3. Company snapshot
- 8.5.4. Operating business segments
- 8.5.5. Product portfolio
- 8.5.6. Business performance
- 8.6. TotalEnergies
- 8.6.1. Company overview
- 8.6.2. Key executives
- 8.6.3. Company snapshot
- 8.6.4. Operating business segments
- 8.6.5. Product portfolio
- 8.6.6. Business performance
- 8.7. Cummins Inc.
- 8.7.1. Company overview
- 8.7.2. Key executives
- 8.7.3. Company snapshot
- 8.7.4. Operating business segments
- 8.7.5. Product portfolio
- 8.7.6. Business performance
- 8.7.7. Key strategic moves and developments
- 8.8. Mitsui Chemicals India Pvt. Ltd.
- 8.8.1. Company overview
- 8.8.2. Key executives
- 8.8.3. Company snapshot
- 8.8.4. Operating business segments
- 8.8.5. Product portfolio
- 8.9. CF Industries Holdings, Inc.
- 8.9.1. Company overview
- 8.9.2. Key executives
- 8.9.3. Company snapshot
- 8.9.4. Operating business segments
- 8.9.5. Product portfolio
- 8.9.6. Business performance
- 8.10. Bharat Petroleum Corporation Limited
- 8.10.1. Company overview
- 8.10.2. Key executives
- 8.10.3. Company snapshot
- 8.10.4. Operating business segments
- 8.10.5. Product portfolio
- 8.10.6. Business performance
LIST OF TABLES
- TABLE 01. GLOBAL ADBLUE MARKET, BY METHOD, 2022-2032 ($MILLION)
- TABLE 02. ADBLUE MARKET FOR PRE COMBUSTION, BY REGION, 2022-2032 ($MILLION)
- TABLE 03. ADBLUE MARKET FOR POST COMBUSTION, BY REGION, 2022-2032 ($MILLION)
- TABLE 04. GLOBAL ADBLUE MARKET, BY APPLICATION, 2022-2032 ($MILLION)
- TABLE 05. ADBLUE MARKET FOR COMMERCIAL VEHICLES, BY REGION, 2022-2032 ($MILLION)
- TABLE 06. ADBLUE MARKET FOR NON ROAD MOBILE MACHINES, BY REGION, 2022-2032 ($MILLION)
- TABLE 07. ADBLUE MARKET FOR CARS AND PASSENGER VEHICLES, BY REGION, 2022-2032 ($MILLION)
- TABLE 08. ADBLUE MARKET FOR RAILWAYS, BY REGION, 2022-2032 ($MILLION)
- TABLE 09. ADBLUE MARKET FOR OTHERS, BY REGION, 2022-2032 ($MILLION)
- TABLE 10. ADBLUE MARKET, BY REGION, 2022-2032 ($MILLION)
- TABLE 11. NORTH AMERICA ADBLUE MARKET, BY METHOD, 2022-2032 ($MILLION)
- TABLE 12. NORTH AMERICA ADBLUE MARKET, BY APPLICATION, 2022-2032 ($MILLION)
- TABLE 13. NORTH AMERICA ADBLUE MARKET, BY COUNTRY, 2022-2032 ($MILLION)
- TABLE 14. U.S. ADBLUE MARKET, BY METHOD, 2022-2032 ($MILLION)
- TABLE 15. U.S. ADBLUE MARKET, BY APPLICATION, 2022-2032 ($MILLION)
- TABLE 16. CANADA ADBLUE MARKET, BY METHOD, 2022-2032 ($MILLION)
- TABLE 17. CANADA ADBLUE MARKET, BY APPLICATION, 2022-2032 ($MILLION)
- TABLE 18. MEXICO ADBLUE MARKET, BY METHOD, 2022-2032 ($MILLION)
- TABLE 19. MEXICO ADBLUE MARKET, BY APPLICATION, 2022-2032 ($MILLION)
- TABLE 20. EUROPE ADBLUE MARKET, BY METHOD, 2022-2032 ($MILLION)
- TABLE 21. EUROPE ADBLUE MARKET, BY APPLICATION, 2022-2032 ($MILLION)
- TABLE 22. EUROPE ADBLUE MARKET, BY COUNTRY, 2022-2032 ($MILLION)
- TABLE 23. GERMANY ADBLUE MARKET, BY METHOD, 2022-2032 ($MILLION)
- TABLE 24. GERMANY ADBLUE MARKET, BY APPLICATION, 2022-2032 ($MILLION)
- TABLE 25. UK ADBLUE MARKET, BY METHOD, 2022-2032 ($MILLION)
- TABLE 26. UK ADBLUE MARKET, BY APPLICATION, 2022-2032 ($MILLION)
- TABLE 27. FRANCE ADBLUE MARKET, BY METHOD, 2022-2032 ($MILLION)
- TABLE 28. FRANCE ADBLUE MARKET, BY APPLICATION, 2022-2032 ($MILLION)
- TABLE 29. SPAIN ADBLUE MARKET, BY METHOD, 2022-2032 ($MILLION)
- TABLE 30. SPAIN ADBLUE MARKET, BY APPLICATION, 2022-2032 ($MILLION)
- TABLE 31. ITALY ADBLUE MARKET, BY METHOD, 2022-2032 ($MILLION)
- TABLE 32. ITALY ADBLUE MARKET, BY APPLICATION, 2022-2032 ($MILLION)
- TABLE 33. REST OF EUROPE ADBLUE MARKET, BY METHOD, 2022-2032 ($MILLION)
- TABLE 34. REST OF EUROPE ADBLUE MARKET, BY APPLICATION, 2022-2032 ($MILLION)
- TABLE 35. ASIA-PACIFIC ADBLUE MARKET, BY METHOD, 2022-2032 ($MILLION)
- TABLE 36. ASIA-PACIFIC ADBLUE MARKET, BY APPLICATION, 2022-2032 ($MILLION)
- TABLE 37. ASIA-PACIFIC ADBLUE MARKET, BY COUNTRY, 2022-2032 ($MILLION)
- TABLE 38. CHINA ADBLUE MARKET, BY METHOD, 2022-2032 ($MILLION)
- TABLE 39. CHINA ADBLUE MARKET, BY APPLICATION, 2022-2032 ($MILLION)
- TABLE 40. INDIA ADBLUE MARKET, BY METHOD, 2022-2032 ($MILLION)
- TABLE 41. INDIA ADBLUE MARKET, BY APPLICATION, 2022-2032 ($MILLION)
- TABLE 42. JAPAN ADBLUE MARKET, BY METHOD, 2022-2032 ($MILLION)
- TABLE 43. JAPAN ADBLUE MARKET, BY APPLICATION, 2022-2032 ($MILLION)
- TABLE 44. SOUTH KOREA ADBLUE MARKET, BY METHOD, 2022-2032 ($MILLION)
- TABLE 45. SOUTH KOREA ADBLUE MARKET, BY APPLICATION, 2022-2032 ($MILLION)
- TABLE 46. AUSTRALIA ADBLUE MARKET, BY METHOD, 2022-2032 ($MILLION)
- TABLE 47. AUSTRALIA ADBLUE MARKET, BY APPLICATION, 2022-2032 ($MILLION)
- TABLE 48. REST OF ASIA-PACIFIC ADBLUE MARKET, BY METHOD, 2022-2032 ($MILLION)
- TABLE 49. REST OF ASIA-PACIFIC ADBLUE MARKET, BY APPLICATION, 2022-2032 ($MILLION)
- TABLE 50. LAMEA ADBLUE MARKET, BY METHOD, 2022-2032 ($MILLION)
- TABLE 51. LAMEA ADBLUE MARKET, BY APPLICATION, 2022-2032 ($MILLION)
- TABLE 52. LAMEA ADBLUE MARKET, BY COUNTRY, 2022-2032 ($MILLION)
- TABLE 53. BRAZIL ADBLUE MARKET, BY METHOD, 2022-2032 ($MILLION)
- TABLE 54. BRAZIL ADBLUE MARKET, BY APPLICATION, 2022-2032 ($MILLION)
- TABLE 55. SAUDI ARABIA ADBLUE MARKET, BY METHOD, 2022-2032 ($MILLION)
- TABLE 56. SAUDI ARABIA ADBLUE MARKET, BY APPLICATION, 2022-2032 ($MILLION)
- TABLE 57. SOUTH AFRICA ADBLUE MARKET, BY METHOD, 2022-2032 ($MILLION)
- TABLE 58. SOUTH AFRICA ADBLUE MARKET, BY APPLICATION, 2022-2032 ($MILLION)
- TABLE 59. REST OF LAMEA ADBLUE MARKET, BY METHOD, 2022-2032 ($MILLION)
- TABLE 60. REST OF LAMEA ADBLUE MARKET, BY APPLICATION, 2022-2032 ($MILLION)
- TABLE 61. BASF SE: KEY EXECUTIVES
- TABLE 62. BASF SE: COMPANY SNAPSHOT
- TABLE 63. BASF SE: PRODUCT SEGMENTS
- TABLE 64. BASF SE: PRODUCT PORTFOLIO
- TABLE 65. CROSSCHEM LIMITED: KEY EXECUTIVES
- TABLE 66. CROSSCHEM LIMITED: COMPANY SNAPSHOT
- TABLE 67. CROSSCHEM LIMITED: PRODUCT SEGMENTS
- TABLE 68. CROSSCHEM LIMITED: PRODUCT PORTFOLIO
- TABLE 69. CROSSCHEM LIMITED: KEY STRATERGIES
- TABLE 70. YARA: KEY EXECUTIVES
- TABLE 71. YARA: COMPANY SNAPSHOT
- TABLE 72. YARA: PRODUCT SEGMENTS
- TABLE 73. YARA: PRODUCT PORTFOLIO
- TABLE 74. SHELL PLC: KEY EXECUTIVES
- TABLE 75. SHELL PLC: COMPANY SNAPSHOT
- TABLE 76. SHELL PLC: PRODUCT SEGMENTS
- TABLE 77. SHELL PLC: PRODUCT PORTFOLIO
- TABLE 78. NISSAN CHEMICAL CORPORATION: KEY EXECUTIVES
- TABLE 79. NISSAN CHEMICAL CORPORATION: COMPANY SNAPSHOT
- TABLE 80. NISSAN CHEMICAL CORPORATION: PRODUCT SEGMENTS
- TABLE 81. NISSAN CHEMICAL CORPORATION: PRODUCT PORTFOLIO
- TABLE 82. TOTALENERGIES: KEY EXECUTIVES
- TABLE 83. TOTALENERGIES: COMPANY SNAPSHOT
- TABLE 84. TOTALENERGIES: PRODUCT SEGMENTS
- TABLE 85. TOTALENERGIES: PRODUCT PORTFOLIO
- TABLE 86. CUMMINS INC.: KEY EXECUTIVES
- TABLE 87. CUMMINS INC.: COMPANY SNAPSHOT
- TABLE 88. CUMMINS INC.: SERVICE SEGMENTS
- TABLE 89. CUMMINS INC.: PRODUCT PORTFOLIO
- TABLE 90. CUMMINS INC.: KEY STRATERGIES
- TABLE 91. MITSUI CHEMICALS INDIA PVT. LTD.: KEY EXECUTIVES
- TABLE 92. MITSUI CHEMICALS INDIA PVT. LTD.: COMPANY SNAPSHOT
- TABLE 93. MITSUI CHEMICALS INDIA PVT. LTD.: PRODUCT SEGMENTS
- TABLE 94. MITSUI CHEMICALS INDIA PVT. LTD.: PRODUCT PORTFOLIO
- TABLE 95. CF INDUSTRIES HOLDINGS, INC.: KEY EXECUTIVES
- TABLE 96. CF INDUSTRIES HOLDINGS, INC.: COMPANY SNAPSHOT
- TABLE 97. CF INDUSTRIES HOLDINGS, INC.: PRODUCT SEGMENTS
- TABLE 98. CF INDUSTRIES HOLDINGS, INC.: PRODUCT PORTFOLIO
- TABLE 99. BHARAT PETROLEUM CORPORATION LIMITED: KEY EXECUTIVES
- TABLE 100. BHARAT PETROLEUM CORPORATION LIMITED: COMPANY SNAPSHOT
- TABLE 101. BHARAT PETROLEUM CORPORATION LIMITED: PRODUCT SEGMENTS
- TABLE 102. BHARAT PETROLEUM CORPORATION LIMITED: PRODUCT PORTFOLIO
LIST OF FIGURES
- FIGURE 01. ADBLUE MARKET, 2022-2032
- FIGURE 02. SEGMENTATION OF ADBLUE MARKET,2022-2032
- FIGURE 03. TOP IMPACTING FACTORS IN ADBLUE MARKET (2022 TO 2032)
- FIGURE 04. TOP INVESTMENT POCKETS IN ADBLUE MARKET (2023-2032)
- FIGURE 05. MODERATE BARGAINING POWER OF SUPPLIERS
- FIGURE 06. MODERATE THREAT OF NEW ENTRANTS
- FIGURE 07. MODERATE THREAT OF SUBSTITUTES
- FIGURE 08. MODERATE INTENSITY OF RIVALRY
- FIGURE 09. MODERATE BARGAINING POWER OF BUYERS
- FIGURE 10. GLOBAL ADBLUE MARKET:DRIVERS, RESTRAINTS AND OPPORTUNITIES
- FIGURE 11. IMPACT OF KEY REGULATION: ADBLUE MARKET
- FIGURE 12. PATENT ANALYSIS BY COMPANY
- FIGURE 13. PATENT ANALYSIS BY COUNTRY
- FIGURE 14. REGULATORY GUIDELINES: ADBLUE MARKET
- FIGURE 15. ADBLUE MARKET, BY METHOD, 2022 AND 2032(%)
- FIGURE 16. COMPARATIVE SHARE ANALYSIS OF ADBLUE MARKET FOR PRE COMBUSTION, BY COUNTRY 2022 AND 2032(%)
- FIGURE 17. COMPARATIVE SHARE ANALYSIS OF ADBLUE MARKET FOR POST COMBUSTION, BY COUNTRY 2022 AND 2032(%)
- FIGURE 18. ADBLUE MARKET, BY APPLICATION, 2022 AND 2032(%)
- FIGURE 19. COMPARATIVE SHARE ANALYSIS OF ADBLUE MARKET FOR COMMERCIAL VEHICLES, BY COUNTRY 2022 AND 2032(%)
- FIGURE 20. COMPARATIVE SHARE ANALYSIS OF ADBLUE MARKET FOR NON ROAD MOBILE MACHINES, BY COUNTRY 2022 AND 2032(%)
- FIGURE 21. COMPARATIVE SHARE ANALYSIS OF ADBLUE MARKET FOR CARS AND PASSENGER VEHICLES, BY COUNTRY 2022 AND 2032(%)
- FIGURE 22. COMPARATIVE SHARE ANALYSIS OF ADBLUE MARKET FOR RAILWAYS, BY COUNTRY 2022 AND 2032(%)
- FIGURE 23. COMPARATIVE SHARE ANALYSIS OF ADBLUE MARKET FOR OTHERS, BY COUNTRY 2022 AND 2032(%)
- FIGURE 24. ADBLUE MARKET BY REGION, 2022 AND 2032(%)
- FIGURE 25. U.S. ADBLUE MARKET, 2022-2032 ($MILLION)
- FIGURE 26. CANADA ADBLUE MARKET, 2022-2032 ($MILLION)
- FIGURE 27. MEXICO ADBLUE MARKET, 2022-2032 ($MILLION)
- FIGURE 28. GERMANY ADBLUE MARKET, 2022-2032 ($MILLION)
- FIGURE 29. UK ADBLUE MARKET, 2022-2032 ($MILLION)
- FIGURE 30. FRANCE ADBLUE MARKET, 2022-2032 ($MILLION)
- FIGURE 31. SPAIN ADBLUE MARKET, 2022-2032 ($MILLION)
- FIGURE 32. ITALY ADBLUE MARKET, 2022-2032 ($MILLION)
- FIGURE 33. REST OF EUROPE ADBLUE MARKET, 2022-2032 ($MILLION)
- FIGURE 34. CHINA ADBLUE MARKET, 2022-2032 ($MILLION)
- FIGURE 35. INDIA ADBLUE MARKET, 2022-2032 ($MILLION)
- FIGURE 36. JAPAN ADBLUE MARKET, 2022-2032 ($MILLION)
- FIGURE 37. SOUTH KOREA ADBLUE MARKET, 2022-2032 ($MILLION)
- FIGURE 38. AUSTRALIA ADBLUE MARKET, 2022-2032 ($MILLION)
- FIGURE 39. REST OF ASIA-PACIFIC ADBLUE MARKET, 2022-2032 ($MILLION)
- FIGURE 40. BRAZIL ADBLUE MARKET, 2022-2032 ($MILLION)
- FIGURE 41. SAUDI ARABIA ADBLUE MARKET, 2022-2032 ($MILLION)
- FIGURE 42. SOUTH AFRICA ADBLUE MARKET, 2022-2032 ($MILLION)
- FIGURE 43. REST OF LAMEA ADBLUE MARKET, 2022-2032 ($MILLION)
- FIGURE 44. TOP WINNING STRATEGIES, BY YEAR (2020-2022)
- FIGURE 45. TOP WINNING STRATEGIES, BY DEVELOPMENT (2020-2022)
- FIGURE 46. TOP WINNING STRATEGIES, BY COMPANY (2020-2022)
- FIGURE 47. PRODUCT MAPPING OF TOP 10 PLAYERS
- FIGURE 48. COMPETITIVE DASHBOARD
- FIGURE 49. COMPETITIVE HEATMAP: ADBLUE MARKET
- FIGURE 50. TOP PLAYER POSITIONING, 2022
- FIGURE 51. BASF SE: NET SALES, 2020-2022 ($MILLION)
- FIGURE 52. BASF SE: RESEARCH & DEVELOPMENT EXPENDITURE, 2020-2022 ($MILLION)
- FIGURE 53. BASF SE: REVENUE SHARE BY SEGMENT, 2022 (%)
- FIGURE 54. BASF SE: REVENUE SHARE BY REGION, 2022 (%)
- FIGURE 55. YARA: NET REVENUE, 2020-2022 ($MILLION)
- FIGURE 56. YARA: REVENUE SHARE BY REGION, 2022 (%)
- FIGURE 57. SHELL PLC: NET REVENUE, 2020-2022 ($MILLION)
- FIGURE 58. SHELL PLC: RESEARCH & DEVELOPMENT EXPENDITURE, 2020-2022 ($MILLION)
- FIGURE 59. SHELL PLC: REVENUE SHARE BY SEGMENT, 2022 (%)
- FIGURE 60. SHELL PLC: REVENUE SHARE BY REGION, 2022 (%)
- FIGURE 61. NISSAN CHEMICAL CORPORATION: NET SALES, 2020-2022 ($MILLION)
- FIGURE 62. NISSAN CHEMICAL CORPORATION: REVENUE SHARE BY SEGMENT, 2022 (%)
- FIGURE 63. NISSAN CHEMICAL CORPORATION: REVENUE SHARE BY REGION, 2022 (%)
- FIGURE 64. TOTALENERGIES: NET REVENUE, 2020-2022 ($MILLION)
- FIGURE 65. TOTALENERGIES: REVENUE SHARE BY SEGMENT, 2022 (%)
- FIGURE 66. CUMMINS INC.: NET SALES, 2020-2022 ($MILLION)
- FIGURE 67. CUMMINS INC.: REVENUE SHARE BY SEGMENT, 2022 (%)
- FIGURE 68. CF INDUSTRIES HOLDINGS, INC.: NET SALES, 2020-2022 ($MILLION)
- FIGURE 69. CF INDUSTRIES HOLDINGS, INC.: REVENUE SHARE BY SEGMENT, 2022 (%)
- FIGURE 70. CF INDUSTRIES HOLDINGS, INC.: REVENUE SHARE BY REGION, 2022 (%)
- FIGURE 71. BHARAT PETROLEUM CORPORATION LIMITED: NET REVENUE, 2020-2022 ($MILLION)
- FIGURE 72. BHARAT PETROLEUM CORPORATION LIMITED: REVENUE SHARE BY SEGMENT, 2022 (%)
- FIGURE 73. BHARAT PETROLEUM CORPORATION LIMITED: REVENUE SHARE BY REGION, 2022 (%)


