


 |
市場調查報告書
商品編碼
1365823
壓電陶瓷盤市場:按類型、按用途:2023-2032 年全球機會分析與產業預測Piezoceramic Discs Market By Type, By Application : Global Opportunity Analysis and Industry Forecast, 2023-2032 |
||||||
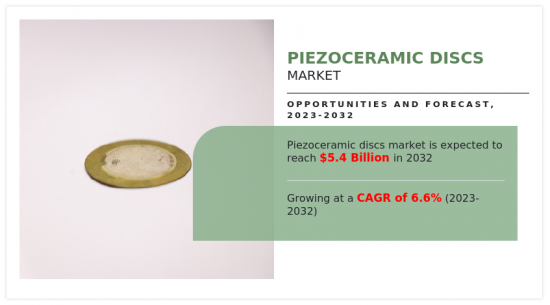
2022年壓電陶瓷盤市值為29億美元,預計2023年至2032年年複合成長率為6.6%,到2032年將達到54億美元。
壓電陶瓷盤的全球成長主要是由於壓電元件在用途上的日益採用,以及各個最終用途產業對壓電感測器和執行器的需求不斷成長。此外,印刷業對壓電噴墨列印頭的需求不斷成長預計將推動市場成長。然而,壓電陶瓷片原料成本高是全球市場的主要抑制因素。相反,在預測期內,開發用途中對壓電元件的需求不斷成長,預計將為壓電陶瓷盤行業提供利潤豐厚的機會。
壓電陶瓷盤市場按類型、用途和區域細分。依類型分類,市場分為10mm以下、10-50mm和50mm以上。按用途,壓電陶瓷盤市場分為感測器和執行器、能量收集、醫療設備、工業用途和消費性電子產品。按地區分類,北美(美國、加拿大、墨西哥)、歐洲(英國、德國、法國、其他歐洲地區)、亞太地區(中國、日本、印度、韓國、其他亞太地區)、拉丁美洲(南美)分析了美國、中東),非洲)壓電陶瓷盤市場趨勢。
目錄
第1章 簡介
第2章 執行摘要
第3章 市場概況
- 市場定義和範圍
- 主要發現
- 影響要素
- 主要投資機會
- 波特五力分析
- 市場動態
- 促進因素
- 各種最終用途產業對壓電感測器和執行器的需求不斷成長
- 印刷業對壓電噴墨印表機頭的需求不斷成長
- 在用途中擴大採用壓電裝置
- 抑制因素
- 壓電陶瓷盤原料成本急劇上升
- 機會
- 開發用途中對壓電裝置的需求增加
- 促進因素
- COVID-19 市場影響分析
第4章 壓電陶瓷盤市場:依類型
- 概述
- 10毫米以下
- 10~50mm
- 50毫米以上
第5章 壓電陶瓷盤市場:依用途
- 概述
- 感測器和執行器
- 能量收集
- 醫療設備
- 工業用途
- 消費性電子產品
第6章 壓電陶瓷盤市場:依地區
- 概述
- 北美洲
- 美國
- 加拿大
- 墨西哥
- 歐洲
- 英國
- 法國
- 西班牙
- 義大利
- 其他
- 亞太地區
- 中國
- 日本
- 印度
- 韓國
- 其他
- 拉丁美洲
- 拉丁美洲
- 中東
- 非洲
第7章 競爭形勢
- 介紹
- 關鍵成功策略
- 10家主要企業產品圖譜
- 競爭儀表板
- 競爭熱圖
- 2022年主要企業定位
第8章 公司簡介
- Murata Manufacturing Co.,Ltd
- TDK Corp.
- Sparkler Ceramics Pvt. Ltd.
- Physik Instrumente(PI)GmbH & Co. KG.
- Micromechatronics Inc
- CTS Corporation
- Sensor Technology Ltd
- Fuji Ceramics Corporation
- CeramTec GmbH
- TRS Technologies, Inc
According to a new report published by Allied Market Research, titled, "Piezoceramic Discs Market," The piezoceramic discs market was valued at $2.9 billion in 2022, and is estimated to reach $5.4 billion by 2032, growing at a CAGR of 6.6% from 2023 to 2032.
The growth of global piezoceramic discs is majorly driven by the increasing adoption of piezoelectric devices for application paired with the growing demand for piezoelectric sensors and actuators from various end-use industries. Moreover, the rising demand for piezoelectric inkjet print heads from the printing industry is expected to drive market growth. However, the high cost of raw materials for piezoceramic discs is acting as the prime restraint of the global market. On the contrary, the rising demand for piezoelectric devices in developing applications is anticipated to provide lucrative opportunities for the Piezoceramic discs industry during the forecast period.
The Piezoceramic discs market is segmented into product type, application, and region. On the basis of type, the market is categorized into below 10mm, 10mm to 50mm, and above 50mm. By application, the Piezoceramic discs market is classified into sensor and actuators, energy harvesting, medical device, industrial applications, and consumer electronics. Region-wise, the piezoceramic discs market trends are analyzed across North America (the U.S., Canada, and Mexico), Europe (UK, Germany, France, and Rest of Europe), Asia-Pacific (China, Japan, India, South Korea, and Rest of Asia-Pacific), and LAMEA (Latin America, Middle East, and Africa).
The key players operating in the market include Physik Instrumente (PI) GmbH & Co. KG., Murata, TDK, CTS Corporation, Sparkler Ceramics, CeramTec, Fuji Ceramics Corporation, TRS Technologies, Inc, Micromechatronics Inc., and Sensor Technology Ltd.
Key Benefits For Stakeholders
- This report provides a quantitative analysis of the market segments, current trends, estimations, and dynamics of the piezoceramic discs market analysis from 2022 to 2032 to identify the prevailing piezoceramic discs market opportunities.
- The market research is offered along with information related to key drivers, restraints, and opportunities.
- Porter's five forces analysis highlights the potency of buyers and suppliers to enable stakeholders make profit-oriented business decisions and strengthen their supplier-buyer network.
- In-depth analysis of the piezoceramic discs market segmentation assists to determine the prevailing market opportunities.
- Major countries in each region are mapped according to their revenue contribution to the global market.
- Market player positioning facilitates benchmarking and provides a clear understanding of the present position of the market players.
- The report includes the analysis of the regional as well as global piezoceramic discs market trends, key players, market segments, application areas, and market growth strategies.
Additional benefits you will get with this purchase are:
- Quarterly Update and* (only available with a corporate license, on listed price)
- 5 additional Company Profile of client Choice pre- or Post-purchase, as a free update.
- Free Upcoming Version on the Purchase of Five and Enterprise User License.
- 16 analyst hours of support* (post-purchase, if you find additional data requirements upon review of the report, you may receive support amounting to 16 analyst hours to solve questions, and post-sale queries)
- 15% Free Customization* (in case the scope or segment of the report does not match your requirements, 20% is equivalent to 3 working days of free work, applicable once)
- Free data Pack on the Five and Enterprise User License. (Excel version of the report)
- Free Updated report if the report is 6-12 months old or older.
- 24-hour priority response*
- Free Industry updates and white papers.
Possible Customization with this report (with additional cost and timeline talk to the sales executive to know more)
- Product Benchmarking / Product specification and applications
- Supply Chain Analysis & Vendor Margins
- Market share analysis of players by products/segments
- New Product Development/ Product Matrix of Key Players
- Patient/epidemiology data at country, region, global level
- Regulatory Guidelines
- Criss-cross segment analysis- market size and forecast
- Historic market data
- Key player details (including location, contact details, supplier/vendor network etc. in excel format)
- SWOT Analysis
Key Market Segments
By Type
- Below 10mm
- 10mm to 50mm
- Above 50mm
By Application
- Sensor and Actuators
- Energy Harvesting
- Medical Device
- Industrial Applications
- Consumer Electronics
By Region
- North America
- U.S.
- Canada
- Mexico
- Europe
- UK
- France
- Spain
- Italy
- Rest of Europe
- Asia-Pacific
- China
- Japan
- India
- South Korea
- Rest of Asia-Pacific
- LAMEA
- Latin America
- Middle East
- Africa
Key Market Players:
- TDK Corp.
- Sensor Technology Ltd
- Fuji Ceramics Corporation
- Micromechatronics Inc
- Physik Instrumente (PI) GmbH & Co. KG.
- CeramTec GmbH
- Murata Manufacturing Co.,Ltd
- TRS Technologies, Inc
- CTS Corporation
- Sparkler Ceramics Pvt. Ltd.
TABLE OF CONTENTS
CHAPTER 1: INTRODUCTION
- 1.1. Report description
- 1.2. Key market segments
- 1.3. Key benefits to the stakeholders
- 1.4. Research Methodology
- 1.4.1. Primary research
- 1.4.2. Secondary research
- 1.4.3. Analyst tools and models
CHAPTER 2: EXECUTIVE SUMMARY
- 2.1. CXO Perspective
CHAPTER 3: MARKET OVERVIEW
- 3.1. Market definition and scope
- 3.2. Key findings
- 3.2.1. Top impacting factors
- 3.2.2. Top investment pockets
- 3.3. Porter's five forces analysis
- 3.3.1. Low bargaining power of suppliers
- 3.3.2. Low threat of new entrants
- 3.3.3. Low threat of substitutes
- 3.3.4. Low intensity of rivalry
- 3.3.5. Low bargaining power of buyers
- 3.4. Market dynamics
- 3.4.1. Drivers
- 3.4.1.1. The growing demand for piezoelectric sensors and actuators from various end-use industries
- 3.4.1.2. The rising demand for piezoelectric inkjet print heads from the printing industry
- 3.4.1.3. Increasing adoption of piezoelectric devices for application
- 3.4.1. Drivers
- 3.4.2. Restraints
- 3.4.2.1. High cost of raw materials for piezoceramic discs
- 3.4.3. Opportunities
- 3.4.3.1. Rising demand for piezoelectric devices in developing applications
- 3.5. COVID-19 Impact Analysis on the market
CHAPTER 4: PIEZOCERAMIC DISCS MARKET, BY TYPE
- 4.1. Overview
- 4.1.1. Market size and forecast
- 4.2. Below 10mm
- 4.2.1. Key market trends, growth factors and opportunities
- 4.2.2. Market size and forecast, by region
- 4.2.3. Market share analysis by country
- 4.3. 10mm to 50mm
- 4.3.1. Key market trends, growth factors and opportunities
- 4.3.2. Market size and forecast, by region
- 4.3.3. Market share analysis by country
- 4.4. Above 50mm
- 4.4.1. Key market trends, growth factors and opportunities
- 4.4.2. Market size and forecast, by region
- 4.4.3. Market share analysis by country
CHAPTER 5: PIEZOCERAMIC DISCS MARKET, BY APPLICATION
- 5.1. Overview
- 5.1.1. Market size and forecast
- 5.2. Sensor and Actuators
- 5.2.1. Key market trends, growth factors and opportunities
- 5.2.2. Market size and forecast, by region
- 5.2.3. Market share analysis by country
- 5.3. Energy Harvesting
- 5.3.1. Key market trends, growth factors and opportunities
- 5.3.2. Market size and forecast, by region
- 5.3.3. Market share analysis by country
- 5.4. Medical Device
- 5.4.1. Key market trends, growth factors and opportunities
- 5.4.2. Market size and forecast, by region
- 5.4.3. Market share analysis by country
- 5.5. Industrial Applications
- 5.5.1. Key market trends, growth factors and opportunities
- 5.5.2. Market size and forecast, by region
- 5.5.3. Market share analysis by country
- 5.6. Consumer Electronics
- 5.6.1. Key market trends, growth factors and opportunities
- 5.6.2. Market size and forecast, by region
- 5.6.3. Market share analysis by country
CHAPTER 6: PIEZOCERAMIC DISCS MARKET, BY REGION
- 6.1. Overview
- 6.1.1. Market size and forecast By Region
- 6.2. North America
- 6.2.1. Key market trends, growth factors and opportunities
- 6.2.2. Market size and forecast, by Type
- 6.2.3. Market size and forecast, by Application
- 6.2.4. Market size and forecast, by country
- 6.2.4.1. U.S.
- 6.2.4.1.1. Market size and forecast, by Type
- 6.2.4.1.2. Market size and forecast, by Application
- 6.2.4.2. Canada
- 6.2.4.2.1. Market size and forecast, by Type
- 6.2.4.2.2. Market size and forecast, by Application
- 6.2.4.3. Mexico
- 6.2.4.3.1. Market size and forecast, by Type
- 6.2.4.3.2. Market size and forecast, by Application
- 6.3. Europe
- 6.3.1. Key market trends, growth factors and opportunities
- 6.3.2. Market size and forecast, by Type
- 6.3.3. Market size and forecast, by Application
- 6.3.4. Market size and forecast, by country
- 6.3.4.1. UK
- 6.3.4.1.1. Market size and forecast, by Type
- 6.3.4.1.2. Market size and forecast, by Application
- 6.3.4.2. France
- 6.3.4.2.1. Market size and forecast, by Type
- 6.3.4.2.2. Market size and forecast, by Application
- 6.3.4.3. Spain
- 6.3.4.3.1. Market size and forecast, by Type
- 6.3.4.3.2. Market size and forecast, by Application
- 6.3.4.4. Italy
- 6.3.4.4.1. Market size and forecast, by Type
- 6.3.4.4.2. Market size and forecast, by Application
- 6.3.4.5. Rest of Europe
- 6.3.4.5.1. Market size and forecast, by Type
- 6.3.4.5.2. Market size and forecast, by Application
- 6.4. Asia-Pacific
- 6.4.1. Key market trends, growth factors and opportunities
- 6.4.2. Market size and forecast, by Type
- 6.4.3. Market size and forecast, by Application
- 6.4.4. Market size and forecast, by country
- 6.4.4.1. China
- 6.4.4.1.1. Market size and forecast, by Type
- 6.4.4.1.2. Market size and forecast, by Application
- 6.4.4.2. Japan
- 6.4.4.2.1. Market size and forecast, by Type
- 6.4.4.2.2. Market size and forecast, by Application
- 6.4.4.3. India
- 6.4.4.3.1. Market size and forecast, by Type
- 6.4.4.3.2. Market size and forecast, by Application
- 6.4.4.4. South Korea
- 6.4.4.4.1. Market size and forecast, by Type
- 6.4.4.4.2. Market size and forecast, by Application
- 6.4.4.5. Rest of Asia-Pacific
- 6.4.4.5.1. Market size and forecast, by Type
- 6.4.4.5.2. Market size and forecast, by Application
- 6.5. LAMEA
- 6.5.1. Key market trends, growth factors and opportunities
- 6.5.2. Market size and forecast, by Type
- 6.5.3. Market size and forecast, by Application
- 6.5.4. Market size and forecast, by country
- 6.5.4.1. Latin America
- 6.5.4.1.1. Market size and forecast, by Type
- 6.5.4.1.2. Market size and forecast, by Application
- 6.5.4.2. Middle East
- 6.5.4.2.1. Market size and forecast, by Type
- 6.5.4.2.2. Market size and forecast, by Application
- 6.5.4.3. Africa
- 6.5.4.3.1. Market size and forecast, by Type
- 6.5.4.3.2. Market size and forecast, by Application
CHAPTER 7: COMPETITIVE LANDSCAPE
- 7.1. Introduction
- 7.2. Top winning strategies
- 7.3. Product Mapping of Top 10 Player
- 7.4. Competitive Dashboard
- 7.5. Competitive Heatmap
- 7.6. Top player positioning, 2022
CHAPTER 8: COMPANY PROFILES
- 8.1. Murata Manufacturing Co.,Ltd
- 8.1.1. Company overview
- 8.1.2. Key Executives
- 8.1.3. Company snapshot
- 8.1.4. Operating business segments
- 8.1.5. Product portfolio
- 8.1.6. Business performance
- 8.1.7. Key strategic moves and developments
- 8.2. TDK Corp.
- 8.2.1. Company overview
- 8.2.2. Key Executives
- 8.2.3. Company snapshot
- 8.2.4. Operating business segments
- 8.2.5. Product portfolio
- 8.2.6. Business performance
- 8.2.7. Key strategic moves and developments
- 8.3. Sparkler Ceramics Pvt. Ltd.
- 8.3.1. Company overview
- 8.3.2. Key Executives
- 8.3.3. Company snapshot
- 8.3.4. Operating business segments
- 8.3.5. Product portfolio
- 8.4. Physik Instrumente (PI) GmbH & Co. KG.
- 8.4.1. Company overview
- 8.4.2. Key Executives
- 8.4.3. Company snapshot
- 8.4.4. Operating business segments
- 8.4.5. Product portfolio
- 8.4.6. Key strategic moves and developments
- 8.5. Micromechatronics Inc
- 8.5.1. Company overview
- 8.5.2. Key Executives
- 8.5.3. Company snapshot
- 8.5.4. Operating business segments
- 8.5.5. Product portfolio
- 8.5.6. Key strategic moves and developments
- 8.6. CTS Corporation
- 8.6.1. Company overview
- 8.6.2. Key Executives
- 8.6.3. Company snapshot
- 8.6.4. Operating business segments
- 8.6.5. Product portfolio
- 8.6.6. Business performance
- 8.7. Sensor Technology Ltd
- 8.7.1. Company overview
- 8.7.2. Key Executives
- 8.7.3. Company snapshot
- 8.7.4. Operating business segments
- 8.7.5. Product portfolio
- 8.7.6. Key strategic moves and developments
- 8.8. Fuji Ceramics Corporation
- 8.8.1. Company overview
- 8.8.2. Key Executives
- 8.8.3. Company snapshot
- 8.8.4. Operating business segments
- 8.8.5. Product portfolio
- 8.9. CeramTec GmbH
- 8.9.1. Company overview
- 8.9.2. Key Executives
- 8.9.3. Company snapshot
- 8.9.4. Operating business segments
- 8.9.5. Product portfolio
- 8.9.6. Business performance
- 8.10. TRS Technologies, Inc
- 8.10.1. Company overview
- 8.10.2. Key Executives
- 8.10.3. Company snapshot
- 8.10.4. Operating business segments
- 8.10.5. Product portfolio
LIST OF TABLES
- TABLE 01. GLOBAL PIEZOCERAMIC DISCS MARKET, BY TYPE, 2022-2032 ($MILLION)
- TABLE 02. PIEZOCERAMIC DISCS MARKET FOR BELOW 10MM, BY REGION, 2022-2032 ($MILLION)
- TABLE 03. PIEZOCERAMIC DISCS MARKET FOR 10MM TO 50MM, BY REGION, 2022-2032 ($MILLION)
- TABLE 04. PIEZOCERAMIC DISCS MARKET FOR ABOVE 50MM, BY REGION, 2022-2032 ($MILLION)
- TABLE 05. GLOBAL PIEZOCERAMIC DISCS MARKET, BY APPLICATION, 2022-2032 ($MILLION)
- TABLE 06. PIEZOCERAMIC DISCS MARKET FOR SENSOR AND ACTUATORS, BY REGION, 2022-2032 ($MILLION)
- TABLE 07. PIEZOCERAMIC DISCS MARKET FOR ENERGY HARVESTING, BY REGION, 2022-2032 ($MILLION)
- TABLE 08. PIEZOCERAMIC DISCS MARKET FOR MEDICAL DEVICE, BY REGION, 2022-2032 ($MILLION)
- TABLE 09. PIEZOCERAMIC DISCS MARKET FOR INDUSTRIAL APPLICATIONS, BY REGION, 2022-2032 ($MILLION)
- TABLE 10. PIEZOCERAMIC DISCS MARKET FOR CONSUMER ELECTRONICS, BY REGION, 2022-2032 ($MILLION)
- TABLE 11. PIEZOCERAMIC DISCS MARKET, BY REGION, 2022-2032 ($MILLION)
- TABLE 12. NORTH AMERICA PIEZOCERAMIC DISCS MARKET, BY TYPE, 2022-2032 ($MILLION)
- TABLE 13. NORTH AMERICA PIEZOCERAMIC DISCS MARKET, BY APPLICATION, 2022-2032 ($MILLION)
- TABLE 14. NORTH AMERICA PIEZOCERAMIC DISCS MARKET, BY COUNTRY, 2022-2032 ($MILLION)
- TABLE 15. U.S. PIEZOCERAMIC DISCS MARKET, BY TYPE, 2022-2032 ($MILLION)
- TABLE 16. U.S. PIEZOCERAMIC DISCS MARKET, BY APPLICATION, 2022-2032 ($MILLION)
- TABLE 17. CANADA PIEZOCERAMIC DISCS MARKET, BY TYPE, 2022-2032 ($MILLION)
- TABLE 18. CANADA PIEZOCERAMIC DISCS MARKET, BY APPLICATION, 2022-2032 ($MILLION)
- TABLE 19. MEXICO PIEZOCERAMIC DISCS MARKET, BY TYPE, 2022-2032 ($MILLION)
- TABLE 20. MEXICO PIEZOCERAMIC DISCS MARKET, BY APPLICATION, 2022-2032 ($MILLION)
- TABLE 21. EUROPE PIEZOCERAMIC DISCS MARKET, BY TYPE, 2022-2032 ($MILLION)
- TABLE 22. EUROPE PIEZOCERAMIC DISCS MARKET, BY APPLICATION, 2022-2032 ($MILLION)
- TABLE 23. EUROPE PIEZOCERAMIC DISCS MARKET, BY COUNTRY, 2022-2032 ($MILLION)
- TABLE 24. UK PIEZOCERAMIC DISCS MARKET, BY TYPE, 2022-2032 ($MILLION)
- TABLE 25. UK PIEZOCERAMIC DISCS MARKET, BY APPLICATION, 2022-2032 ($MILLION)
- TABLE 26. FRANCE PIEZOCERAMIC DISCS MARKET, BY TYPE, 2022-2032 ($MILLION)
- TABLE 27. FRANCE PIEZOCERAMIC DISCS MARKET, BY APPLICATION, 2022-2032 ($MILLION)
- TABLE 28. SPAIN PIEZOCERAMIC DISCS MARKET, BY TYPE, 2022-2032 ($MILLION)
- TABLE 29. SPAIN PIEZOCERAMIC DISCS MARKET, BY APPLICATION, 2022-2032 ($MILLION)
- TABLE 30. ITALY PIEZOCERAMIC DISCS MARKET, BY TYPE, 2022-2032 ($MILLION)
- TABLE 31. ITALY PIEZOCERAMIC DISCS MARKET, BY APPLICATION, 2022-2032 ($MILLION)
- TABLE 32. REST OF EUROPE PIEZOCERAMIC DISCS MARKET, BY TYPE, 2022-2032 ($MILLION)
- TABLE 33. REST OF EUROPE PIEZOCERAMIC DISCS MARKET, BY APPLICATION, 2022-2032 ($MILLION)
- TABLE 34. ASIA-PACIFIC PIEZOCERAMIC DISCS MARKET, BY TYPE, 2022-2032 ($MILLION)
- TABLE 35. ASIA-PACIFIC PIEZOCERAMIC DISCS MARKET, BY APPLICATION, 2022-2032 ($MILLION)
- TABLE 36. ASIA-PACIFIC PIEZOCERAMIC DISCS MARKET, BY COUNTRY, 2022-2032 ($MILLION)
- TABLE 37. CHINA PIEZOCERAMIC DISCS MARKET, BY TYPE, 2022-2032 ($MILLION)
- TABLE 38. CHINA PIEZOCERAMIC DISCS MARKET, BY APPLICATION, 2022-2032 ($MILLION)
- TABLE 39. JAPAN PIEZOCERAMIC DISCS MARKET, BY TYPE, 2022-2032 ($MILLION)
- TABLE 40. JAPAN PIEZOCERAMIC DISCS MARKET, BY APPLICATION, 2022-2032 ($MILLION)
- TABLE 41. INDIA PIEZOCERAMIC DISCS MARKET, BY TYPE, 2022-2032 ($MILLION)
- TABLE 42. INDIA PIEZOCERAMIC DISCS MARKET, BY APPLICATION, 2022-2032 ($MILLION)
- TABLE 43. SOUTH KOREA PIEZOCERAMIC DISCS MARKET, BY TYPE, 2022-2032 ($MILLION)
- TABLE 44. SOUTH KOREA PIEZOCERAMIC DISCS MARKET, BY APPLICATION, 2022-2032 ($MILLION)
- TABLE 45. REST OF ASIA-PACIFIC PIEZOCERAMIC DISCS MARKET, BY TYPE, 2022-2032 ($MILLION)
- TABLE 46. REST OF ASIA-PACIFIC PIEZOCERAMIC DISCS MARKET, BY APPLICATION, 2022-2032 ($MILLION)
- TABLE 47. LAMEA PIEZOCERAMIC DISCS MARKET, BY TYPE, 2022-2032 ($MILLION)
- TABLE 48. LAMEA PIEZOCERAMIC DISCS MARKET, BY APPLICATION, 2022-2032 ($MILLION)
- TABLE 49. LAMEA PIEZOCERAMIC DISCS MARKET, BY COUNTRY, 2022-2032 ($MILLION)
- TABLE 50. LATIN AMERICA PIEZOCERAMIC DISCS MARKET, BY TYPE, 2022-2032 ($MILLION)
- TABLE 51. LATIN AMERICA PIEZOCERAMIC DISCS MARKET, BY APPLICATION, 2022-2032 ($MILLION)
- TABLE 52. MIDDLE EAST PIEZOCERAMIC DISCS MARKET, BY TYPE, 2022-2032 ($MILLION)
- TABLE 53. MIDDLE EAST PIEZOCERAMIC DISCS MARKET, BY APPLICATION, 2022-2032 ($MILLION)
- TABLE 54. AFRICA PIEZOCERAMIC DISCS MARKET, BY TYPE, 2022-2032 ($MILLION)
- TABLE 55. AFRICA PIEZOCERAMIC DISCS MARKET, BY APPLICATION, 2022-2032 ($MILLION)
- TABLE 56. MURATA MANUFACTURING CO.,LTD: KEY EXECUTIVES
- TABLE 57. MURATA MANUFACTURING CO.,LTD: COMPANY SNAPSHOT
- TABLE 58. MURATA MANUFACTURING CO.,LTD: SERVICE SEGMENTS
- TABLE 59. MURATA MANUFACTURING CO.,LTD: PRODUCT PORTFOLIO
- TABLE 60. MURATA MANUFACTURING CO.,LTD: KEY STRATERGIES
- TABLE 61. TDK CORP.: KEY EXECUTIVES
- TABLE 62. TDK CORP.: COMPANY SNAPSHOT
- TABLE 63. TDK CORP.: SERVICE SEGMENTS
- TABLE 64. TDK CORP.: PRODUCT PORTFOLIO
- TABLE 65. TDK CORP.: KEY STRATERGIES
- TABLE 66. SPARKLER CERAMICS PVT. LTD.: KEY EXECUTIVES
- TABLE 67. SPARKLER CERAMICS PVT. LTD.: COMPANY SNAPSHOT
- TABLE 68. SPARKLER CERAMICS PVT. LTD.: PRODUCT SEGMENTS
- TABLE 69. SPARKLER CERAMICS PVT. LTD.: PRODUCT PORTFOLIO
- TABLE 70. PHYSIK INSTRUMENTE (PI) GMBH & CO. KG.: KEY EXECUTIVES
- TABLE 71. PHYSIK INSTRUMENTE (PI) GMBH & CO. KG.: COMPANY SNAPSHOT
- TABLE 72. PHYSIK INSTRUMENTE (PI) GMBH & CO. KG.: SERVICE SEGMENTS
- TABLE 73. PHYSIK INSTRUMENTE (PI) GMBH & CO. KG.: PRODUCT PORTFOLIO
- TABLE 74. PHYSIK INSTRUMENTE (PI) GMBH & CO. KG.: KEY STRATERGIES
- TABLE 75. MICROMECHATRONICS INC: KEY EXECUTIVES
- TABLE 76. MICROMECHATRONICS INC: COMPANY SNAPSHOT
- TABLE 77. MICROMECHATRONICS INC: PRODUCT SEGMENTS
- TABLE 78. MICROMECHATRONICS INC: PRODUCT PORTFOLIO
- TABLE 79. MICROMECHATRONICS INC: KEY STRATERGIES
- TABLE 80. CTS CORPORATION: KEY EXECUTIVES
- TABLE 81. CTS CORPORATION: COMPANY SNAPSHOT
- TABLE 82. CTS CORPORATION: PRODUCT SEGMENTS
- TABLE 83. CTS CORPORATION: SERVICE SEGMENTS
- TABLE 84. CTS CORPORATION: PRODUCT PORTFOLIO
- TABLE 85. SENSOR TECHNOLOGY LTD: KEY EXECUTIVES
- TABLE 86. SENSOR TECHNOLOGY LTD: COMPANY SNAPSHOT
- TABLE 87. SENSOR TECHNOLOGY LTD: PRODUCT SEGMENTS
- TABLE 88. SENSOR TECHNOLOGY LTD: PRODUCT PORTFOLIO
- TABLE 89. SENSOR TECHNOLOGY LTD: KEY STRATERGIES
- TABLE 90. FUJI CERAMICS CORPORATION: KEY EXECUTIVES
- TABLE 91. FUJI CERAMICS CORPORATION: COMPANY SNAPSHOT
- TABLE 92. FUJI CERAMICS CORPORATION: PRODUCT SEGMENTS
- TABLE 93. FUJI CERAMICS CORPORATION: PRODUCT PORTFOLIO
- TABLE 94. CERAMTEC GMBH: KEY EXECUTIVES
- TABLE 95. CERAMTEC GMBH: COMPANY SNAPSHOT
- TABLE 96. CERAMTEC GMBH: SERVICE SEGMENTS
- TABLE 97. CERAMTEC GMBH: PRODUCT PORTFOLIO
- TABLE 98. TRS TECHNOLOGIES, INC: KEY EXECUTIVES
- TABLE 99. TRS TECHNOLOGIES, INC: COMPANY SNAPSHOT
- TABLE 100. TRS TECHNOLOGIES, INC: PRODUCT SEGMENTS
- TABLE 101. TRS TECHNOLOGIES, INC: PRODUCT PORTFOLIO
LIST OF FIGURES
- FIGURE 01. PIEZOCERAMIC DISCS MARKET, 2022-2032
- FIGURE 02. SEGMENTATION OF PIEZOCERAMIC DISCS MARKET,2022-2032
- FIGURE 03. TOP INVESTMENT POCKETS IN PIEZOCERAMIC DISCS MARKET (2023-2032)
- FIGURE 04. LOW BARGAINING POWER OF SUPPLIERS
- FIGURE 05. LOW THREAT OF NEW ENTRANTS
- FIGURE 06. LOW THREAT OF SUBSTITUTES
- FIGURE 07. LOW INTENSITY OF RIVALRY
- FIGURE 08. LOW BARGAINING POWER OF BUYERS
- FIGURE 09. GLOBAL PIEZOCERAMIC DISCS MARKET:DRIVERS, RESTRAINTS AND OPPORTUNITIES
- FIGURE 10. PIEZOCERAMIC DISCS MARKET, BY TYPE, 2022(%)
- FIGURE 11. COMPARATIVE SHARE ANALYSIS OF PIEZOCERAMIC DISCS MARKET FOR BELOW 10MM, BY COUNTRY 2022 AND 2032(%)
- FIGURE 12. COMPARATIVE SHARE ANALYSIS OF PIEZOCERAMIC DISCS MARKET FOR 10MM TO 50MM, BY COUNTRY 2022 AND 2032(%)
- FIGURE 13. COMPARATIVE SHARE ANALYSIS OF PIEZOCERAMIC DISCS MARKET FOR ABOVE 50MM, BY COUNTRY 2022 AND 2032(%)
- FIGURE 14. PIEZOCERAMIC DISCS MARKET, BY APPLICATION, 2022(%)
- FIGURE 15. COMPARATIVE SHARE ANALYSIS OF PIEZOCERAMIC DISCS MARKET FOR SENSOR AND ACTUATORS, BY COUNTRY 2022 AND 2032(%)
- FIGURE 16. COMPARATIVE SHARE ANALYSIS OF PIEZOCERAMIC DISCS MARKET FOR ENERGY HARVESTING, BY COUNTRY 2022 AND 2032(%)
- FIGURE 17. COMPARATIVE SHARE ANALYSIS OF PIEZOCERAMIC DISCS MARKET FOR MEDICAL DEVICE, BY COUNTRY 2022 AND 2032(%)
- FIGURE 18. COMPARATIVE SHARE ANALYSIS OF PIEZOCERAMIC DISCS MARKET FOR INDUSTRIAL APPLICATIONS, BY COUNTRY 2022 AND 2032(%)
- FIGURE 19. COMPARATIVE SHARE ANALYSIS OF PIEZOCERAMIC DISCS MARKET FOR CONSUMER ELECTRONICS, BY COUNTRY 2022 AND 2032(%)
- FIGURE 20. PIEZOCERAMIC DISCS MARKET BY REGION, 2022(%)
- FIGURE 21. U.S. PIEZOCERAMIC DISCS MARKET, 2022-2032 ($MILLION)
- FIGURE 22. CANADA PIEZOCERAMIC DISCS MARKET, 2022-2032 ($MILLION)
- FIGURE 23. MEXICO PIEZOCERAMIC DISCS MARKET, 2022-2032 ($MILLION)
- FIGURE 24. UK PIEZOCERAMIC DISCS MARKET, 2022-2032 ($MILLION)
- FIGURE 25. FRANCE PIEZOCERAMIC DISCS MARKET, 2022-2032 ($MILLION)
- FIGURE 26. SPAIN PIEZOCERAMIC DISCS MARKET, 2022-2032 ($MILLION)
- FIGURE 27. ITALY PIEZOCERAMIC DISCS MARKET, 2022-2032 ($MILLION)
- FIGURE 28. REST OF EUROPE PIEZOCERAMIC DISCS MARKET, 2022-2032 ($MILLION)
- FIGURE 29. CHINA PIEZOCERAMIC DISCS MARKET, 2022-2032 ($MILLION)
- FIGURE 30. JAPAN PIEZOCERAMIC DISCS MARKET, 2022-2032 ($MILLION)
- FIGURE 31. INDIA PIEZOCERAMIC DISCS MARKET, 2022-2032 ($MILLION)
- FIGURE 32. SOUTH KOREA PIEZOCERAMIC DISCS MARKET, 2022-2032 ($MILLION)
- FIGURE 33. REST OF ASIA-PACIFIC PIEZOCERAMIC DISCS MARKET, 2022-2032 ($MILLION)
- FIGURE 34. LATIN AMERICA PIEZOCERAMIC DISCS MARKET, 2022-2032 ($MILLION)
- FIGURE 35. MIDDLE EAST PIEZOCERAMIC DISCS MARKET, 2022-2032 ($MILLION)
- FIGURE 36. AFRICA PIEZOCERAMIC DISCS MARKET, 2022-2032 ($MILLION)
- FIGURE 37. TOP WINNING STRATEGIES, BY YEAR (2020-2023)
- FIGURE 38. TOP WINNING STRATEGIES, BY DEVELOPMENT (2020-2023)
- FIGURE 39. TOP WINNING STRATEGIES, BY COMPANY (2020-2023)
- FIGURE 40. PRODUCT MAPPING OF TOP 10 PLAYERS
- FIGURE 41. COMPETITIVE DASHBOARD
- FIGURE 42. COMPETITIVE HEATMAP: PIEZOCERAMIC DISCS MARKET
- FIGURE 43. TOP PLAYER POSITIONING, 2022
- FIGURE 44. MURATA MANUFACTURING CO.,LTD: NET SALES, 2021-2023 ($MILLION)
- FIGURE 45. MURATA MANUFACTURING CO.,LTD: RESEARCH & DEVELOPMENT EXPENDITURE, 2021-2023 ($MILLION)
- FIGURE 46. MURATA MANUFACTURING CO.,LTD: REVENUE SHARE BY SEGMENT, 2023 (%)
- FIGURE 47. TDK CORP.: NET REVENUE, 2020-2022 ($MILLION)
- FIGURE 48. TDK CORP.: RESEARCH & DEVELOPMENT EXPENDITURE, 2020-2022 ($MILLION)
- FIGURE 49. TDK CORP.: REVENUE SHARE BY REGION, 2022 (%)
- FIGURE 50. TDK CORP.: REVENUE SHARE BY SEGMENT, 2022 (%)
- FIGURE 51. CTS CORPORATION: NET REVENUE, 2019-2021 ($MILLION)
- FIGURE 52. CTS CORPORATION: RESEARCH & DEVELOPMENT EXPENDITURE, 2019-2021 ($MILLION)
- FIGURE 53. CTS CORPORATION: REVENUE SHARE BY SEGMENT, 2021 (%)
- FIGURE 54. CERAMTEC GMBH: NET REVENUE, 2019-2021 ($MILLION)
- FIGURE 55. CERAMTEC GMBH: RESEARCH & DEVELOPMENT EXPENDITURE, 2019-2021
- FIGURE 56. CERAMTEC GMBH: REVENUE SHARE BY SEGMENT, 2021 (%)
- FIGURE 57. CERAMTEC GMBH: REVENUE SHARE BY REGION, 2021 (%)
 氣動致動器市場:全球2025-2029
 氣動旋轉致動器全球市場報告:趨勢、預測和競爭分析(至 2031 年)
 桿式致動器市場按等級、分銷管道和最終用途分類 - 2025-2030 年全球預測
 全球人造肌肉市場:依材料類型、應用、驅動方法、最終用戶和地區
 全球地暖執行器市場研究報告 - 產業分析、規模、佔有率、成長、趨勢及 2025 年至 2033 年預測
 2025 年致動器全球市場報告窗簾桿市場報告:趨勢、預測和競爭分析(至 2031 年)2025 年機器人和自動化致動器全球市場報告致動器市場規模、佔有率和成長分析(按系統、類型、應用、最終用戶和地區)- 產業預測 2025-2032
 住宅地暖執行器市場機會、成長動力、產業趨勢分析與 2024 - 2032 年預測