


 |
市場調查報告書
商品編碼
1365734
核心銀行軟體市場:按組件、部署模型和最終用戶:全球機會分析和行業預測,2023-2032年Core Banking Software Market By Component (Solution, Service), By Deployment Model (On-premise, Cloud), By End User (Banks, Financial Institutions, Others): Global Opportunity Analysis and Industry Forecast, 2023-2032 |
||||||
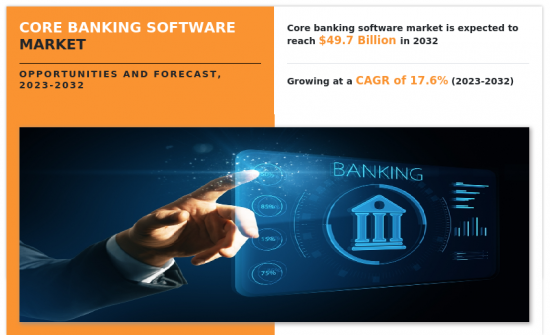
2022年,核心銀行軟體市場價值為102億美元,預計2023年至2032年年複合成長率為17.6%,到2032年將達到497億美元。
核心銀行軟體市場的主要促進因素之一是擴大採用Finastra、FIS和TemenosAG等核心銀行軟體供應商提供的雲端基礎的解決方案。此外,核心銀行平台透過減少連接多個分店所需的時間來提高業務效率。因此,無論客戶的實際位置如何,銀行都能夠更快地處理交易,推動市場成長。此外,核心銀行軟體提供的24/7銀行服務的存取和安全性得到改善,加速市場成長。在非接觸式付款時代,24小時存取銀行服務非常重要。核心銀行平台永不離線,讓使用者隨時隨地進行金融交易。客戶也可以隨時撥打客服電話。因此,24x7的銀行服務存取推動核心銀行軟體市場的成長。然而,與銀行系統相關的隱私問題、彈性和擴充性不足是阻礙核心銀行軟體市場成長的一些要素。而人工智慧(AI)、巨量資料和雲端等技術在銀行業的整合預計將在未來年度為核心銀行軟體市場提供利潤豐厚的成長機會。
目錄
第1章 簡介
第2章 執行摘要
第3章 市場概況
- 市場定義和範圍
- 主要發現
- 影響要素
- 主要投資機會
- 波特五力分析
- 市場動態
- 促進因素
- 更多採用雲端基礎的解決方案
- 改善客戶關係
- 降低營運成本
- 抑制因素
- 彈性且擴充性差
- 與銀行體系相關的隱私問題
- 機會
- 將人工智慧整合銀行系統
- 促進因素
- COVID-19 市場影響分析
第4章 核心銀行軟體市場:按組成部分
- 概述
- 解決方案
- 服務
第5章 核心銀行軟體市場:依部署模型
- 概述
- 本地
- 雲端
第6章 會計軟體市場:依最終使用者分類
- 概述
- 銀行
- 金融機構
- 其他
第7章 核心銀行軟體市場 核心銀行軟體市場:依地區
- 概述
- 北美洲
- 美國
- 加拿大
- 歐洲
- 英國
- 德國
- 法國
- 義大利
- 西班牙
- 其他
- 亞太地區
- 中國
- 日本
- 印度
- 澳洲
- 韓國
- 其他
- 拉丁美洲
- 拉丁美洲
- 中東
- 非洲
第8章 競爭形勢
- 介紹
- 關鍵成功策略
- 10家主要企業產品圖譜
- 競爭儀表板
- 競爭熱圖
- 2022年主要企業定位
第9章 公司簡介
- Capgemini SE
- Finastra
- FIS
- Fiserv, Inc.
- HCL Technologies Limited
- Infosys Limited
- Jack Henry & Associates, Inc.
- Oracle Corporation
- Temenos AG
- Unisys
According to a new report published by Allied Market Research, titled, "Core Banking Software Market," The core banking software market was valued at $10.2 billion in 2022, and is estimated to reach $49.7 billion by 2032, growing at a CAGR of 17.6% from 2023 to 2032.
One of the key drivers of the core banking software market is the rise in adoption of cloud-based solutions offered by core banking software providers such as Finastra, FIS, Temenos AG, and others. Furthermore, core banking platforms increase operational efficiency by reducing the time it takes to connect with multiple branches. As a result, banks can process transactions faster, regardless of the client's physical location, thus driving the market growth. In addition, 24/7 access to banking services and improved security provided by the core banking software have accelerated the market growth. Access to 24-hour banking services is essential in the era of contactless payments. Users can conduct financial transactions at any time and from any location as the core banking platform never goes offline. Customers can also call customer service at any time for assistance. Thus, 24/7 access to banking services propels the growth of the core banking software market. However, privacy concerns associated with banking systems and low flexibility and insufficient scalability are some of the factors that hamper the core banking software market growth. However, integration of technologies such as artificial intelligence (AI), big data, and the cloud in the banking industry is expected to provide lucrative growth opportunities to the core banking software market in the upcoming years.
The core banking software market is segmented into component, deployment model, end user, and region. By component, the market is differentiated into solution and service. Depending on deployment model, it is fragmented into on-premise and cloud. By end user, the market is divided into banks, financial institutions, and others. Region-wise, the market is segmented into North America, Europe, Asia-Pacific, and LAMEA.
The key players operating in the core banking software market include Capgemini, Finastra, FIS, Fiserv, Inc., HCL Technologies Limited, Infosys Limited, Jack Henry & Associates, Inc., Oracle, Temenos, and Unisys. These players have adopted various strategies to increase their market penetration and strengthen their position in the core banking software industry.
Key Benefits for Stakeholders
- The study provides in-depth analysis of the core banking software market along with current trends and future estimations to illustrate the imminent investment pockets.
- Information about key drivers, restrains, & opportunities and their impact analysis on the core banking software market size are provided in the report.
- The Porter's five forces analysis illustrates the potency of buyers and suppliers operating in the industry.
- The quantitative analysis of the core banking software market from 2022 to 2032 is provided to determine the market potential.
Additional benefits you will get with this purchase are:
- Quarterly Update and* (only available with a corporate license, on listed price)
- 5 additional Company Profile of client Choice pre- or Post-purchase, as a free update.
- Free Upcoming Version on the Purchase of Five and Enterprise User License.
- 16 analyst hours of support* (post-purchase, if you find additional data requirements upon review of the report, you may receive support amounting to 16 analyst hours to solve questions, and post-sale queries)
- 15% Free Customization* (in case the scope or segment of the report does not match your requirements, 20% is equivalent to 3 working days of free work, applicable once)
- Free data Pack on the Five and Enterprise User License. (Excel version of the report)
- Free Updated report if the report is 6-12 months old or older.
- 24-hour priority response*
- Free Industry updates and white papers.
Possible Customization with this report (with additional cost and timeline talk to the sales executive to know more)
- Investment Opportunities
- Market share analysis of players by products/segments
- Regulatory Guidelines
- Additional company profiles with specific to client's interest
- Additional country or region analysis- market size and forecast
- Expanded list for Company Profiles
- Market share analysis of players at global/region/country level
Key Market Segments
By Component
- Solution
- Service
By Deployment Model
- On-premise
- Cloud
By End User
- Banks
- Financial Institutions
- Others
By Region
- North America
- U.S.
- Canada
- Europe
- UK
- Germany
- France
- Italy
- Spain
- Rest of Europe
- Asia-Pacific
- China
- Japan
- India
- Australia
- South Korea
- Rest of Asia-Pacific
- LAMEA
- Latin America
- Middle East
- Africa
Key Market Players:
- Capgemini SE
- Oracle Corporation
- Unisys
- Finastra
- Fiserv, Inc.
- Jack Henry & Associates, Inc.
- Infosys Limited
- FIS
- Temenos AG
- HCL Technologies Limited
TABLE OF CONTENTS
CHAPTER 1: INTRODUCTION
- 1.1. Report description
- 1.2. Key market segments
- 1.3. Key benefits to the stakeholders
- 1.4. Research Methodology
- 1.4.1. Primary research
- 1.4.2. Secondary research
- 1.4.3. Analyst tools and models
CHAPTER 2: EXECUTIVE SUMMARY
- 2.1. CXO Perspective
CHAPTER 3: MARKET OVERVIEW
- 3.1. Market definition and scope
- 3.2. Key findings
- 3.2.1. Top impacting factors
- 3.2.2. Top investment pockets
- 3.3. Porter's five forces analysis
- 3.3.1. Moderate to high bargaining power of suppliers
- 3.3.2. Moderate to high threat of new entrants
- 3.3.3. Moderate to high threat of substitutes
- 3.3.4. Low to high intensity of rivalry
- 3.3.5. Low to high bargaining power of buyers
- 3.4. Market dynamics
- 3.4.1. Drivers
- 3.4.1.1. Rise in adoption of cloud-based solutions
- 3.4.1.2. Improved customer relationship
- 3.4.1.3. Lower operational costs
- 3.4.1. Drivers
- 3.4.2. Restraints
- 3.4.2.1. Low flexibility and insufficient scalability
- 3.4.2.2. Privacy concerns associated with banking systems
- 3.4.3. Opportunities
- 3.4.3.1. Integration of artificial intelligence in banking systems
- 3.5. COVID-19 Impact Analysis on the market
CHAPTER 4: CORE BANKING SOFTWARE MARKET, BY COMPONENT
- 4.1. Overview
- 4.1.1. Market size and forecast
- 4.2. Solution
- 4.2.1. Key market trends, growth factors and opportunities
- 4.2.2. Market size and forecast, by region
- 4.2.3. Market share analysis by country
- 4.3. Service
- 4.3.1. Key market trends, growth factors and opportunities
- 4.3.2. Market size and forecast, by region
- 4.3.3. Market share analysis by country
CHAPTER 5: CORE BANKING SOFTWARE MARKET, BY DEPLOYMENT MODEL
- 5.1. Overview
- 5.1.1. Market size and forecast
- 5.2. On-premise
- 5.2.1. Key market trends, growth factors and opportunities
- 5.2.2. Market size and forecast, by region
- 5.2.3. Market share analysis by country
- 5.3. Cloud
- 5.3.1. Key market trends, growth factors and opportunities
- 5.3.2. Market size and forecast, by region
- 5.3.3. Market share analysis by country
CHAPTER 6: CORE BANKING SOFTWARE MARKET, BY END USER
- 6.1. Overview
- 6.1.1. Market size and forecast
- 6.2. Banks
- 6.2.1. Key market trends, growth factors and opportunities
- 6.2.2. Market size and forecast, by region
- 6.2.3. Market share analysis by country
- 6.3. Financial Institutions
- 6.3.1. Key market trends, growth factors and opportunities
- 6.3.2. Market size and forecast, by region
- 6.3.3. Market share analysis by country
- 6.4. Others
- 6.4.1. Key market trends, growth factors and opportunities
- 6.4.2. Market size and forecast, by region
- 6.4.3. Market share analysis by country
CHAPTER 7: CORE BANKING SOFTWARE MARKET, BY REGION
- 7.1. Overview
- 7.1.1. Market size and forecast By Region
- 7.2. North America
- 7.2.1. Key market trends, growth factors and opportunities
- 7.2.2. Market size and forecast, by Component
- 7.2.3. Market size and forecast, by Deployment Model
- 7.2.4. Market size and forecast, by End User
- 7.2.5. Market size and forecast, by country
- 7.2.5.1. U.S.
- 7.2.5.1.1. Market size and forecast, by Component
- 7.2.5.1.2. Market size and forecast, by Deployment Model
- 7.2.5.1.3. Market size and forecast, by End User
- 7.2.5.2. Canada
- 7.2.5.2.1. Market size and forecast, by Component
- 7.2.5.2.2. Market size and forecast, by Deployment Model
- 7.2.5.2.3. Market size and forecast, by End User
- 7.3. Europe
- 7.3.1. Key market trends, growth factors and opportunities
- 7.3.2. Market size and forecast, by Component
- 7.3.3. Market size and forecast, by Deployment Model
- 7.3.4. Market size and forecast, by End User
- 7.3.5. Market size and forecast, by country
- 7.3.5.1. UK
- 7.3.5.1.1. Market size and forecast, by Component
- 7.3.5.1.2. Market size and forecast, by Deployment Model
- 7.3.5.1.3. Market size and forecast, by End User
- 7.3.5.2. Germany
- 7.3.5.2.1. Market size and forecast, by Component
- 7.3.5.2.2. Market size and forecast, by Deployment Model
- 7.3.5.2.3. Market size and forecast, by End User
- 7.3.5.3. France
- 7.3.5.3.1. Market size and forecast, by Component
- 7.3.5.3.2. Market size and forecast, by Deployment Model
- 7.3.5.3.3. Market size and forecast, by End User
- 7.3.5.4. Italy
- 7.3.5.4.1. Market size and forecast, by Component
- 7.3.5.4.2. Market size and forecast, by Deployment Model
- 7.3.5.4.3. Market size and forecast, by End User
- 7.3.5.5. Spain
- 7.3.5.5.1. Market size and forecast, by Component
- 7.3.5.5.2. Market size and forecast, by Deployment Model
- 7.3.5.5.3. Market size and forecast, by End User
- 7.3.5.6. Rest of Europe
- 7.3.5.6.1. Market size and forecast, by Component
- 7.3.5.6.2. Market size and forecast, by Deployment Model
- 7.3.5.6.3. Market size and forecast, by End User
- 7.4. Asia-Pacific
- 7.4.1. Key market trends, growth factors and opportunities
- 7.4.2. Market size and forecast, by Component
- 7.4.3. Market size and forecast, by Deployment Model
- 7.4.4. Market size and forecast, by End User
- 7.4.5. Market size and forecast, by country
- 7.4.5.1. China
- 7.4.5.1.1. Market size and forecast, by Component
- 7.4.5.1.2. Market size and forecast, by Deployment Model
- 7.4.5.1.3. Market size and forecast, by End User
- 7.4.5.2. Japan
- 7.4.5.2.1. Market size and forecast, by Component
- 7.4.5.2.2. Market size and forecast, by Deployment Model
- 7.4.5.2.3. Market size and forecast, by End User
- 7.4.5.3. India
- 7.4.5.3.1. Market size and forecast, by Component
- 7.4.5.3.2. Market size and forecast, by Deployment Model
- 7.4.5.3.3. Market size and forecast, by End User
- 7.4.5.4. Australia
- 7.4.5.4.1. Market size and forecast, by Component
- 7.4.5.4.2. Market size and forecast, by Deployment Model
- 7.4.5.4.3. Market size and forecast, by End User
- 7.4.5.5. South Korea
- 7.4.5.5.1. Market size and forecast, by Component
- 7.4.5.5.2. Market size and forecast, by Deployment Model
- 7.4.5.5.3. Market size and forecast, by End User
- 7.4.5.6. Rest of Asia-Pacific
- 7.4.5.6.1. Market size and forecast, by Component
- 7.4.5.6.2. Market size and forecast, by Deployment Model
- 7.4.5.6.3. Market size and forecast, by End User
- 7.5. LAMEA
- 7.5.1. Key market trends, growth factors and opportunities
- 7.5.2. Market size and forecast, by Component
- 7.5.3. Market size and forecast, by Deployment Model
- 7.5.4. Market size and forecast, by End User
- 7.5.5. Market size and forecast, by country
- 7.5.5.1. Latin America
- 7.5.5.1.1. Market size and forecast, by Component
- 7.5.5.1.2. Market size and forecast, by Deployment Model
- 7.5.5.1.3. Market size and forecast, by End User
- 7.5.5.2. Middle East
- 7.5.5.2.1. Market size and forecast, by Component
- 7.5.5.2.2. Market size and forecast, by Deployment Model
- 7.5.5.2.3. Market size and forecast, by End User
- 7.5.5.3. Africa
- 7.5.5.3.1. Market size and forecast, by Component
- 7.5.5.3.2. Market size and forecast, by Deployment Model
- 7.5.5.3.3. Market size and forecast, by End User
CHAPTER 8: COMPETITIVE LANDSCAPE
- 8.1. Introduction
- 8.2. Top winning strategies
- 8.3. Product Mapping of Top 10 Player
- 8.4. Competitive Dashboard
- 8.5. Competitive Heatmap
- 8.6. Top player positioning, 2022
CHAPTER 9: COMPANY PROFILES
- 9.1. Capgemini SE
- 9.1.1. Company overview
- 9.1.2. Key Executives
- 9.1.3. Company snapshot
- 9.1.4. Operating business segments
- 9.1.5. Product portfolio
- 9.1.6. Business performance
- 9.2. Finastra
- 9.2.1. Company overview
- 9.2.2. Key Executives
- 9.2.3. Company snapshot
- 9.2.4. Operating business segments
- 9.2.5. Product portfolio
- 9.2.6. Key strategic moves and developments
- 9.3. FIS
- 9.3.1. Company overview
- 9.3.2. Key Executives
- 9.3.3. Company snapshot
- 9.3.4. Operating business segments
- 9.3.5. Product portfolio
- 9.3.6. Business performance
- 9.3.7. Key strategic moves and developments
- 9.4. Fiserv, Inc.
- 9.4.1. Company overview
- 9.4.2. Key Executives
- 9.4.3. Company snapshot
- 9.4.4. Operating business segments
- 9.4.5. Product portfolio
- 9.4.6. Business performance
- 9.4.7. Key strategic moves and developments
- 9.5. HCL Technologies Limited
- 9.5.1. Company overview
- 9.5.2. Key Executives
- 9.5.3. Company snapshot
- 9.5.4. Operating business segments
- 9.5.5. Product portfolio
- 9.5.6. Business performance
- 9.5.7. Key strategic moves and developments
- 9.6. Infosys Limited
- 9.6.1. Company overview
- 9.6.2. Key Executives
- 9.6.3. Company snapshot
- 9.6.4. Operating business segments
- 9.6.5. Product portfolio
- 9.6.6. Business performance
- 9.6.7. Key strategic moves and developments
- 9.7. Jack Henry & Associates, Inc.
- 9.7.1. Company overview
- 9.7.2. Key Executives
- 9.7.3. Company snapshot
- 9.7.4. Operating business segments
- 9.7.5. Product portfolio
- 9.7.6. Business performance
- 9.7.7. Key strategic moves and developments
- 9.8. Oracle Corporation
- 9.8.1. Company overview
- 9.8.2. Key Executives
- 9.8.3. Company snapshot
- 9.8.4. Operating business segments
- 9.8.5. Product portfolio
- 9.8.6. Business performance
- 9.8.7. Key strategic moves and developments
- 9.9. Temenos AG
- 9.9.1. Company overview
- 9.9.2. Key Executives
- 9.9.3. Company snapshot
- 9.9.4. Operating business segments
- 9.9.5. Product portfolio
- 9.9.6. Business performance
- 9.9.7. Key strategic moves and developments
- 9.10. Unisys
- 9.10.1. Company overview
- 9.10.2. Key Executives
- 9.10.3. Company snapshot
- 9.10.4. Operating business segments
- 9.10.5. Product portfolio
- 9.10.6. Business performance
LIST OF TABLES
- TABLE 01. GLOBAL CORE BANKING SOFTWARE MARKET, BY COMPONENT, 2022-2032 ($MILLION)
- TABLE 02. CORE BANKING SOFTWARE MARKET FOR SOLUTION, BY REGION, 2022-2032 ($MILLION)
- TABLE 03. CORE BANKING SOFTWARE MARKET FOR SERVICE, BY REGION, 2022-2032 ($MILLION)
- TABLE 04. GLOBAL CORE BANKING SOFTWARE MARKET, BY DEPLOYMENT MODEL, 2022-2032 ($MILLION)
- TABLE 05. CORE BANKING SOFTWARE MARKET FOR ON-PREMISE, BY REGION, 2022-2032 ($MILLION)
- TABLE 06. CORE BANKING SOFTWARE MARKET FOR CLOUD, BY REGION, 2022-2032 ($MILLION)
- TABLE 07. GLOBAL CORE BANKING SOFTWARE MARKET, BY END USER, 2022-2032 ($MILLION)
- TABLE 08. CORE BANKING SOFTWARE MARKET FOR BANKS, BY REGION, 2022-2032 ($MILLION)
- TABLE 09. CORE BANKING SOFTWARE MARKET FOR FINANCIAL INSTITUTIONS, BY REGION, 2022-2032 ($MILLION)
- TABLE 10. CORE BANKING SOFTWARE MARKET FOR OTHERS, BY REGION, 2022-2032 ($MILLION)
- TABLE 11. CORE BANKING SOFTWARE MARKET, BY REGION, 2022-2032 ($MILLION)
- TABLE 12. NORTH AMERICA CORE BANKING SOFTWARE MARKET, BY COMPONENT, 2022-2032 ($MILLION)
- TABLE 13. NORTH AMERICA CORE BANKING SOFTWARE MARKET, BY DEPLOYMENT MODEL, 2022-2032 ($MILLION)
- TABLE 14. NORTH AMERICA CORE BANKING SOFTWARE MARKET, BY END USER, 2022-2032 ($MILLION)
- TABLE 15. NORTH AMERICA CORE BANKING SOFTWARE MARKET, BY COUNTRY, 2022-2032 ($MILLION)
- TABLE 16. U.S. CORE BANKING SOFTWARE MARKET, BY COMPONENT, 2022-2032 ($MILLION)
- TABLE 17. U.S. CORE BANKING SOFTWARE MARKET, BY DEPLOYMENT MODEL, 2022-2032 ($MILLION)
- TABLE 18. U.S. CORE BANKING SOFTWARE MARKET, BY END USER, 2022-2032 ($MILLION)
- TABLE 19. CANADA CORE BANKING SOFTWARE MARKET, BY COMPONENT, 2022-2032 ($MILLION)
- TABLE 20. CANADA CORE BANKING SOFTWARE MARKET, BY DEPLOYMENT MODEL, 2022-2032 ($MILLION)
- TABLE 21. CANADA CORE BANKING SOFTWARE MARKET, BY END USER, 2022-2032 ($MILLION)
- TABLE 22. EUROPE CORE BANKING SOFTWARE MARKET, BY COMPONENT, 2022-2032 ($MILLION)
- TABLE 23. EUROPE CORE BANKING SOFTWARE MARKET, BY DEPLOYMENT MODEL, 2022-2032 ($MILLION)
- TABLE 24. EUROPE CORE BANKING SOFTWARE MARKET, BY END USER, 2022-2032 ($MILLION)
- TABLE 25. EUROPE CORE BANKING SOFTWARE MARKET, BY COUNTRY, 2022-2032 ($MILLION)
- TABLE 26. UK CORE BANKING SOFTWARE MARKET, BY COMPONENT, 2022-2032 ($MILLION)
- TABLE 27. UK CORE BANKING SOFTWARE MARKET, BY DEPLOYMENT MODEL, 2022-2032 ($MILLION)
- TABLE 28. UK CORE BANKING SOFTWARE MARKET, BY END USER, 2022-2032 ($MILLION)
- TABLE 29. GERMANY CORE BANKING SOFTWARE MARKET, BY COMPONENT, 2022-2032 ($MILLION)
- TABLE 30. GERMANY CORE BANKING SOFTWARE MARKET, BY DEPLOYMENT MODEL, 2022-2032 ($MILLION)
- TABLE 31. GERMANY CORE BANKING SOFTWARE MARKET, BY END USER, 2022-2032 ($MILLION)
- TABLE 32. FRANCE CORE BANKING SOFTWARE MARKET, BY COMPONENT, 2022-2032 ($MILLION)
- TABLE 33. FRANCE CORE BANKING SOFTWARE MARKET, BY DEPLOYMENT MODEL, 2022-2032 ($MILLION)
- TABLE 34. FRANCE CORE BANKING SOFTWARE MARKET, BY END USER, 2022-2032 ($MILLION)
- TABLE 35. ITALY CORE BANKING SOFTWARE MARKET, BY COMPONENT, 2022-2032 ($MILLION)
- TABLE 36. ITALY CORE BANKING SOFTWARE MARKET, BY DEPLOYMENT MODEL, 2022-2032 ($MILLION)
- TABLE 37. ITALY CORE BANKING SOFTWARE MARKET, BY END USER, 2022-2032 ($MILLION)
- TABLE 38. SPAIN CORE BANKING SOFTWARE MARKET, BY COMPONENT, 2022-2032 ($MILLION)
- TABLE 39. SPAIN CORE BANKING SOFTWARE MARKET, BY DEPLOYMENT MODEL, 2022-2032 ($MILLION)
- TABLE 40. SPAIN CORE BANKING SOFTWARE MARKET, BY END USER, 2022-2032 ($MILLION)
- TABLE 41. REST OF EUROPE CORE BANKING SOFTWARE MARKET, BY COMPONENT, 2022-2032 ($MILLION)
- TABLE 42. REST OF EUROPE CORE BANKING SOFTWARE MARKET, BY DEPLOYMENT MODEL, 2022-2032 ($MILLION)
- TABLE 43. REST OF EUROPE CORE BANKING SOFTWARE MARKET, BY END USER, 2022-2032 ($MILLION)
- TABLE 44. ASIA-PACIFIC CORE BANKING SOFTWARE MARKET, BY COMPONENT, 2022-2032 ($MILLION)
- TABLE 45. ASIA-PACIFIC CORE BANKING SOFTWARE MARKET, BY DEPLOYMENT MODEL, 2022-2032 ($MILLION)
- TABLE 46. ASIA-PACIFIC CORE BANKING SOFTWARE MARKET, BY END USER, 2022-2032 ($MILLION)
- TABLE 47. ASIA-PACIFIC CORE BANKING SOFTWARE MARKET, BY COUNTRY, 2022-2032 ($MILLION)
- TABLE 48. CHINA CORE BANKING SOFTWARE MARKET, BY COMPONENT, 2022-2032 ($MILLION)
- TABLE 49. CHINA CORE BANKING SOFTWARE MARKET, BY DEPLOYMENT MODEL, 2022-2032 ($MILLION)
- TABLE 50. CHINA CORE BANKING SOFTWARE MARKET, BY END USER, 2022-2032 ($MILLION)
- TABLE 51. JAPAN CORE BANKING SOFTWARE MARKET, BY COMPONENT, 2022-2032 ($MILLION)
- TABLE 52. JAPAN CORE BANKING SOFTWARE MARKET, BY DEPLOYMENT MODEL, 2022-2032 ($MILLION)
- TABLE 53. JAPAN CORE BANKING SOFTWARE MARKET, BY END USER, 2022-2032 ($MILLION)
- TABLE 54. INDIA CORE BANKING SOFTWARE MARKET, BY COMPONENT, 2022-2032 ($MILLION)
- TABLE 55. INDIA CORE BANKING SOFTWARE MARKET, BY DEPLOYMENT MODEL, 2022-2032 ($MILLION)
- TABLE 56. INDIA CORE BANKING SOFTWARE MARKET, BY END USER, 2022-2032 ($MILLION)
- TABLE 57. AUSTRALIA CORE BANKING SOFTWARE MARKET, BY COMPONENT, 2022-2032 ($MILLION)
- TABLE 58. AUSTRALIA CORE BANKING SOFTWARE MARKET, BY DEPLOYMENT MODEL, 2022-2032 ($MILLION)
- TABLE 59. AUSTRALIA CORE BANKING SOFTWARE MARKET, BY END USER, 2022-2032 ($MILLION)
- TABLE 60. SOUTH KOREA CORE BANKING SOFTWARE MARKET, BY COMPONENT, 2022-2032 ($MILLION)
- TABLE 61. SOUTH KOREA CORE BANKING SOFTWARE MARKET, BY DEPLOYMENT MODEL, 2022-2032 ($MILLION)
- TABLE 62. SOUTH KOREA CORE BANKING SOFTWARE MARKET, BY END USER, 2022-2032 ($MILLION)
- TABLE 63. REST OF ASIA-PACIFIC CORE BANKING SOFTWARE MARKET, BY COMPONENT, 2022-2032 ($MILLION)
- TABLE 64. REST OF ASIA-PACIFIC CORE BANKING SOFTWARE MARKET, BY DEPLOYMENT MODEL, 2022-2032 ($MILLION)
- TABLE 65. REST OF ASIA-PACIFIC CORE BANKING SOFTWARE MARKET, BY END USER, 2022-2032 ($MILLION)
- TABLE 66. LAMEA CORE BANKING SOFTWARE MARKET, BY COMPONENT, 2022-2032 ($MILLION)
- TABLE 67. LAMEA CORE BANKING SOFTWARE MARKET, BY DEPLOYMENT MODEL, 2022-2032 ($MILLION)
- TABLE 68. LAMEA CORE BANKING SOFTWARE MARKET, BY END USER, 2022-2032 ($MILLION)
- TABLE 69. LAMEA CORE BANKING SOFTWARE MARKET, BY COUNTRY, 2022-2032 ($MILLION)
- TABLE 70. LATIN AMERICA CORE BANKING SOFTWARE MARKET, BY COMPONENT, 2022-2032 ($MILLION)
- TABLE 71. LATIN AMERICA CORE BANKING SOFTWARE MARKET, BY DEPLOYMENT MODEL, 2022-2032 ($MILLION)
- TABLE 72. LATIN AMERICA CORE BANKING SOFTWARE MARKET, BY END USER, 2022-2032 ($MILLION)
- TABLE 73. MIDDLE EAST CORE BANKING SOFTWARE MARKET, BY COMPONENT, 2022-2032 ($MILLION)
- TABLE 74. MIDDLE EAST CORE BANKING SOFTWARE MARKET, BY DEPLOYMENT MODEL, 2022-2032 ($MILLION)
- TABLE 75. MIDDLE EAST CORE BANKING SOFTWARE MARKET, BY END USER, 2022-2032 ($MILLION)
- TABLE 76. AFRICA CORE BANKING SOFTWARE MARKET, BY COMPONENT, 2022-2032 ($MILLION)
- TABLE 77. AFRICA CORE BANKING SOFTWARE MARKET, BY DEPLOYMENT MODEL, 2022-2032 ($MILLION)
- TABLE 78. AFRICA CORE BANKING SOFTWARE MARKET, BY END USER, 2022-2032 ($MILLION)
- TABLE 79. CAPGEMINI SE: KEY EXECUTIVES
- TABLE 80. CAPGEMINI SE: COMPANY SNAPSHOT
- TABLE 81. CAPGEMINI SE: SERVICE SEGMENTS
- TABLE 82. CAPGEMINI SE: PRODUCT PORTFOLIO
- TABLE 83. FINASTRA: KEY EXECUTIVES
- TABLE 84. FINASTRA: COMPANY SNAPSHOT
- TABLE 85. FINASTRA: SERVICE SEGMENTS
- TABLE 86. FINASTRA: PRODUCT PORTFOLIO
- TABLE 87. FINASTRA: KEY STRATERGIES
- TABLE 88. FIS: KEY EXECUTIVES
- TABLE 89. FIS: COMPANY SNAPSHOT
- TABLE 90. FIS: SERVICE SEGMENTS
- TABLE 91. FIS: PRODUCT PORTFOLIO
- TABLE 92. FIS: KEY STRATERGIES
- TABLE 93. FISERV, INC.: KEY EXECUTIVES
- TABLE 94. FISERV, INC.: COMPANY SNAPSHOT
- TABLE 95. FISERV, INC.: SERVICE SEGMENTS
- TABLE 96. FISERV, INC.: PRODUCT PORTFOLIO
- TABLE 97. FISERV, INC.: KEY STRATERGIES
- TABLE 98. HCL TECHNOLOGIES LIMITED: KEY EXECUTIVES
- TABLE 99. HCL TECHNOLOGIES LIMITED: COMPANY SNAPSHOT
- TABLE 100. HCL TECHNOLOGIES LIMITED: SERVICE SEGMENTS
- TABLE 101. HCL TECHNOLOGIES LIMITED: PRODUCT PORTFOLIO
- TABLE 102. HCL TECHNOLOGIES LIMITED: KEY STRATERGIES
- TABLE 103. INFOSYS LIMITED: KEY EXECUTIVES
- TABLE 104. INFOSYS LIMITED: COMPANY SNAPSHOT
- TABLE 105. INFOSYS LIMITED: SERVICE SEGMENTS
- TABLE 106. INFOSYS LIMITED: PRODUCT PORTFOLIO
- TABLE 107. INFOSYS LIMITED: KEY STRATERGIES
- TABLE 108. JACK HENRY & ASSOCIATES, INC.: KEY EXECUTIVES
- TABLE 109. JACK HENRY & ASSOCIATES, INC.: COMPANY SNAPSHOT
- TABLE 110. JACK HENRY & ASSOCIATES, INC.: SERVICE SEGMENTS
- TABLE 111. JACK HENRY & ASSOCIATES, INC.: PRODUCT PORTFOLIO
- TABLE 112. JACK HENRY & ASSOCIATES, INC.: KEY STRATERGIES
- TABLE 113. ORACLE CORPORATION: KEY EXECUTIVES
- TABLE 114. ORACLE CORPORATION: COMPANY SNAPSHOT
- TABLE 115. ORACLE CORPORATION: SERVICE SEGMENTS
- TABLE 116. ORACLE CORPORATION: PRODUCT PORTFOLIO
- TABLE 117. ORACLE CORPORATION: KEY STRATERGIES
- TABLE 118. TEMENOS AG: KEY EXECUTIVES
- TABLE 119. TEMENOS AG: COMPANY SNAPSHOT
- TABLE 120. TEMENOS AG: SERVICE SEGMENTS
- TABLE 121. TEMENOS AG: PRODUCT PORTFOLIO
- TABLE 122. TEMENOS AG: KEY STRATERGIES
- TABLE 123. UNISYS: KEY EXECUTIVES
- TABLE 124. UNISYS: COMPANY SNAPSHOT
- TABLE 125. UNISYS: SERVICE SEGMENTS
- TABLE 126. UNISYS: PRODUCT PORTFOLIO
LIST OF FIGURES
- FIGURE 01. CORE BANKING SOFTWARE MARKET, 2022-2032
- FIGURE 02. SEGMENTATION OF CORE BANKING SOFTWARE MARKET,2022-2032
- FIGURE 03. TOP INVESTMENT POCKETS IN CORE BANKING SOFTWARE MARKET (2023-2032)
- FIGURE 04. MODERATE TO HIGH BARGAINING POWER OF SUPPLIERS
- FIGURE 05. MODERATE TO HIGH THREAT OF NEW ENTRANTS
- FIGURE 06. MODERATE TO HIGH THREAT OF SUBSTITUTES
- FIGURE 07. LOW TO HIGH INTENSITY OF RIVALRY
- FIGURE 08. LOW TO HIGH BARGAINING POWER OF BUYERS
- FIGURE 09. GLOBAL CORE BANKING SOFTWARE MARKET:DRIVERS, RESTRAINTS AND OPPORTUNITIES
- FIGURE 10. CORE BANKING SOFTWARE MARKET, BY COMPONENT, 2022(%)
- FIGURE 11. COMPARATIVE SHARE ANALYSIS OF CORE BANKING SOFTWARE MARKET FOR SOLUTION, BY COUNTRY 2022 AND 2032(%)
- FIGURE 12. COMPARATIVE SHARE ANALYSIS OF CORE BANKING SOFTWARE MARKET FOR SERVICE, BY COUNTRY 2022 AND 2032(%)
- FIGURE 13. CORE BANKING SOFTWARE MARKET, BY DEPLOYMENT MODEL, 2022(%)
- FIGURE 14. COMPARATIVE SHARE ANALYSIS OF CORE BANKING SOFTWARE MARKET FOR ON-PREMISE, BY COUNTRY 2022 AND 2032(%)
- FIGURE 15. COMPARATIVE SHARE ANALYSIS OF CORE BANKING SOFTWARE MARKET FOR CLOUD, BY COUNTRY 2022 AND 2032(%)
- FIGURE 16. CORE BANKING SOFTWARE MARKET, BY END USER, 2022(%)
- FIGURE 17. COMPARATIVE SHARE ANALYSIS OF CORE BANKING SOFTWARE MARKET FOR BANKS, BY COUNTRY 2022 AND 2032(%)
- FIGURE 18. COMPARATIVE SHARE ANALYSIS OF CORE BANKING SOFTWARE MARKET FOR FINANCIAL INSTITUTIONS, BY COUNTRY 2022 AND 2032(%)
- FIGURE 19. COMPARATIVE SHARE ANALYSIS OF CORE BANKING SOFTWARE MARKET FOR OTHERS, BY COUNTRY 2022 AND 2032(%)
- FIGURE 20. CORE BANKING SOFTWARE MARKET BY REGION, 2022(%)
- FIGURE 21. U.S. CORE BANKING SOFTWARE MARKET, 2022-2032 ($MILLION)
- FIGURE 22. CANADA CORE BANKING SOFTWARE MARKET, 2022-2032 ($MILLION)
- FIGURE 23. UK CORE BANKING SOFTWARE MARKET, 2022-2032 ($MILLION)
- FIGURE 24. GERMANY CORE BANKING SOFTWARE MARKET, 2022-2032 ($MILLION)
- FIGURE 25. FRANCE CORE BANKING SOFTWARE MARKET, 2022-2032 ($MILLION)
- FIGURE 26. ITALY CORE BANKING SOFTWARE MARKET, 2022-2032 ($MILLION)
- FIGURE 27. SPAIN CORE BANKING SOFTWARE MARKET, 2022-2032 ($MILLION)
- FIGURE 28. REST OF EUROPE CORE BANKING SOFTWARE MARKET, 2022-2032 ($MILLION)
- FIGURE 29. CHINA CORE BANKING SOFTWARE MARKET, 2022-2032 ($MILLION)
- FIGURE 30. JAPAN CORE BANKING SOFTWARE MARKET, 2022-2032 ($MILLION)
- FIGURE 31. INDIA CORE BANKING SOFTWARE MARKET, 2022-2032 ($MILLION)
- FIGURE 32. AUSTRALIA CORE BANKING SOFTWARE MARKET, 2022-2032 ($MILLION)
- FIGURE 33. SOUTH KOREA CORE BANKING SOFTWARE MARKET, 2022-2032 ($MILLION)
- FIGURE 34. REST OF ASIA-PACIFIC CORE BANKING SOFTWARE MARKET, 2022-2032 ($MILLION)
- FIGURE 35. LATIN AMERICA CORE BANKING SOFTWARE MARKET, 2022-2032 ($MILLION)
- FIGURE 36. MIDDLE EAST CORE BANKING SOFTWARE MARKET, 2022-2032 ($MILLION)
- FIGURE 37. AFRICA CORE BANKING SOFTWARE MARKET, 2022-2032 ($MILLION)
- FIGURE 38. TOP WINNING STRATEGIES, BY YEAR (2020-2023)
- FIGURE 39. TOP WINNING STRATEGIES, BY DEVELOPMENT (2020-2023)
- FIGURE 40. TOP WINNING STRATEGIES, BY COMPANY (2020-2023)
- FIGURE 41. PRODUCT MAPPING OF TOP 10 PLAYERS
- FIGURE 42. COMPETITIVE DASHBOARD
- FIGURE 43. COMPETITIVE HEATMAP: CORE BANKING SOFTWARE MARKET
- FIGURE 44. TOP PLAYER POSITIONING, 2022
- FIGURE 45. CAPGEMINI SE: NET REVENUE, 2020-2022 ($MILLION)
- FIGURE 46. CAPGEMINI SE: REVENUE SHARE BY REGION, 2022 (%)
- FIGURE 47. FIS: NET REVENUE, 2020-2022 ($MILLION)
- FIGURE 48. FIS: REVENUE SHARE BY SEGMENT, 2022 (%)
- FIGURE 49. FIS: REVENUE SHARE BY REGION, 2022 (%)
- FIGURE 50. FISERV, INC.: NET REVENUE, 2020-2022 ($MILLION)
- FIGURE 51. HCL TECHNOLOGIES LIMITED: NET REVENUE, 2020-2022 ($MILLION)
- FIGURE 52. HCL TECHNOLOGIES LIMITED: REVENUE SHARE BY REGION, 2022 (%)
- FIGURE 53. HCL TECHNOLOGIES LIMITED: REVENUE SHARE BY REGION, 2022 (%)
- FIGURE 54. INFOSYS LIMITED: NET REVENUE, 2020-2022 ($MILLION)
- FIGURE 55. INFOSYS LIMITED: REVENUE SHARE BY SEGMENT, 2022 (%)
- FIGURE 56. INFOSYS LIMITED: REVENUE SHARE BY REGION, 2022 (%)
- FIGURE 57. JACK HENRY & ASSOCIATES, INC.: NET REVENUE, 2020-2022 ($MILLION)
- FIGURE 58. JACK HENRY & ASSOCIATES, INC.: REVENUE SHARE BY SEGMENT, 2022 (%)
- FIGURE 59. ORACLE CORPORATION: NET REVENUE, 2020-2022 ($MILLION)
- FIGURE 60. ORACLE CORPORATION: RESEARCH & DEVELOPMENT EXPENDITURE, 2020-2022 ($MILLION)
- FIGURE 61. ORACLE CORPORATION: REVENUE SHARE BY SEGMENT, 2022 (%)
- FIGURE 62. ORACLE CORPORATION: REVENUE SHARE BY REGION, 2022 (%)
- FIGURE 63. TEMENOS AG: NET REVENUE, 2020-2022 ($MILLION)
- FIGURE 64. TEMENOS AG: REVENUE SHARE BY SEGMENT, 2022 (%)
- FIGURE 65. TEMENOS AG: REVENUE SHARE BY REGION, 2022 (%)
- FIGURE 66. UNISYS: NET REVENUE, 2020-2022 ($MILLION)
- FIGURE 67. UNISYS: REVENUE SHARE BY SEGMENT, 2022 (%)
- FIGURE 68. UNISYS: REVENUE SHARE BY REGION, 2022 (%)
 核心銀行軟體市場規模、佔有率、趨勢分析報告:按組件、部署、最終用途、地區和細分市場預測,2025 年至 2030 年
 2025 年核心銀行軟體全球市場報告
 核心銀行軟體市場:全球 2025-2029
 會計軟體市場:按解決方案、部署和最終用戶分類 - 2025-2030 年全球預測
 核心銀行軟體市場規模、佔有率、成長分析,按解決方案、按服務、按部署、按最終用途、按地區 - 行業預測,2024-2031 年核心銀行軟體的全球市場
 全球核心銀行軟體市場評估:依部署方法、依最終用戶、依組件、依銀行類型、依地區、機會、預測(2017-2031)印度核心銀行軟體市場:依部署、依最終用戶、依組件、依銀行類型、依地區、機會、預測,2018-2032年
 核心銀行軟體市場,佔有率,規模,趨勢,產業分析報告:各解決方案,各類服務,各部署,各最終用途,各地區市場區隔,2024年~2032年的預測