


 |
市場調查報告書
商品編碼
1365644
無縫鋼管市場:按材料、製程和最終用戶分類:2023-2032 年全球機會分析和產業預測Seamless Steel Tubes Market By Material, By Process, By End-User : Global Opportunity Analysis and Industry Forecast, 2023-2032 |
||||||
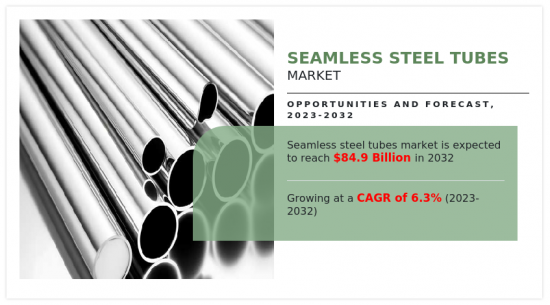
2022年無縫鋼管市場規模預估為455億美元,2023年至2032年年複合成長率為6.3%,2032年將達849億美元。
無縫鋼管是一種特殊類型的中空圓柱形結構,由單塊鋼材透過精密製造程序製成。這種類型的管道可確保成分均勻、增加壓力和耐腐蝕性,並在各個行業中可靠地傳輸流體和氣體。
建設產業正在經歷基礎設施開發的快速成長,包括住宅、商業和公共項目。由於其強度、耐用性和耐腐蝕性,無縫鋼管通常在建築工地用於管道、加熱和結構支撐等任務。汽車領域也正在經歷向現代製造技術和輕質材料的過渡。無縫鋼管經常用於汽車用途,特別是排氣系統,具有更好的性能、耐高溫性和燃油效率。電動車(EV) 的日益普及也要素了電池機殼和其他電動車零件中對無縫鋼管的需求。
無縫鋼管對許多行業至關重要,包括石油、天然氣、製造、建築和汽車行業。由於住宅和商業項目建築領域的強勁擴張,管道、暖氣和結構產業對無縫鋼管的需求不斷增加。此外,由於石油、天然氣產業以海上鑽井和開發為主,因此也需要無縫管來運輸石油、天然氣海底沉積物。此外,無縫管具有較高的拉伸強度,使其能夠承受較大的壓力和應力而不變形或爆裂。它們的耐用性使其成為石油、天然氣、石化、電力和汽車行業的理想選擇。
無縫鋼管的製造成本直接受鐵礦石、廢金屬等原料價格波動的影響。當原料成本上升時,無縫鋼管製造商將面臨在保持競爭的價格的同時確保盈利的挑戰。這些限制預計將影響建築、汽車和能源等行業最終用戶的無縫鋼管的成本和可用性,從而限制行業成長。尤其是汽車、建築和能源領域的客戶對環保和低碳解決方案的要求越來越高。透過使用低排放氣體,鋼鐵公司預計將提供符合嚴格環保標準的無縫鋼管,吸引具有環保意識的客戶,並在市場上獲得競爭優勢。預計此類事件將為市場成長提供機會。
目錄
第1章 簡介
第2章 執行摘要
第3章 市場概況
- 市場定義和範圍
- 主要發現
- 影響要素
- 主要投資機會
- 波特五力分析
- 市場動態
- 促進因素
- 鋼鐵業成長帶動無縫鋼管消費快速成長
- 汽車和建築業加強無縫鋼管市場
- 抑制因素
- 無縫鋼管原料高成本
- 機會
- 投資低排放熔爐。
- 促進因素
- COVID-19 市場影響分析
第4章 無縫鋼管市場:依材質分類
- 概述
- 碳鋼
- 不銹鋼
- 合金鋼
- 其他
第5章 無縫鋼管市場:依製程分類
- 概述
- 軋延
- 軋延
第6章 無縫鋼管市場:依最終用戶分類
- 概述
- 石油、天然氣
- 汽車
- 建造
- 能源/電力
- 其他
第7章 無縫鋼管市場:按地區
- 概述
- 北美洲
- 美國
- 加拿大
- 墨西哥
- 歐洲
- 德國
- 法國
- 義大利
- 英國
- 其他
- 亞太地區
- 中國
- 日本
- 印度
- 韓國
- 其他
- 拉丁美洲
- 拉丁美洲
- 中東
- 非洲
第8章 競爭形勢
- 介紹
- 關鍵成功策略
- 10家主要企業產品圖譜
- 競爭儀表板
- 競爭熱圖
- 2022年主要企業定位
第9章 公司簡介
- ArcelorMittal
- Jindal Saw Limited
- Nippon Steel Corporation
- Sandvik AB
- Shandong Tanglu Metal Material Co., Ltd
- Tata Steel Limited
- Tenaris SA.
- United States Steel Corporation
- Vallourec SA
- Shenqiang Steel Manufacturing Co., Ltd.
According to a new report published by Allied Market Research, titled, "Seamless Steel Tubes Market," The seamless steel tubes market was valued at $45.5 billion in 2022, and is estimated to reach $84.9 billion by 2032, growing at a CAGR of 6.3% from 2023 to 2032. A seamless steel tube is a specific kind of hollow cylindrical structure made from a single steel billet using a precise manufacturing process. This type of tube ensures a uniform composition, improved pressure and corrosion resistance, and reliable transmission of fluids and gases across various industries.
The construction industry has experienced a surge in infrastructure development, including residential, commercial, and public projects. Seamless steel tubes are often used in construction for tasks such as plumbing, heating, and structural support due to their strength, durability, and resistance to corrosion. In the automotive sector, there are similar movements toward modern manufacturing techniques and lightweight materials. Seamless steel tubes are frequently used in automotive applications, particularly in exhaust systems where they offer better performance, high-temperature resistance, and enhanced fuel efficiency. The growth in popularity in electric vehicles (EVs) is another factor which drives the demand for seamless steel tubes in battery enclosures and other EV parts.
Seamless tubes are crucial to many industries, including oil & gas, manufacturing, construction, and the automobile sector. There is an increase in demand for seamless tubes in the plumbing, heating, and structural industries due to strong expansion of building sectors in both residential and commercial projects. In addition, seamless tubes are required for the transfer of oil & gas sea deposits as the oil & gas industry places greater emphasis on offshore drilling and development. In addition, seamless tubes are able to sustain tremendous pressure and stress without deforming or rupturing due to their great tensile strength. They are perfect for use in the oil & gas, petrochemical, power, and automotive industries due to their durability.
The overall cost of manufacturing seamless steel tubes is directly affected by changes in the price of raw materials such as iron ore and scrap metal. Seamless steel tube producers find it challenging to maintain competitive pricing while ensuring profitability when raw material costs rise. Such restrictions are projected to impact the cost and accessibility of seamless steel tubes for end users in industries such as construction, automotive, and energy and restrain industry growth. Customers, notably those in the automotive, construction, and energy sectors, increasingly seek out environment-friendly and low-carbon solutions. Steel companies are projected to provide seamless steel tubes that abide by stringent environmental standards by using low-emission furnaces, attracting eco-conscious customers, and gaining a competitive edge in the market. Such occurrences are thus anticipated to provide opportunities for market growth.
The seamless steel tubes market is segmented on the basis of material, process, end user and region. On the basis of material, the market is divided into carbon steel, stainless steel, alloy steel, and others. On the basis of process, it is bifurcated into cold rolled and hot rolled. On the basis of end user, it is classified into oil & gas, automotive, construction, energy & power, others. On the basis of region, the market is analyzed across North America, Europe, Asia-Pacific, and LAMEA.
Competition Analysis
The major players profiled in the seamless steel tubes market include ArcelorMittal S.A., Jindal SAW Ltd., Nippon Steel Corporation, Sandvik AB, Shandong Tanglu Metal Material Co., Ltd, SHENQIANG STEEL MANUFACTURING CO., LTD., TATA Steel, Tenaris., United States Steel Corporation., and Vallourec S.A. Major companies in the market have adopted acquisition, partnership, and business expansion as their key developmental strategies to offer better products and services to customers in the seamless steel tubes market.
Key Benefits For Stakeholders
- This report provides a quantitative analysis of the market segments, current trends, estimations, and dynamics of the seamless steel tubes market analysis from 2022 to 2032 to identify the prevailing seamless steel tubes market opportunities.
- The market research is offered along with information related to key drivers, restraints, and opportunities.
- Porter's five forces analysis highlights the potency of buyers and suppliers to enable stakeholders make profit-oriented business decisions and strengthen their supplier-buyer network.
- In-depth analysis of the seamless steel tubes market segmentation assists to determine the prevailing market opportunities.
- Major countries in each region are mapped according to their revenue contribution to the global market.
- Market player positioning facilitates benchmarking and provides a clear understanding of the present position of the market players.
- The report includes the analysis of the regional as well as global seamless steel tubes market trends, key players, market segments, application areas, and market growth strategies.
Additional benefits you will get with this purchase are:
- Quarterly Update and* (only available with a corporate license, on listed price)
- 5 additional Company Profile of client Choice pre- or Post-purchase, as a free update.
- Free Upcoming Version on the Purchase of Five and Enterprise User License.
- 16 analyst hours of support* (post-purchase, if you find additional data requirements upon review of the report, you may receive support amounting to 16 analyst hours to solve questions, and post-sale queries)
- 15% Free Customization* (in case the scope or segment of the report does not match your requirements, 20% is equivalent to 3 working days of free work, applicable once)
- Free data Pack on the Five and Enterprise User License. (Excel version of the report)
- Free Updated report if the report is 6-12 months old or older.
- 24-hour priority response*
- Free Industry updates and white papers.
Possible Customization with this report (with additional cost and timeline talk to the sales executive to know more)
- Manufacturing Capacity
- Investment Opportunities
- Technology Trend Analysis
- Go To Market Strategy
- Additional company profiles with specific to client's interest
- Additional country or region analysis- market size and forecast
- Average Selling Price Analysis / Price Point Analysis
- Brands Share Analysis
- Expanded list for Company Profiles
- Historic market data
- List of customers/consumers/raw material suppliers- value chain analysis
- Per Capita Consumption Trends
- Product Consumption Analysis
- SWOT Analysis
- Volume Market Size and Forecast
Key Market Segments
By Material
- Stainless Steel
- Alloy Steel
- Others
- Carbon Steel
By Process
- Cold Rolled
- Hot Rolled
By End-User
- Oil and Gas
- Automotive
- Construction
- Energy and Power
- Others
By Region
- North America
- U.S.
- Canada
- Mexico
- Europe
- Germany
- France
- Italy
- UK
- Rest of Europe
- Asia-Pacific
- China
- Japan
- India
- South Korea
- Rest of Asia-Pacific
- LAMEA
- Latin America
- Middle East
- Africa
Key Market Players:
- ArcelorMittal
- Jindal Saw Limited
- Nippon Steel Corporation
- Sandvik AB
- Shandong Tanglu Metal Material Co., Ltd
- Shenqiang Steel Manufacturing Co., Ltd.
- Tata Steel Limited
- Tenaris SA.
- United States Steel Corporation
- Vallourec SA
TABLE OF CONTENTS
CHAPTER 1: INTRODUCTION
- 1.1. Report description
- 1.2. Key market segments
- 1.3. Key benefits to the stakeholders
- 1.4. Research Methodology
- 1.4.1. Primary research
- 1.4.2. Secondary research
- 1.4.3. Analyst tools and models
CHAPTER 2: EXECUTIVE SUMMARY
- 2.1. CXO Perspective
CHAPTER 3: MARKET OVERVIEW
- 3.1. Market definition and scope
- 3.2. Key findings
- 3.2.1. Top impacting factors
- 3.2.2. Top investment pockets
- 3.3. Porter's five forces analysis
- 3.3.1. Low bargaining power of suppliers
- 3.3.2. Low threat of new entrants
- 3.3.3. Low threat of substitutes
- 3.3.4. Low intensity of rivalry
- 3.3.5. Low bargaining power of buyers
- 3.4. Market dynamics
- 3.4.1. Drivers
- 3.4.1.1. Growth in steel industry surging seamless tube consumption.
- 3.4.1.2. Automotive and construction sectors strengthening for seamless steel tube market
- 3.4.1. Drivers
- 3.4.2. Restraints
- 3.4.2.1. High cost of seamless tube raw material.
- 3.4.3. Opportunities
- 3.4.3.1. Investment in low-emission furnaces.
- 3.5. COVID-19 Impact Analysis on the market
CHAPTER 4: SEAMLESS STEEL TUBES MARKET, BY MATERIAL
- 4.1. Overview
- 4.1.1. Market size and forecast
- 4.2. Carbon Steel
- 4.2.1. Key market trends, growth factors and opportunities
- 4.2.2. Market size and forecast, by region
- 4.2.3. Market share analysis by country
- 4.3. Stainless Steel
- 4.3.1. Key market trends, growth factors and opportunities
- 4.3.2. Market size and forecast, by region
- 4.3.3. Market share analysis by country
- 4.4. Alloy Steel
- 4.4.1. Key market trends, growth factors and opportunities
- 4.4.2. Market size and forecast, by region
- 4.4.3. Market share analysis by country
- 4.5. Others
- 4.5.1. Key market trends, growth factors and opportunities
- 4.5.2. Market size and forecast, by region
- 4.5.3. Market share analysis by country
CHAPTER 5: SEAMLESS STEEL TUBES MARKET, BY PROCESS
- 5.1. Overview
- 5.1.1. Market size and forecast
- 5.2. Cold Rolled
- 5.2.1. Key market trends, growth factors and opportunities
- 5.2.2. Market size and forecast, by region
- 5.2.3. Market share analysis by country
- 5.3. Hot Rolled
- 5.3.1. Key market trends, growth factors and opportunities
- 5.3.2. Market size and forecast, by region
- 5.3.3. Market share analysis by country
CHAPTER 6: SEAMLESS STEEL TUBES MARKET, BY END-USER
- 6.1. Overview
- 6.1.1. Market size and forecast
- 6.2. Oil and Gas
- 6.2.1. Key market trends, growth factors and opportunities
- 6.2.2. Market size and forecast, by region
- 6.2.3. Market share analysis by country
- 6.3. Automotive
- 6.3.1. Key market trends, growth factors and opportunities
- 6.3.2. Market size and forecast, by region
- 6.3.3. Market share analysis by country
- 6.4. Construction
- 6.4.1. Key market trends, growth factors and opportunities
- 6.4.2. Market size and forecast, by region
- 6.4.3. Market share analysis by country
- 6.5. Energy and Power
- 6.5.1. Key market trends, growth factors and opportunities
- 6.5.2. Market size and forecast, by region
- 6.5.3. Market share analysis by country
- 6.6. Others
- 6.6.1. Key market trends, growth factors and opportunities
- 6.6.2. Market size and forecast, by region
- 6.6.3. Market share analysis by country
CHAPTER 7: SEAMLESS STEEL TUBES MARKET, BY REGION
- 7.1. Overview
- 7.1.1. Market size and forecast By Region
- 7.2. North America
- 7.2.1. Key trends and opportunities
- 7.2.2. Market size and forecast, by Material
- 7.2.3. Market size and forecast, by Process
- 7.2.4. Market size and forecast, by End-User
- 7.2.5. Market size and forecast, by country
- 7.2.5.1. U.S.
- 7.2.5.1.1. Key market trends, growth factors and opportunities
- 7.2.5.1.2. Market size and forecast, by Material
- 7.2.5.1.3. Market size and forecast, by Process
- 7.2.5.1.4. Market size and forecast, by End-User
- 7.2.5.2. Canada
- 7.2.5.2.1. Key market trends, growth factors and opportunities
- 7.2.5.2.2. Market size and forecast, by Material
- 7.2.5.2.3. Market size and forecast, by Process
- 7.2.5.2.4. Market size and forecast, by End-User
- 7.2.5.3. Mexico
- 7.2.5.3.1. Key market trends, growth factors and opportunities
- 7.2.5.3.2. Market size and forecast, by Material
- 7.2.5.3.3. Market size and forecast, by Process
- 7.2.5.3.4. Market size and forecast, by End-User
- 7.3. Europe
- 7.3.1. Key trends and opportunities
- 7.3.2. Market size and forecast, by Material
- 7.3.3. Market size and forecast, by Process
- 7.3.4. Market size and forecast, by End-User
- 7.3.5. Market size and forecast, by country
- 7.3.5.1. Germany
- 7.3.5.1.1. Key market trends, growth factors and opportunities
- 7.3.5.1.2. Market size and forecast, by Material
- 7.3.5.1.3. Market size and forecast, by Process
- 7.3.5.1.4. Market size and forecast, by End-User
- 7.3.5.2. France
- 7.3.5.2.1. Key market trends, growth factors and opportunities
- 7.3.5.2.2. Market size and forecast, by Material
- 7.3.5.2.3. Market size and forecast, by Process
- 7.3.5.2.4. Market size and forecast, by End-User
- 7.3.5.3. Italy
- 7.3.5.3.1. Key market trends, growth factors and opportunities
- 7.3.5.3.2. Market size and forecast, by Material
- 7.3.5.3.3. Market size and forecast, by Process
- 7.3.5.3.4. Market size and forecast, by End-User
- 7.3.5.4. UK
- 7.3.5.4.1. Key market trends, growth factors and opportunities
- 7.3.5.4.2. Market size and forecast, by Material
- 7.3.5.4.3. Market size and forecast, by Process
- 7.3.5.4.4. Market size and forecast, by End-User
- 7.3.5.5. Rest of Europe
- 7.3.5.5.1. Key market trends, growth factors and opportunities
- 7.3.5.5.2. Market size and forecast, by Material
- 7.3.5.5.3. Market size and forecast, by Process
- 7.3.5.5.4. Market size and forecast, by End-User
- 7.4. Asia-Pacific
- 7.4.1. Key trends and opportunities
- 7.4.2. Market size and forecast, by Material
- 7.4.3. Market size and forecast, by Process
- 7.4.4. Market size and forecast, by End-User
- 7.4.5. Market size and forecast, by country
- 7.4.5.1. China
- 7.4.5.1.1. Key market trends, growth factors and opportunities
- 7.4.5.1.2. Market size and forecast, by Material
- 7.4.5.1.3. Market size and forecast, by Process
- 7.4.5.1.4. Market size and forecast, by End-User
- 7.4.5.2. Japan
- 7.4.5.2.1. Key market trends, growth factors and opportunities
- 7.4.5.2.2. Market size and forecast, by Material
- 7.4.5.2.3. Market size and forecast, by Process
- 7.4.5.2.4. Market size and forecast, by End-User
- 7.4.5.3. India
- 7.4.5.3.1. Key market trends, growth factors and opportunities
- 7.4.5.3.2. Market size and forecast, by Material
- 7.4.5.3.3. Market size and forecast, by Process
- 7.4.5.3.4. Market size and forecast, by End-User
- 7.4.5.4. South Korea
- 7.4.5.4.1. Key market trends, growth factors and opportunities
- 7.4.5.4.2. Market size and forecast, by Material
- 7.4.5.4.3. Market size and forecast, by Process
- 7.4.5.4.4. Market size and forecast, by End-User
- 7.4.5.5. Rest of Asia-Pacific
- 7.4.5.5.1. Key market trends, growth factors and opportunities
- 7.4.5.5.2. Market size and forecast, by Material
- 7.4.5.5.3. Market size and forecast, by Process
- 7.4.5.5.4. Market size and forecast, by End-User
- 7.5. LAMEA
- 7.5.1. Key trends and opportunities
- 7.5.2. Market size and forecast, by Material
- 7.5.3. Market size and forecast, by Process
- 7.5.4. Market size and forecast, by End-User
- 7.5.5. Market size and forecast, by country
- 7.5.5.1. Latin America
- 7.5.5.1.1. Key market trends, growth factors and opportunities
- 7.5.5.1.2. Market size and forecast, by Material
- 7.5.5.1.3. Market size and forecast, by Process
- 7.5.5.1.4. Market size and forecast, by End-User
- 7.5.5.2. Middle East
- 7.5.5.2.1. Key market trends, growth factors and opportunities
- 7.5.5.2.2. Market size and forecast, by Material
- 7.5.5.2.3. Market size and forecast, by Process
- 7.5.5.2.4. Market size and forecast, by End-User
- 7.5.5.3. Africa
- 7.5.5.3.1. Key market trends, growth factors and opportunities
- 7.5.5.3.2. Market size and forecast, by Material
- 7.5.5.3.3. Market size and forecast, by Process
- 7.5.5.3.4. Market size and forecast, by End-User
CHAPTER 8: COMPETITIVE LANDSCAPE
- 8.1. Introduction
- 8.2. Top winning strategies
- 8.3. Product Mapping of Top 10 Player
- 8.4. Competitive Dashboard
- 8.5. Competitive Heatmap
- 8.6. Top player positioning, 2022
CHAPTER 9: COMPANY PROFILES
- 9.1. ArcelorMittal
- 9.1.1. Company overview
- 9.1.2. Key Executives
- 9.1.3. Company snapshot
- 9.1.4. Operating business segments
- 9.1.5. Product portfolio
- 9.1.6. Business performance
- 9.1.7. Key strategic moves and developments
- 9.2. Jindal Saw Limited
- 9.2.1. Company overview
- 9.2.2. Key Executives
- 9.2.3. Company snapshot
- 9.2.4. Operating business segments
- 9.2.5. Product portfolio
- 9.2.6. Business performance
- 9.2.7. Key strategic moves and developments
- 9.3. Nippon Steel Corporation
- 9.3.1. Company overview
- 9.3.2. Key Executives
- 9.3.3. Company snapshot
- 9.3.4. Operating business segments
- 9.3.5. Product portfolio
- 9.3.6. Business performance
- 9.4. Sandvik AB
- 9.4.1. Company overview
- 9.4.2. Key Executives
- 9.4.3. Company snapshot
- 9.4.4. Operating business segments
- 9.4.5. Product portfolio
- 9.4.6. Business performance
- 9.5. Shandong Tanglu Metal Material Co., Ltd
- 9.5.1. Company overview
- 9.5.2. Key Executives
- 9.5.3. Company snapshot
- 9.5.4. Operating business segments
- 9.5.5. Product portfolio
- 9.6. Tata Steel Limited
- 9.6.1. Company overview
- 9.6.2. Key Executives
- 9.6.3. Company snapshot
- 9.6.4. Operating business segments
- 9.6.5. Product portfolio
- 9.6.6. Business performance
- 9.6.7. Key strategic moves and developments
- 9.7. Tenaris SA.
- 9.7.1. Company overview
- 9.7.2. Key Executives
- 9.7.3. Company snapshot
- 9.7.4. Operating business segments
- 9.7.5. Product portfolio
- 9.7.6. Business performance
- 9.8. United States Steel Corporation
- 9.8.1. Company overview
- 9.8.2. Key Executives
- 9.8.3. Company snapshot
- 9.8.4. Operating business segments
- 9.8.5. Product portfolio
- 9.8.6. Business performance
- 9.9. Vallourec SA
- 9.9.1. Company overview
- 9.9.2. Key Executives
- 9.9.3. Company snapshot
- 9.9.4. Operating business segments
- 9.9.5. Product portfolio
- 9.9.6. Business performance
- 9.10. Shenqiang Steel Manufacturing Co., Ltd.
- 9.10.1. Company overview
- 9.10.2. Key Executives
- 9.10.3. Company snapshot
- 9.10.4. Operating business segments
- 9.10.5. Product portfolio
LIST OF TABLES
- TABLE 01. GLOBAL SEAMLESS STEEL TUBES MARKET, BY MATERIAL, 2022-2032 ($MILLION)
- TABLE 02. SEAMLESS STEEL TUBES MARKET FOR CARBON STEEL, BY REGION, 2022-2032 ($MILLION)
- TABLE 03. SEAMLESS STEEL TUBES MARKET FOR STAINLESS STEEL, BY REGION, 2022-2032 ($MILLION)
- TABLE 04. SEAMLESS STEEL TUBES MARKET FOR ALLOY STEEL, BY REGION, 2022-2032 ($MILLION)
- TABLE 05. SEAMLESS STEEL TUBES MARKET FOR OTHERS, BY REGION, 2022-2032 ($MILLION)
- TABLE 06. GLOBAL SEAMLESS STEEL TUBES MARKET, BY PROCESS, 2022-2032 ($MILLION)
- TABLE 07. SEAMLESS STEEL TUBES MARKET FOR COLD ROLLED, BY REGION, 2022-2032 ($MILLION)
- TABLE 08. SEAMLESS STEEL TUBES MARKET FOR HOT ROLLED, BY REGION, 2022-2032 ($MILLION)
- TABLE 09. GLOBAL SEAMLESS STEEL TUBES MARKET, BY END-USER, 2022-2032 ($MILLION)
- TABLE 10. SEAMLESS STEEL TUBES MARKET FOR OIL AND GAS, BY REGION, 2022-2032 ($MILLION)
- TABLE 11. SEAMLESS STEEL TUBES MARKET FOR AUTOMOTIVE, BY REGION, 2022-2032 ($MILLION)
- TABLE 12. SEAMLESS STEEL TUBES MARKET FOR CONSTRUCTION, BY REGION, 2022-2032 ($MILLION)
- TABLE 13. SEAMLESS STEEL TUBES MARKET FOR ENERGY AND POWER, BY REGION, 2022-2032 ($MILLION)
- TABLE 14. SEAMLESS STEEL TUBES MARKET FOR OTHERS, BY REGION, 2022-2032 ($MILLION)
- TABLE 15. SEAMLESS STEEL TUBES MARKET, BY REGION, 2022-2032 ($MILLION)
- TABLE 16. NORTH AMERICA SEAMLESS STEEL TUBES MARKET, BY MATERIAL, 2022-2032 ($MILLION)
- TABLE 17. NORTH AMERICA SEAMLESS STEEL TUBES MARKET, BY PROCESS, 2022-2032 ($MILLION)
- TABLE 18. NORTH AMERICA SEAMLESS STEEL TUBES MARKET, BY END-USER, 2022-2032 ($MILLION)
- TABLE 19. NORTH AMERICA SEAMLESS STEEL TUBES MARKET, BY COUNTRY, 2022-2032 ($MILLION)
- TABLE 20. U.S. SEAMLESS STEEL TUBES MARKET, BY MATERIAL, 2022-2032 ($MILLION)
- TABLE 21. U.S. SEAMLESS STEEL TUBES MARKET, BY PROCESS, 2022-2032 ($MILLION)
- TABLE 22. U.S. SEAMLESS STEEL TUBES MARKET, BY END-USER, 2022-2032 ($MILLION)
- TABLE 23. CANADA SEAMLESS STEEL TUBES MARKET, BY MATERIAL, 2022-2032 ($MILLION)
- TABLE 24. CANADA SEAMLESS STEEL TUBES MARKET, BY PROCESS, 2022-2032 ($MILLION)
- TABLE 25. CANADA SEAMLESS STEEL TUBES MARKET, BY END-USER, 2022-2032 ($MILLION)
- TABLE 26. MEXICO SEAMLESS STEEL TUBES MARKET, BY MATERIAL, 2022-2032 ($MILLION)
- TABLE 27. MEXICO SEAMLESS STEEL TUBES MARKET, BY PROCESS, 2022-2032 ($MILLION)
- TABLE 28. MEXICO SEAMLESS STEEL TUBES MARKET, BY END-USER, 2022-2032 ($MILLION)
- TABLE 29. EUROPE SEAMLESS STEEL TUBES MARKET, BY MATERIAL, 2022-2032 ($MILLION)
- TABLE 30. EUROPE SEAMLESS STEEL TUBES MARKET, BY PROCESS, 2022-2032 ($MILLION)
- TABLE 31. EUROPE SEAMLESS STEEL TUBES MARKET, BY END-USER, 2022-2032 ($MILLION)
- TABLE 32. EUROPE SEAMLESS STEEL TUBES MARKET, BY COUNTRY, 2022-2032 ($MILLION)
- TABLE 33. GERMANY SEAMLESS STEEL TUBES MARKET, BY MATERIAL, 2022-2032 ($MILLION)
- TABLE 34. GERMANY SEAMLESS STEEL TUBES MARKET, BY PROCESS, 2022-2032 ($MILLION)
- TABLE 35. GERMANY SEAMLESS STEEL TUBES MARKET, BY END-USER, 2022-2032 ($MILLION)
- TABLE 36. FRANCE SEAMLESS STEEL TUBES MARKET, BY MATERIAL, 2022-2032 ($MILLION)
- TABLE 37. FRANCE SEAMLESS STEEL TUBES MARKET, BY PROCESS, 2022-2032 ($MILLION)
- TABLE 38. FRANCE SEAMLESS STEEL TUBES MARKET, BY END-USER, 2022-2032 ($MILLION)
- TABLE 39. ITALY SEAMLESS STEEL TUBES MARKET, BY MATERIAL, 2022-2032 ($MILLION)
- TABLE 40. ITALY SEAMLESS STEEL TUBES MARKET, BY PROCESS, 2022-2032 ($MILLION)
- TABLE 41. ITALY SEAMLESS STEEL TUBES MARKET, BY END-USER, 2022-2032 ($MILLION)
- TABLE 42. UK SEAMLESS STEEL TUBES MARKET, BY MATERIAL, 2022-2032 ($MILLION)
- TABLE 43. UK SEAMLESS STEEL TUBES MARKET, BY PROCESS, 2022-2032 ($MILLION)
- TABLE 44. UK SEAMLESS STEEL TUBES MARKET, BY END-USER, 2022-2032 ($MILLION)
- TABLE 45. REST OF EUROPE SEAMLESS STEEL TUBES MARKET, BY MATERIAL, 2022-2032 ($MILLION)
- TABLE 46. REST OF EUROPE SEAMLESS STEEL TUBES MARKET, BY PROCESS, 2022-2032 ($MILLION)
- TABLE 47. REST OF EUROPE SEAMLESS STEEL TUBES MARKET, BY END-USER, 2022-2032 ($MILLION)
- TABLE 48. ASIA-PACIFIC SEAMLESS STEEL TUBES MARKET, BY MATERIAL, 2022-2032 ($MILLION)
- TABLE 49. ASIA-PACIFIC SEAMLESS STEEL TUBES MARKET, BY PROCESS, 2022-2032 ($MILLION)
- TABLE 50. ASIA-PACIFIC SEAMLESS STEEL TUBES MARKET, BY END-USER, 2022-2032 ($MILLION)
- TABLE 51. ASIA-PACIFIC SEAMLESS STEEL TUBES MARKET, BY COUNTRY, 2022-2032 ($MILLION)
- TABLE 52. CHINA SEAMLESS STEEL TUBES MARKET, BY MATERIAL, 2022-2032 ($MILLION)
- TABLE 53. CHINA SEAMLESS STEEL TUBES MARKET, BY PROCESS, 2022-2032 ($MILLION)
- TABLE 54. CHINA SEAMLESS STEEL TUBES MARKET, BY END-USER, 2022-2032 ($MILLION)
- TABLE 55. JAPAN SEAMLESS STEEL TUBES MARKET, BY MATERIAL, 2022-2032 ($MILLION)
- TABLE 56. JAPAN SEAMLESS STEEL TUBES MARKET, BY PROCESS, 2022-2032 ($MILLION)
- TABLE 57. JAPAN SEAMLESS STEEL TUBES MARKET, BY END-USER, 2022-2032 ($MILLION)
- TABLE 58. INDIA SEAMLESS STEEL TUBES MARKET, BY MATERIAL, 2022-2032 ($MILLION)
- TABLE 59. INDIA SEAMLESS STEEL TUBES MARKET, BY PROCESS, 2022-2032 ($MILLION)
- TABLE 60. INDIA SEAMLESS STEEL TUBES MARKET, BY END-USER, 2022-2032 ($MILLION)
- TABLE 61. SOUTH KOREA SEAMLESS STEEL TUBES MARKET, BY MATERIAL, 2022-2032 ($MILLION)
- TABLE 62. SOUTH KOREA SEAMLESS STEEL TUBES MARKET, BY PROCESS, 2022-2032 ($MILLION)
- TABLE 63. SOUTH KOREA SEAMLESS STEEL TUBES MARKET, BY END-USER, 2022-2032 ($MILLION)
- TABLE 64. REST OF ASIA-PACIFIC SEAMLESS STEEL TUBES MARKET, BY MATERIAL, 2022-2032 ($MILLION)
- TABLE 65. REST OF ASIA-PACIFIC SEAMLESS STEEL TUBES MARKET, BY PROCESS, 2022-2032 ($MILLION)
- TABLE 66. REST OF ASIA-PACIFIC SEAMLESS STEEL TUBES MARKET, BY END-USER, 2022-2032 ($MILLION)
- TABLE 67. LAMEA SEAMLESS STEEL TUBES MARKET, BY MATERIAL, 2022-2032 ($MILLION)
- TABLE 68. LAMEA SEAMLESS STEEL TUBES MARKET, BY PROCESS, 2022-2032 ($MILLION)
- TABLE 69. LAMEA SEAMLESS STEEL TUBES MARKET, BY END-USER, 2022-2032 ($MILLION)
- TABLE 70. LAMEA SEAMLESS STEEL TUBES MARKET, BY COUNTRY, 2022-2032 ($MILLION)
- TABLE 71. LATIN AMERICA SEAMLESS STEEL TUBES MARKET, BY MATERIAL, 2022-2032 ($MILLION)
- TABLE 72. LATIN AMERICA SEAMLESS STEEL TUBES MARKET, BY PROCESS, 2022-2032 ($MILLION)
- TABLE 73. LATIN AMERICA SEAMLESS STEEL TUBES MARKET, BY END-USER, 2022-2032 ($MILLION)
- TABLE 74. MIDDLE EAST SEAMLESS STEEL TUBES MARKET, BY MATERIAL, 2022-2032 ($MILLION)
- TABLE 75. MIDDLE EAST SEAMLESS STEEL TUBES MARKET, BY PROCESS, 2022-2032 ($MILLION)
- TABLE 76. MIDDLE EAST SEAMLESS STEEL TUBES MARKET, BY END-USER, 2022-2032 ($MILLION)
- TABLE 77. AFRICA SEAMLESS STEEL TUBES MARKET, BY MATERIAL, 2022-2032 ($MILLION)
- TABLE 78. AFRICA SEAMLESS STEEL TUBES MARKET, BY PROCESS, 2022-2032 ($MILLION)
- TABLE 79. AFRICA SEAMLESS STEEL TUBES MARKET, BY END-USER, 2022-2032 ($MILLION)
- TABLE 80. ARCELORMITTAL: KEY EXECUTIVES
- TABLE 81. ARCELORMITTAL: COMPANY SNAPSHOT
- TABLE 82. ARCELORMITTAL: SERVICE SEGMENTS
- TABLE 83. ARCELORMITTAL: PRODUCT PORTFOLIO
- TABLE 84. ARCELORMITTAL: KEY STRATERGIES
- TABLE 85. JINDAL SAW LIMITED: KEY EXECUTIVES
- TABLE 86. JINDAL SAW LIMITED: COMPANY SNAPSHOT
- TABLE 87. JINDAL SAW LIMITED: PRODUCT SEGMENTS
- TABLE 88. JINDAL SAW LIMITED: PRODUCT PORTFOLIO
- TABLE 89. JINDAL SAW LIMITED: KEY STRATERGIES
- TABLE 90. NIPPON STEEL CORPORATION: KEY EXECUTIVES
- TABLE 91. NIPPON STEEL CORPORATION: COMPANY SNAPSHOT
- TABLE 92. NIPPON STEEL CORPORATION: PRODUCT SEGMENTS
- TABLE 93. NIPPON STEEL CORPORATION: PRODUCT PORTFOLIO
- TABLE 94. SANDVIK AB: KEY EXECUTIVES
- TABLE 95. SANDVIK AB: COMPANY SNAPSHOT
- TABLE 96. SANDVIK AB: SERVICE SEGMENTS
- TABLE 97. SANDVIK AB: PRODUCT PORTFOLIO
- TABLE 98. SHANDONG TANGLU METAL MATERIAL CO., LTD: KEY EXECUTIVES
- TABLE 99. SHANDONG TANGLU METAL MATERIAL CO., LTD: COMPANY SNAPSHOT
- TABLE 100. SHANDONG TANGLU METAL MATERIAL CO., LTD: PRODUCT SEGMENTS
- TABLE 101. SHANDONG TANGLU METAL MATERIAL CO., LTD: PRODUCT PORTFOLIO
- TABLE 102. TATA STEEL LIMITED: KEY EXECUTIVES
- TABLE 103. TATA STEEL LIMITED: COMPANY SNAPSHOT
- TABLE 104. TATA STEEL LIMITED: PRODUCT SEGMENTS
- TABLE 105. TATA STEEL LIMITED: PRODUCT PORTFOLIO
- TABLE 106. TATA STEEL LIMITED: KEY STRATERGIES
- TABLE 107. TENARIS SA.: KEY EXECUTIVES
- TABLE 108. TENARIS SA.: COMPANY SNAPSHOT
- TABLE 109. TENARIS SA.: PRODUCT SEGMENTS
- TABLE 110. TENARIS SA.: PRODUCT PORTFOLIO
- TABLE 111. UNITED STATES STEEL CORPORATION: KEY EXECUTIVES
- TABLE 112. UNITED STATES STEEL CORPORATION: COMPANY SNAPSHOT
- TABLE 113. UNITED STATES STEEL CORPORATION: PRODUCT SEGMENTS
- TABLE 114. UNITED STATES STEEL CORPORATION: PRODUCT PORTFOLIO
- TABLE 115. VALLOUREC SA: KEY EXECUTIVES
- TABLE 116. VALLOUREC SA: COMPANY SNAPSHOT
- TABLE 117. VALLOUREC SA: PRODUCT SEGMENTS
- TABLE 118. VALLOUREC SA: PRODUCT PORTFOLIO
- TABLE 119. SHENQIANG STEEL MANUFACTURING CO., LTD.: KEY EXECUTIVES
- TABLE 120. SHENQIANG STEEL MANUFACTURING CO., LTD.: COMPANY SNAPSHOT
- TABLE 121. SHENQIANG STEEL MANUFACTURING CO., LTD.: PRODUCT SEGMENTS
- TABLE 122. SHENQIANG STEEL MANUFACTURING CO., LTD.: PRODUCT PORTFOLIO
LIST OF FIGURES
- FIGURE 01. SEAMLESS STEEL TUBES MARKET, 2022-2032
- FIGURE 02. SEGMENTATION OF SEAMLESS STEEL TUBES MARKET, 2022-2032
- FIGURE 03. TOP INVESTMENT POCKETS IN SEAMLESS STEEL TUBES MARKET (2023-2032)
- FIGURE 04. LOW BARGAINING POWER OF SUPPLIERS
- FIGURE 05. LOW THREAT OF NEW ENTRANTS
- FIGURE 06. LOW THREAT OF SUBSTITUTES
- FIGURE 07. LOW INTENSITY OF RIVALRY
- FIGURE 08. LOW BARGAINING POWER OF BUYERS
- FIGURE 09. DRIVERS, RESTRAINTS AND OPPORTUNITIES: GLOBALSEAMLESS STEEL TUBES MARKET
- FIGURE 09. SEAMLESS STEEL TUBES MARKET, BY MATERIAL, 2022(%)
- FIGURE 10. COMPARATIVE SHARE ANALYSIS OF SEAMLESS STEEL TUBES MARKET FOR CARBON STEEL, BY COUNTRY 2022 AND 2032(%)
- FIGURE 11. COMPARATIVE SHARE ANALYSIS OF SEAMLESS STEEL TUBES MARKET FOR STAINLESS STEEL, BY COUNTRY 2022 AND 2032(%)
- FIGURE 12. COMPARATIVE SHARE ANALYSIS OF SEAMLESS STEEL TUBES MARKET FOR ALLOY STEEL, BY COUNTRY 2022 AND 2032(%)
- FIGURE 13. COMPARATIVE SHARE ANALYSIS OF SEAMLESS STEEL TUBES MARKET FOR OTHERS, BY COUNTRY 2022 AND 2032(%)
- FIGURE 14. SEAMLESS STEEL TUBES MARKET, BY PROCESS, 2022(%)
- FIGURE 15. COMPARATIVE SHARE ANALYSIS OF SEAMLESS STEEL TUBES MARKET FOR COLD ROLLED, BY COUNTRY 2022 AND 2032(%)
- FIGURE 16. COMPARATIVE SHARE ANALYSIS OF SEAMLESS STEEL TUBES MARKET FOR HOT ROLLED, BY COUNTRY 2022 AND 2032(%)
- FIGURE 17. SEAMLESS STEEL TUBES MARKET, BY END-USER, 2022(%)
- FIGURE 18. COMPARATIVE SHARE ANALYSIS OF SEAMLESS STEEL TUBES MARKET FOR OIL AND GAS, BY COUNTRY 2022 AND 2032(%)
- FIGURE 19. COMPARATIVE SHARE ANALYSIS OF SEAMLESS STEEL TUBES MARKET FOR AUTOMOTIVE, BY COUNTRY 2022 AND 2032(%)
- FIGURE 20. COMPARATIVE SHARE ANALYSIS OF SEAMLESS STEEL TUBES MARKET FOR CONSTRUCTION, BY COUNTRY 2022 AND 2032(%)
- FIGURE 21. COMPARATIVE SHARE ANALYSIS OF SEAMLESS STEEL TUBES MARKET FOR ENERGY AND POWER, BY COUNTRY 2022 AND 2032(%)
- FIGURE 22. COMPARATIVE SHARE ANALYSIS OF SEAMLESS STEEL TUBES MARKET FOR OTHERS, BY COUNTRY 2022 AND 2032(%)
- FIGURE 23. SEAMLESS STEEL TUBES MARKET BY REGION, 2022
- FIGURE 24. U.S. SEAMLESS STEEL TUBES MARKET, 2022-2032 ($MILLION)
- FIGURE 25. CANADA SEAMLESS STEEL TUBES MARKET, 2022-2032 ($MILLION)
- FIGURE 26. MEXICO SEAMLESS STEEL TUBES MARKET, 2022-2032 ($MILLION)
- FIGURE 27. GERMANY SEAMLESS STEEL TUBES MARKET, 2022-2032 ($MILLION)
- FIGURE 28. FRANCE SEAMLESS STEEL TUBES MARKET, 2022-2032 ($MILLION)
- FIGURE 29. ITALY SEAMLESS STEEL TUBES MARKET, 2022-2032 ($MILLION)
- FIGURE 30. UK SEAMLESS STEEL TUBES MARKET, 2022-2032 ($MILLION)
- FIGURE 31. REST OF EUROPE SEAMLESS STEEL TUBES MARKET, 2022-2032 ($MILLION)
- FIGURE 32. CHINA SEAMLESS STEEL TUBES MARKET, 2022-2032 ($MILLION)
- FIGURE 33. JAPAN SEAMLESS STEEL TUBES MARKET, 2022-2032 ($MILLION)
- FIGURE 34. INDIA SEAMLESS STEEL TUBES MARKET, 2022-2032 ($MILLION)
- FIGURE 35. SOUTH KOREA SEAMLESS STEEL TUBES MARKET, 2022-2032 ($MILLION)
- FIGURE 36. REST OF ASIA-PACIFIC SEAMLESS STEEL TUBES MARKET, 2022-2032 ($MILLION)
- FIGURE 37. LATIN AMERICA SEAMLESS STEEL TUBES MARKET, 2022-2032 ($MILLION)
- FIGURE 38. MIDDLE EAST SEAMLESS STEEL TUBES MARKET, 2022-2032 ($MILLION)
- FIGURE 39. AFRICA SEAMLESS STEEL TUBES MARKET, 2022-2032 ($MILLION)
- FIGURE 40. TOP WINNING STRATEGIES, BY YEAR
- FIGURE 41. TOP WINNING STRATEGIES, BY DEVELOPMENT
- FIGURE 42. TOP WINNING STRATEGIES, BY COMPANY
- FIGURE 43. PRODUCT MAPPING OF TOP 10 PLAYERS
- FIGURE 44. COMPETITIVE DASHBOARD
- FIGURE 45. COMPETITIVE HEATMAP: SEAMLESS STEEL TUBES MARKET
- FIGURE 46. TOP PLAYER POSITIONING, 2022
- FIGURE 47. ARCELORMITTAL: NET SALES, 2020-2022 ($MILLION)
- FIGURE 48. ARCELORMITTAL: RESEARCH & DEVELOPMENT EXPENDITURE, 2020-2022 ($MILLION)
- FIGURE 49. ARCELORMITTAL: REVENUE SHARE BY SEGMENT, 2022 (%)
- FIGURE 50. ARCELORMITTAL: REVENUE SHARE BY REGION, 2022 (%)
- FIGURE 51. JINDAL SAW LIMITED: NET REVENUE, 2021-2023 ($MILLION)
- FIGURE 52. NIPPON STEEL CORPORATION: NET SALES, 2020-2022 ($MILLION)
- FIGURE 53. NIPPON STEEL CORPORATION: RESEARCH & DEVELOPMENT EXPENDITURE, 2020-2022 ($MILLION)
- FIGURE 54. NIPPON STEEL CORPORATION: REVENUE SHARE BY REGION, 2022 (%)
- FIGURE 55. NIPPON STEEL CORPORATION: REVENUE SHARE BY REGION, 2022 (%)
- FIGURE 56. SANDVIK AB: NET SALES, 2020-2022 ($MILLION)
- FIGURE 57. SANDVIK AB: RESEARCH & DEVELOPMENT EXPENDITURE, 2020-2022 ($MILLION)
- FIGURE 58. SANDVIK AB: REVENUE SHARE BY SEGMENT, 2021 (%)
- FIGURE 59. SANDVIK AB: REVENUE SHARE BY REGION, 2021 (%)
- FIGURE 60. TATA STEEL LIMITED: NET SALES, 2020-2022 ($MILLION)
- FIGURE 61. TATA STEEL LIMITED: REVENUE SHARE BY REGION, 2022 (%)
- FIGURE 62. TATA STEEL LIMITED: REVENUE SHARE BY SEGMENT, 2022 (%)
- FIGURE 63. TENARIS S.A.: NET SALES, 2020-2022 ($MILLION)
- FIGURE 64. TENARIS S.A.: RESEARCH & DEVELOPMENT EXPENDITURE, 2020-2022 ($MILLION)
- FIGURE 65. TENARIS S.A.: REVENUE SHARE BY REGION, 2022 (%)
- FIGURE 66. TENARIS S.A.: REVENUE SHARE BY SEGMENT, 2022 (%)
- FIGURE 67. UNITED STATES STEEL CORPORATION: NET SALES, 2020-2022 ($MILLION)
- FIGURE 68. UNITED STATES STEEL CORPORATION: REVENUE SHARE BY SEGMENT, 2022 (%)
- FIGURE 69. UNITED STATES STEEL CORPORATION: REVENUE SHARE BY REGION, 2022 (%)
- FIGURE 70. VALLOUREC SA: NET REVENUE, 2020-2022 ($MILLION)
- FIGURE 71. VALLOUREC SA: REVENUE SHARE BY SEGMENT, 2022 (%)
- FIGURE 72. VALLOUREC SA: REVENUE SHARE BY REGION, 2022 (%)


