


 |
市場調查報告書
商品編碼
1365603
航太發射服務市場:按有效載荷、按發射平台、按服務類型、按運載火箭、按最終用戶:全球機會分析和產業預測,2023-2032年Space Launch Services Market By Payload, By Launch Platform, By Service Type, By Launch Vehicle, By End User : Global Opportunity Analysis and Industry Forecast, 2023-2032 |
||||||
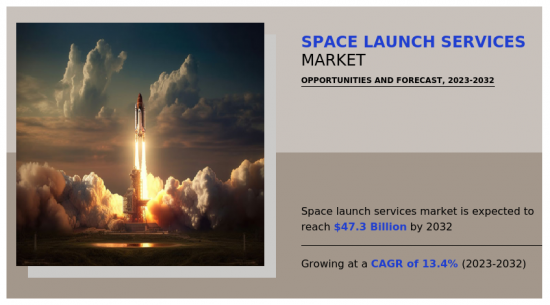
「由於全球衛星發射數量的增加,預計從2023年到2032年,航太發射服務市場將出現 13.4%的大幅成長」—Allied Market Research
研究報告按有效載荷、發射平台、服務類型、運載火箭、最終用戶和地區對太空發射服務市場前景進行分類。此外也分析了北美、歐洲、亞太、拉丁美洲、中東、非洲等地區商旅保險的當前市場趨勢,並根據俄羅斯-烏克蘭戰爭提案了未來的成長機會。本報告說明了市場促進因素、抑制因素和市場機會,以便更佳了解市場動態。報告也強調了重點投資領域。它還包括波特的五力分析,以了解該行業的競爭場景以及每個利益相關者的角色。此產業價值鏈分析包括研發、零件製造商、組裝、程式設計和測試、行銷和銷售、客戶、售後服務等。本報告重點介紹了主要市場參與企業為維持市場立足點而採取的策略。此外,它還凸顯了主要企業的競爭形勢,以增加市場佔有率並保持行業的激烈競爭。
本報告分析的主要企業包括Airbus S.A.S, Antrix Corporation Limited, China Aerospace Science and Technology Corporation, Lockheed Martin Corporation, Mitsubishi Heavy Industries (MHI), Northrop Grumman Corporation, Rocket Lab USA, Safran SA, Space Exploration Technologies Corp. (SpaceX), Starsem, ROSCOSMOS, S7 SPACE, Boeing Corporation。
目錄
第1章 簡介
第2章 執行摘要
第3章 市場概況
- 市場定義和範圍
- 主要發現
- 影響要素
- 主要投資機會
- 波特五力分析
- 市場動態
- 促進因素
- 政府增加太空探勘活動的投資
- 對商業非對地靜止衛星軌道(NGSO)發射的需求不斷增加
- 全球衛星發射數量增加
- 抑制因素
- 與航太發射服務相關的高初始投資
- 機會
- 致力於透過產品創新降低航太發射服務成本
- 太空旅遊
- 促進因素
- COVID-19 市場影響分析
第4章 航太發射服務市場:依酬載
- 概述
- 衛星
- 載人航太
- 貨物
- 測試探針
- 平流層衛星
第5章 航太發射服務市場:依發射平台分類
- 概述
- 土地
- 航空
- 海上
第6章 航太發射服務市場:依服務類型
- 概述
- 發射前
- 發射後
第7章 航太發射服務市場:依運載火箭分類
- 概述
- 小型火箭
- 大型火箭
第8章 太空發射服務市場:依最終用戶分類
- 概述
- 政府/軍隊
- 商業
第9章 航太發射服務市場:依地區
- 概述
- 北美洲
- 美國
- 加拿大
- 歐洲
- 俄羅斯
- 法國
- 德國
- 義大利
- 英國
- 其他
- 亞太地區
- 中國
- 日本
- 印度
- 韓國
- 其他
- 拉丁美洲
- 拉丁美洲
- 中東
- 非洲
第10章 競爭形勢
- 介紹
- 關鍵成功策略
- 10家主要企業產品圖譜
- 競爭儀表板
- 競爭熱圖
- 2022年主要企業定位
第11章 公司簡介
- Airbus
- Antrix Corporation limited
- China Aerospace Science and Technology Corporation
- Lockheed Martin Corporation.
- Mitsubishi Heavy Industries, LTD
- Northrop Grumman Corporation
- Rocket Lab USA
- SAFRAN SA
- SPACEX
- Starsem
"The Space Launch Service Market is expected to experience a significant growth rate of 13.4% from 2023-2032 owing to increase in Satellite launches Across the Globe" - Allied Market Research.
The space launch service market scope is segmented on the basis of payload, launch platform, service type, launch vehicle, end user, and region.Moreover, it analyzes the current market trends of business travel insurance across different regions such as North America, Europe, Asia-Pacific, and LAMEA, and suggests future growth opportunities with consideration of Russia-Ukraine war. The growth drivers, restraints, and opportunities are explained in the report to better understand the market dynamics. This report further highlights the key areas of investment. In addition, it includes Porter's five forces analysis to understand the competitive scenario of the industry and role of each stakeholder.Value chain analysis for this industry, which includes R&D, components manufacturers, assembly, programming & testing, marketing & sales, customers, and post-sales services, is explained. The report features the strategies adopted by key market players to maintain their foothold in the market. Furthermore, it highlights the competitive landscape of the key players to increase their market share and sustain intense competition in the industry.
Key players analyzed in the report include Airbus S.A.S, Antrix Corporation Limited, China Aerospace Science and Technology Corporation, Lockheed Martin Corporation, Mitsubishi Heavy Industries (MHI), Northrop Grumman Corporation, Rocket Lab USA, Safran SA, Space Exploration Technologies Corp. (SpaceX), Starsem, ROSCOSMOS, S7 SPACE, Boeing Corporation.
Key Benefits For Stakeholders
- This report provides a quantitative analysis of the market segments, current trends, estimations, and dynamics of the space launch services market analysis from 2022 to 2032 to identify the prevailing space launch services market opportunities.
- The market research is offered along with information related to key drivers, restraints, and opportunities.
- Porter's five forces analysis highlights the potency of buyers and suppliers to enable stakeholders make profit-oriented business decisions and strengthen their supplier-buyer network.
- In-depth analysis of the space launch services market segmentation assists to determine the prevailing market opportunities.
- Major countries in each region are mapped according to their revenue contribution to the global market.
- Market player positioning facilitates benchmarking and provides a clear understanding of the present position of the market players.
- The report includes the analysis of the regional as well as global space launch services market trends, key players, market segments, application areas, and market growth strategies.
Additional benefits you will get with this purchase are:
- Quarterly Update and* (only available with a corporate license, on listed price)
- 5 additional Company Profile of client Choice pre- or Post-purchase, as a free update.
- Free Upcoming Version on the Purchase of Five and Enterprise User License.
- 16 analyst hours of support* (post-purchase, if you find additional data requirements upon review of the report, you may receive support amounting to 16 analyst hours to solve questions, and post-sale queries)
- 15% Free Customization* (in case the scope or segment of the report does not match your requirements, 20% is equivalent to 3 working days of free work, applicable once)
- Free data Pack on the Five and Enterprise User License. (Excel version of the report)
- Free Updated report if the report is 6-12 months old or older.
- 24-hour priority response*
- Free Industry updates and white papers.
Possible Customization with this report (with additional cost and timeline talk to the sales executive to know more)
- Additional company profiles with specific to client's interest
Key Market Segments
By Payload
- Satellite
- Human Spaceflight
- Cargo
- Testing Probes
- Stratollites
By Launch Platform
- Land
- Air
- Sea
By Service Type
- Pre Launch
- Post Launch
By Launch Vehicle
- Small launch vehicle
- Heavy Launch Vehicle
By End User
- Government and Military
- Commercial
By Region
- North America
- U.S.
- Canada
- Europe
- Russia
- France
- Germany
- Italy
- UK
- Rest of Europe
- Asia-Pacific
- China
- Japan
- India
- South Korea
- Rest of Asia-Pacific
- LAMEA
- Latin America
- Middle East
- Africa
Key Market Players:
- Mitsubishi Heavy Industries, LTD
- Northrop Grumman Corporation
- Rocket Lab USA
- SPACEX
- China Aerospace Science and Technology Corporation
- Starsem
- SAFRAN SA
- Lockheed Martin Corporation.
- Airbus
- Antrix Corporation limited
TABLE OF CONTENTS
CHAPTER 1: INTRODUCTION
- 1.1. Report description
- 1.2. Key market segments
- 1.3. Key benefits to the stakeholders
- 1.4. Research Methodology
- 1.4.1. Primary research
- 1.4.2. Secondary research
- 1.4.3. Analyst tools and models
CHAPTER 2: EXECUTIVE SUMMARY
- 2.1. CXO Perspective
CHAPTER 3: MARKET OVERVIEW
- 3.1. Market definition and scope
- 3.2. Key findings
- 3.2.1. Top impacting factors
- 3.2.2. Top investment pockets
- 3.3. Porter's five forces analysis
- 3.3.1. Low bargaining power of suppliers
- 3.3.2. Low threat of new entrants
- 3.3.3. Low threat of substitutes
- 3.3.4. Low intensity of rivalry
- 3.3.5. Low bargaining power of buyers
- 3.4. Market dynamics
- 3.4.1. Drivers
- 3.4.1.1. Increase in government investment in space exploration activities
- 3.4.1.2. Increase in demand for commercial Non-Geostationary Satellite Orbit (NGSO) Space Launches
- 3.4.1.3. Increase in satellite launches across the globe
- 3.4.1. Drivers
- 3.4.2. Restraints
- 3.4.2.1. High initial investment associated with space launch services
- 3.4.2.2. High initial investment associated with space launch services
- 3.4.3. Opportunities
- 3.4.3.1. Focus on price reduction for space launch services through product innovation
- 3.4.3.2. Space Tourism
- 3.5. COVID-19 Impact Analysis on the market
CHAPTER 4: SPACE LAUNCH SERVICES MARKET, BY PAYLOAD
- 4.1. Overview
- 4.1.1. Market size and forecast
- 4.2. Satellite
- 4.2.1. Key market trends, growth factors and opportunities
- 4.2.2. Market size and forecast, by region
- 4.2.3. Market share analysis by country
- 4.3. Human Spaceflight
- 4.3.1. Key market trends, growth factors and opportunities
- 4.3.2. Market size and forecast, by region
- 4.3.3. Market share analysis by country
- 4.4. Cargo
- 4.4.1. Key market trends, growth factors and opportunities
- 4.4.2. Market size and forecast, by region
- 4.4.3. Market share analysis by country
- 4.5. Testing Probes
- 4.5.1. Key market trends, growth factors and opportunities
- 4.5.2. Market size and forecast, by region
- 4.5.3. Market share analysis by country
- 4.6. Stratollites
- 4.6.1. Key market trends, growth factors and opportunities
- 4.6.2. Market size and forecast, by region
- 4.6.3. Market share analysis by country
CHAPTER 5: SPACE LAUNCH SERVICES MARKET, BY LAUNCH PLATFORM
- 5.1. Overview
- 5.1.1. Market size and forecast
- 5.2. Land
- 5.2.1. Key market trends, growth factors and opportunities
- 5.2.2. Market size and forecast, by region
- 5.2.3. Market share analysis by country
- 5.3. Air
- 5.3.1. Key market trends, growth factors and opportunities
- 5.3.2. Market size and forecast, by region
- 5.3.3. Market share analysis by country
- 5.4. Sea
- 5.4.1. Key market trends, growth factors and opportunities
- 5.4.2. Market size and forecast, by region
- 5.4.3. Market share analysis by country
CHAPTER 6: SPACE LAUNCH SERVICES MARKET, BY SERVICE TYPE
- 6.1. Overview
- 6.1.1. Market size and forecast
- 6.2. Pre Launch
- 6.2.1. Key market trends, growth factors and opportunities
- 6.2.2. Market size and forecast, by region
- 6.2.3. Market share analysis by country
- 6.3. Post Launch
- 6.3.1. Key market trends, growth factors and opportunities
- 6.3.2. Market size and forecast, by region
- 6.3.3. Market share analysis by country
CHAPTER 7: SPACE LAUNCH SERVICES MARKET, BY LAUNCH VEHICLE
- 7.1. Overview
- 7.1.1. Market size and forecast
- 7.2. Small launch vehicle
- 7.2.1. Key market trends, growth factors and opportunities
- 7.2.2. Market size and forecast, by region
- 7.2.3. Market share analysis by country
- 7.3. Heavy Launch Vehicle
- 7.3.1. Key market trends, growth factors and opportunities
- 7.3.2. Market size and forecast, by region
- 7.3.3. Market share analysis by country
CHAPTER 8: SPACE LAUNCH SERVICES MARKET, BY END USER
- 8.1. Overview
- 8.1.1. Market size and forecast
- 8.2. Government and Military
- 8.2.1. Key market trends, growth factors and opportunities
- 8.2.2. Market size and forecast, by region
- 8.2.3. Market share analysis by country
- 8.3. Commercial
- 8.3.1. Key market trends, growth factors and opportunities
- 8.3.2. Market size and forecast, by region
- 8.3.3. Market share analysis by country
CHAPTER 9: SPACE LAUNCH SERVICES MARKET, BY REGION
- 9.1. Overview
- 9.1.1. Market size and forecast By Region
- 9.2. North America
- 9.2.1. Key trends and opportunities
- 9.2.2. Market size and forecast, by Payload
- 9.2.3. Market size and forecast, by Launch Platform
- 9.2.4. Market size and forecast, by Service Type
- 9.2.5. Market size and forecast, by Launch Vehicle
- 9.2.6. Market size and forecast, by End User
- 9.2.7. Market size and forecast, by country
- 9.2.7.1. U.S.
- 9.2.7.1.1. Key market trends, growth factors and opportunities
- 9.2.7.1.2. Market size and forecast, by Payload
- 9.2.7.1.3. Market size and forecast, by Launch Platform
- 9.2.7.1.4. Market size and forecast, by Service Type
- 9.2.7.1.5. Market size and forecast, by Launch Vehicle
- 9.2.7.1.6. Market size and forecast, by End User
- 9.2.7.2. Canada
- 9.2.7.2.1. Key market trends, growth factors and opportunities
- 9.2.7.2.2. Market size and forecast, by Payload
- 9.2.7.2.3. Market size and forecast, by Launch Platform
- 9.2.7.2.4. Market size and forecast, by Service Type
- 9.2.7.2.5. Market size and forecast, by Launch Vehicle
- 9.2.7.2.6. Market size and forecast, by End User
- 9.3. Europe
- 9.3.1. Key trends and opportunities
- 9.3.2. Market size and forecast, by Payload
- 9.3.3. Market size and forecast, by Launch Platform
- 9.3.4. Market size and forecast, by Service Type
- 9.3.5. Market size and forecast, by Launch Vehicle
- 9.3.6. Market size and forecast, by End User
- 9.3.7. Market size and forecast, by country
- 9.3.7.1. Russia
- 9.3.7.1.1. Key market trends, growth factors and opportunities
- 9.3.7.1.2. Market size and forecast, by Payload
- 9.3.7.1.3. Market size and forecast, by Launch Platform
- 9.3.7.1.4. Market size and forecast, by Service Type
- 9.3.7.1.5. Market size and forecast, by Launch Vehicle
- 9.3.7.1.6. Market size and forecast, by End User
- 9.3.7.2. France
- 9.3.7.2.1. Key market trends, growth factors and opportunities
- 9.3.7.2.2. Market size and forecast, by Payload
- 9.3.7.2.3. Market size and forecast, by Launch Platform
- 9.3.7.2.4. Market size and forecast, by Service Type
- 9.3.7.2.5. Market size and forecast, by Launch Vehicle
- 9.3.7.2.6. Market size and forecast, by End User
- 9.3.7.3. Germany
- 9.3.7.3.1. Key market trends, growth factors and opportunities
- 9.3.7.3.2. Market size and forecast, by Payload
- 9.3.7.3.3. Market size and forecast, by Launch Platform
- 9.3.7.3.4. Market size and forecast, by Service Type
- 9.3.7.3.5. Market size and forecast, by Launch Vehicle
- 9.3.7.3.6. Market size and forecast, by End User
- 9.3.7.4. Italy
- 9.3.7.4.1. Key market trends, growth factors and opportunities
- 9.3.7.4.2. Market size and forecast, by Payload
- 9.3.7.4.3. Market size and forecast, by Launch Platform
- 9.3.7.4.4. Market size and forecast, by Service Type
- 9.3.7.4.5. Market size and forecast, by Launch Vehicle
- 9.3.7.4.6. Market size and forecast, by End User
- 9.3.7.5. UK
- 9.3.7.5.1. Key market trends, growth factors and opportunities
- 9.3.7.5.2. Market size and forecast, by Payload
- 9.3.7.5.3. Market size and forecast, by Launch Platform
- 9.3.7.5.4. Market size and forecast, by Service Type
- 9.3.7.5.5. Market size and forecast, by Launch Vehicle
- 9.3.7.5.6. Market size and forecast, by End User
- 9.3.7.6. Rest of Europe
- 9.3.7.6.1. Key market trends, growth factors and opportunities
- 9.3.7.6.2. Market size and forecast, by Payload
- 9.3.7.6.3. Market size and forecast, by Launch Platform
- 9.3.7.6.4. Market size and forecast, by Service Type
- 9.3.7.6.5. Market size and forecast, by Launch Vehicle
- 9.3.7.6.6. Market size and forecast, by End User
- 9.4. Asia-Pacific
- 9.4.1. Key trends and opportunities
- 9.4.2. Market size and forecast, by Payload
- 9.4.3. Market size and forecast, by Launch Platform
- 9.4.4. Market size and forecast, by Service Type
- 9.4.5. Market size and forecast, by Launch Vehicle
- 9.4.6. Market size and forecast, by End User
- 9.4.7. Market size and forecast, by country
- 9.4.7.1. China
- 9.4.7.1.1. Key market trends, growth factors and opportunities
- 9.4.7.1.2. Market size and forecast, by Payload
- 9.4.7.1.3. Market size and forecast, by Launch Platform
- 9.4.7.1.4. Market size and forecast, by Service Type
- 9.4.7.1.5. Market size and forecast, by Launch Vehicle
- 9.4.7.1.6. Market size and forecast, by End User
- 9.4.7.2. Japan
- 9.4.7.2.1. Key market trends, growth factors and opportunities
- 9.4.7.2.2. Market size and forecast, by Payload
- 9.4.7.2.3. Market size and forecast, by Launch Platform
- 9.4.7.2.4. Market size and forecast, by Service Type
- 9.4.7.2.5. Market size and forecast, by Launch Vehicle
- 9.4.7.2.6. Market size and forecast, by End User
- 9.4.7.3. India
- 9.4.7.3.1. Key market trends, growth factors and opportunities
- 9.4.7.3.2. Market size and forecast, by Payload
- 9.4.7.3.3. Market size and forecast, by Launch Platform
- 9.4.7.3.4. Market size and forecast, by Service Type
- 9.4.7.3.5. Market size and forecast, by Launch Vehicle
- 9.4.7.3.6. Market size and forecast, by End User
- 9.4.7.4. South Korea
- 9.4.7.4.1. Key market trends, growth factors and opportunities
- 9.4.7.4.2. Market size and forecast, by Payload
- 9.4.7.4.3. Market size and forecast, by Launch Platform
- 9.4.7.4.4. Market size and forecast, by Service Type
- 9.4.7.4.5. Market size and forecast, by Launch Vehicle
- 9.4.7.4.6. Market size and forecast, by End User
- 9.4.7.5. Rest of Asia-Pacific
- 9.4.7.5.1. Key market trends, growth factors and opportunities
- 9.4.7.5.2. Market size and forecast, by Payload
- 9.4.7.5.3. Market size and forecast, by Launch Platform
- 9.4.7.5.4. Market size and forecast, by Service Type
- 9.4.7.5.5. Market size and forecast, by Launch Vehicle
- 9.4.7.5.6. Market size and forecast, by End User
- 9.5. LAMEA
- 9.5.1. Key trends and opportunities
- 9.5.2. Market size and forecast, by Payload
- 9.5.3. Market size and forecast, by Launch Platform
- 9.5.4. Market size and forecast, by Service Type
- 9.5.5. Market size and forecast, by Launch Vehicle
- 9.5.6. Market size and forecast, by End User
- 9.5.7. Market size and forecast, by country
- 9.5.7.1. Latin America
- 9.5.7.1.1. Key market trends, growth factors and opportunities
- 9.5.7.1.2. Market size and forecast, by Payload
- 9.5.7.1.3. Market size and forecast, by Launch Platform
- 9.5.7.1.4. Market size and forecast, by Service Type
- 9.5.7.1.5. Market size and forecast, by Launch Vehicle
- 9.5.7.1.6. Market size and forecast, by End User
- 9.5.7.2. Middle East
- 9.5.7.2.1. Key market trends, growth factors and opportunities
- 9.5.7.2.2. Market size and forecast, by Payload
- 9.5.7.2.3. Market size and forecast, by Launch Platform
- 9.5.7.2.4. Market size and forecast, by Service Type
- 9.5.7.2.5. Market size and forecast, by Launch Vehicle
- 9.5.7.2.6. Market size and forecast, by End User
- 9.5.7.3. Africa
- 9.5.7.3.1. Key market trends, growth factors and opportunities
- 9.5.7.3.2. Market size and forecast, by Payload
- 9.5.7.3.3. Market size and forecast, by Launch Platform
- 9.5.7.3.4. Market size and forecast, by Service Type
- 9.5.7.3.5. Market size and forecast, by Launch Vehicle
- 9.5.7.3.6. Market size and forecast, by End User
CHAPTER 10: COMPETITIVE LANDSCAPE
- 10.1. Introduction
- 10.2. Top winning strategies
- 10.3. Product Mapping of Top 10 Player
- 10.4. Competitive Dashboard
- 10.5. Competitive Heatmap
- 10.6. Top player positioning, 2022
CHAPTER 11: COMPANY PROFILES
- 11.1. Airbus
- 11.1.1. Company overview
- 11.1.2. Key Executives
- 11.1.3. Company snapshot
- 11.1.4. Operating business segments
- 11.1.5. Product portfolio
- 11.1.6. Business performance
- 11.1.7. Key strategic moves and developments
- 11.2. Antrix Corporation limited
- 11.2.1. Company overview
- 11.2.2. Key Executives
- 11.2.3. Company snapshot
- 11.2.4. Operating business segments
- 11.2.5. Product portfolio
- 11.2.6. Business performance
- 11.3. China Aerospace Science and Technology Corporation
- 11.3.1. Company overview
- 11.3.2. Key Executives
- 11.3.3. Company snapshot
- 11.3.4. Operating business segments
- 11.3.5. Product portfolio
- 11.4. Lockheed Martin Corporation.
- 11.4.1. Company overview
- 11.4.2. Key Executives
- 11.4.3. Company snapshot
- 11.4.4. Operating business segments
- 11.4.5. Product portfolio
- 11.4.6. Business performance
- 11.4.7. Key strategic moves and developments
- 11.5. Mitsubishi Heavy Industries, LTD
- 11.5.1. Company overview
- 11.5.2. Key Executives
- 11.5.3. Company snapshot
- 11.5.4. Operating business segments
- 11.5.5. Product portfolio
- 11.5.6. Business performance
- 11.5.7. Key strategic moves and developments
- 11.6. Northrop Grumman Corporation
- 11.6.1. Company overview
- 11.6.2. Key Executives
- 11.6.3. Company snapshot
- 11.6.4. Operating business segments
- 11.6.5. Product portfolio
- 11.6.6. Business performance
- 11.6.7. Key strategic moves and developments
- 11.7. Rocket Lab USA
- 11.7.1. Company overview
- 11.7.2. Key Executives
- 11.7.3. Company snapshot
- 11.7.4. Operating business segments
- 11.7.5. Product portfolio
- 11.7.6. Business performance
- 11.7.7. Key strategic moves and developments
- 11.8. SAFRAN SA
- 11.8.1. Company overview
- 11.8.2. Key Executives
- 11.8.3. Company snapshot
- 11.8.4. Operating business segments
- 11.8.5. Product portfolio
- 11.8.6. Business performance
- 11.8.7. Key strategic moves and developments
- 11.9. SPACEX
- 11.9.1. Company overview
- 11.9.2. Key Executives
- 11.9.3. Company snapshot
- 11.9.4. Operating business segments
- 11.9.5. Product portfolio
- 11.9.6. Key strategic moves and developments
- 11.10. Starsem
- 11.10.1. Company overview
- 11.10.2. Key Executives
- 11.10.3. Company snapshot
- 11.10.4. Operating business segments
- 11.10.5. Product portfolio
- 11.10.6. Key strategic moves and developments
LIST OF TABLES
- TABLE 01. GLOBAL SPACE LAUNCH SERVICES MARKET, BY PAYLOAD, 2022-2032 ($MILLION)
- TABLE 02. SPACE LAUNCH SERVICES MARKET FOR SATELLITE, BY REGION, 2022-2032 ($MILLION)
- TABLE 03. SPACE LAUNCH SERVICES MARKET FOR HUMAN SPACEFLIGHT, BY REGION, 2022-2032 ($MILLION)
- TABLE 04. SPACE LAUNCH SERVICES MARKET FOR CARGO, BY REGION, 2022-2032 ($MILLION)
- TABLE 05. SPACE LAUNCH SERVICES MARKET FOR TESTING PROBES, BY REGION, 2022-2032 ($MILLION)
- TABLE 06. SPACE LAUNCH SERVICES MARKET FOR STRATOLLITES, BY REGION, 2022-2032 ($MILLION)
- TABLE 07. GLOBAL SPACE LAUNCH SERVICES MARKET, BY LAUNCH PLATFORM, 2022-2032 ($MILLION)
- TABLE 08. SPACE LAUNCH SERVICES MARKET FOR LAND, BY REGION, 2022-2032 ($MILLION)
- TABLE 09. SPACE LAUNCH SERVICES MARKET FOR AIR, BY REGION, 2022-2032 ($MILLION)
- TABLE 10. SPACE LAUNCH SERVICES MARKET FOR SEA, BY REGION, 2022-2032 ($MILLION)
- TABLE 11. GLOBAL SPACE LAUNCH SERVICES MARKET, BY SERVICE TYPE, 2022-2032 ($MILLION)
- TABLE 12. SPACE LAUNCH SERVICES MARKET FOR PRE LAUNCH, BY REGION, 2022-2032 ($MILLION)
- TABLE 13. SPACE LAUNCH SERVICES MARKET FOR POST LAUNCH, BY REGION, 2022-2032 ($MILLION)
- TABLE 14. GLOBAL SPACE LAUNCH SERVICES MARKET, BY LAUNCH VEHICLE, 2022-2032 ($MILLION)
- TABLE 15. SPACE LAUNCH SERVICES MARKET FOR SMALL LAUNCH VEHICLE, BY REGION, 2022-2032 ($MILLION)
- TABLE 16. SPACE LAUNCH SERVICES MARKET FOR HEAVY LAUNCH VEHICLE, BY REGION, 2022-2032 ($MILLION)
- TABLE 17. GLOBAL SPACE LAUNCH SERVICES MARKET, BY END USER, 2022-2032 ($MILLION)
- TABLE 18. SPACE LAUNCH SERVICES MARKET FOR GOVERNMENT AND MILITARY, BY REGION, 2022-2032 ($MILLION)
- TABLE 19. SPACE LAUNCH SERVICES MARKET FOR COMMERCIAL, BY REGION, 2022-2032 ($MILLION)
- TABLE 20. SPACE LAUNCH SERVICES MARKET, BY REGION, 2022-2032 ($MILLION)
- TABLE 21. NORTH AMERICA SPACE LAUNCH SERVICES MARKET, BY PAYLOAD, 2022-2032 ($MILLION)
- TABLE 22. NORTH AMERICA SPACE LAUNCH SERVICES MARKET, BY LAUNCH PLATFORM, 2022-2032 ($MILLION)
- TABLE 23. NORTH AMERICA SPACE LAUNCH SERVICES MARKET, BY SERVICE TYPE, 2022-2032 ($MILLION)
- TABLE 24. NORTH AMERICA SPACE LAUNCH SERVICES MARKET, BY LAUNCH VEHICLE, 2022-2032 ($MILLION)
- TABLE 25. NORTH AMERICA SPACE LAUNCH SERVICES MARKET, BY END USER, 2022-2032 ($MILLION)
- TABLE 26. NORTH AMERICA SPACE LAUNCH SERVICES MARKET, BY COUNTRY, 2022-2032 ($MILLION)
- TABLE 27. U.S. SPACE LAUNCH SERVICES MARKET, BY PAYLOAD, 2022-2032 ($MILLION)
- TABLE 28. U.S. SPACE LAUNCH SERVICES MARKET, BY LAUNCH PLATFORM, 2022-2032 ($MILLION)
- TABLE 29. U.S. SPACE LAUNCH SERVICES MARKET, BY SERVICE TYPE, 2022-2032 ($MILLION)
- TABLE 30. U.S. SPACE LAUNCH SERVICES MARKET, BY LAUNCH VEHICLE, 2022-2032 ($MILLION)
- TABLE 31. U.S. SPACE LAUNCH SERVICES MARKET, BY END USER, 2022-2032 ($MILLION)
- TABLE 32. CANADA SPACE LAUNCH SERVICES MARKET, BY PAYLOAD, 2022-2032 ($MILLION)
- TABLE 33. CANADA SPACE LAUNCH SERVICES MARKET, BY LAUNCH PLATFORM, 2022-2032 ($MILLION)
- TABLE 34. CANADA SPACE LAUNCH SERVICES MARKET, BY SERVICE TYPE, 2022-2032 ($MILLION)
- TABLE 35. CANADA SPACE LAUNCH SERVICES MARKET, BY LAUNCH VEHICLE, 2022-2032 ($MILLION)
- TABLE 36. CANADA SPACE LAUNCH SERVICES MARKET, BY END USER, 2022-2032 ($MILLION)
- TABLE 37. EUROPE SPACE LAUNCH SERVICES MARKET, BY PAYLOAD, 2022-2032 ($MILLION)
- TABLE 38. EUROPE SPACE LAUNCH SERVICES MARKET, BY LAUNCH PLATFORM, 2022-2032 ($MILLION)
- TABLE 39. EUROPE SPACE LAUNCH SERVICES MARKET, BY SERVICE TYPE, 2022-2032 ($MILLION)
- TABLE 40. EUROPE SPACE LAUNCH SERVICES MARKET, BY LAUNCH VEHICLE, 2022-2032 ($MILLION)
- TABLE 41. EUROPE SPACE LAUNCH SERVICES MARKET, BY END USER, 2022-2032 ($MILLION)
- TABLE 42. EUROPE SPACE LAUNCH SERVICES MARKET, BY COUNTRY, 2022-2032 ($MILLION)
- TABLE 43. RUSSIA SPACE LAUNCH SERVICES MARKET, BY PAYLOAD, 2022-2032 ($MILLION)
- TABLE 44. RUSSIA SPACE LAUNCH SERVICES MARKET, BY LAUNCH PLATFORM, 2022-2032 ($MILLION)
- TABLE 45. RUSSIA SPACE LAUNCH SERVICES MARKET, BY SERVICE TYPE, 2022-2032 ($MILLION)
- TABLE 46. RUSSIA SPACE LAUNCH SERVICES MARKET, BY LAUNCH VEHICLE, 2022-2032 ($MILLION)
- TABLE 47. RUSSIA SPACE LAUNCH SERVICES MARKET, BY END USER, 2022-2032 ($MILLION)
- TABLE 48. FRANCE SPACE LAUNCH SERVICES MARKET, BY PAYLOAD, 2022-2032 ($MILLION)
- TABLE 49. FRANCE SPACE LAUNCH SERVICES MARKET, BY LAUNCH PLATFORM, 2022-2032 ($MILLION)
- TABLE 50. FRANCE SPACE LAUNCH SERVICES MARKET, BY SERVICE TYPE, 2022-2032 ($MILLION)
- TABLE 51. FRANCE SPACE LAUNCH SERVICES MARKET, BY LAUNCH VEHICLE, 2022-2032 ($MILLION)
- TABLE 52. FRANCE SPACE LAUNCH SERVICES MARKET, BY END USER, 2022-2032 ($MILLION)
- TABLE 53. GERMANY SPACE LAUNCH SERVICES MARKET, BY PAYLOAD, 2022-2032 ($MILLION)
- TABLE 54. GERMANY SPACE LAUNCH SERVICES MARKET, BY LAUNCH PLATFORM, 2022-2032 ($MILLION)
- TABLE 55. GERMANY SPACE LAUNCH SERVICES MARKET, BY SERVICE TYPE, 2022-2032 ($MILLION)
- TABLE 56. GERMANY SPACE LAUNCH SERVICES MARKET, BY LAUNCH VEHICLE, 2022-2032 ($MILLION)
- TABLE 57. GERMANY SPACE LAUNCH SERVICES MARKET, BY END USER, 2022-2032 ($MILLION)
- TABLE 58. ITALY SPACE LAUNCH SERVICES MARKET, BY PAYLOAD, 2022-2032 ($MILLION)
- TABLE 59. ITALY SPACE LAUNCH SERVICES MARKET, BY LAUNCH PLATFORM, 2022-2032 ($MILLION)
- TABLE 60. ITALY SPACE LAUNCH SERVICES MARKET, BY SERVICE TYPE, 2022-2032 ($MILLION)
- TABLE 61. ITALY SPACE LAUNCH SERVICES MARKET, BY LAUNCH VEHICLE, 2022-2032 ($MILLION)
- TABLE 62. ITALY SPACE LAUNCH SERVICES MARKET, BY END USER, 2022-2032 ($MILLION)
- TABLE 63. UK SPACE LAUNCH SERVICES MARKET, BY PAYLOAD, 2022-2032 ($MILLION)
- TABLE 64. UK SPACE LAUNCH SERVICES MARKET, BY LAUNCH PLATFORM, 2022-2032 ($MILLION)
- TABLE 65. UK SPACE LAUNCH SERVICES MARKET, BY SERVICE TYPE, 2022-2032 ($MILLION)
- TABLE 66. UK SPACE LAUNCH SERVICES MARKET, BY LAUNCH VEHICLE, 2022-2032 ($MILLION)
- TABLE 67. UK SPACE LAUNCH SERVICES MARKET, BY END USER, 2022-2032 ($MILLION)
- TABLE 68. REST OF EUROPE SPACE LAUNCH SERVICES MARKET, BY PAYLOAD, 2022-2032 ($MILLION)
- TABLE 69. REST OF EUROPE SPACE LAUNCH SERVICES MARKET, BY LAUNCH PLATFORM, 2022-2032 ($MILLION)
- TABLE 70. REST OF EUROPE SPACE LAUNCH SERVICES MARKET, BY SERVICE TYPE, 2022-2032 ($MILLION)
- TABLE 71. REST OF EUROPE SPACE LAUNCH SERVICES MARKET, BY LAUNCH VEHICLE, 2022-2032 ($MILLION)
- TABLE 72. REST OF EUROPE SPACE LAUNCH SERVICES MARKET, BY END USER, 2022-2032 ($MILLION)
- TABLE 73. ASIA-PACIFIC SPACE LAUNCH SERVICES MARKET, BY PAYLOAD, 2022-2032 ($MILLION)
- TABLE 74. ASIA-PACIFIC SPACE LAUNCH SERVICES MARKET, BY LAUNCH PLATFORM, 2022-2032 ($MILLION)
- TABLE 75. ASIA-PACIFIC SPACE LAUNCH SERVICES MARKET, BY SERVICE TYPE, 2022-2032 ($MILLION)
- TABLE 76. ASIA-PACIFIC SPACE LAUNCH SERVICES MARKET, BY LAUNCH VEHICLE, 2022-2032 ($MILLION)
- TABLE 77. ASIA-PACIFIC SPACE LAUNCH SERVICES MARKET, BY END USER, 2022-2032 ($MILLION)
- TABLE 78. ASIA-PACIFIC SPACE LAUNCH SERVICES MARKET, BY COUNTRY, 2022-2032 ($MILLION)
- TABLE 79. CHINA SPACE LAUNCH SERVICES MARKET, BY PAYLOAD, 2022-2032 ($MILLION)
- TABLE 80. CHINA SPACE LAUNCH SERVICES MARKET, BY LAUNCH PLATFORM, 2022-2032 ($MILLION)
- TABLE 81. CHINA SPACE LAUNCH SERVICES MARKET, BY SERVICE TYPE, 2022-2032 ($MILLION)
- TABLE 82. CHINA SPACE LAUNCH SERVICES MARKET, BY LAUNCH VEHICLE, 2022-2032 ($MILLION)
- TABLE 83. CHINA SPACE LAUNCH SERVICES MARKET, BY END USER, 2022-2032 ($MILLION)
- TABLE 84. JAPAN SPACE LAUNCH SERVICES MARKET, BY PAYLOAD, 2022-2032 ($MILLION)
- TABLE 85. JAPAN SPACE LAUNCH SERVICES MARKET, BY LAUNCH PLATFORM, 2022-2032 ($MILLION)
- TABLE 86. JAPAN SPACE LAUNCH SERVICES MARKET, BY SERVICE TYPE, 2022-2032 ($MILLION)
- TABLE 87. JAPAN SPACE LAUNCH SERVICES MARKET, BY LAUNCH VEHICLE, 2022-2032 ($MILLION)
- TABLE 88. JAPAN SPACE LAUNCH SERVICES MARKET, BY END USER, 2022-2032 ($MILLION)
- TABLE 89. INDIA SPACE LAUNCH SERVICES MARKET, BY PAYLOAD, 2022-2032 ($MILLION)
- TABLE 90. INDIA SPACE LAUNCH SERVICES MARKET, BY LAUNCH PLATFORM, 2022-2032 ($MILLION)
- TABLE 91. INDIA SPACE LAUNCH SERVICES MARKET, BY SERVICE TYPE, 2022-2032 ($MILLION)
- TABLE 92. INDIA SPACE LAUNCH SERVICES MARKET, BY LAUNCH VEHICLE, 2022-2032 ($MILLION)
- TABLE 93. INDIA SPACE LAUNCH SERVICES MARKET, BY END USER, 2022-2032 ($MILLION)
- TABLE 94. SOUTH KOREA SPACE LAUNCH SERVICES MARKET, BY PAYLOAD, 2022-2032 ($MILLION)
- TABLE 95. SOUTH KOREA SPACE LAUNCH SERVICES MARKET, BY LAUNCH PLATFORM, 2022-2032 ($MILLION)
- TABLE 96. SOUTH KOREA SPACE LAUNCH SERVICES MARKET, BY SERVICE TYPE, 2022-2032 ($MILLION)
- TABLE 97. SOUTH KOREA SPACE LAUNCH SERVICES MARKET, BY LAUNCH VEHICLE, 2022-2032 ($MILLION)
- TABLE 98. SOUTH KOREA SPACE LAUNCH SERVICES MARKET, BY END USER, 2022-2032 ($MILLION)
- TABLE 99. REST OF ASIA-PACIFIC SPACE LAUNCH SERVICES MARKET, BY PAYLOAD, 2022-2032 ($MILLION)
- TABLE 100. REST OF ASIA-PACIFIC SPACE LAUNCH SERVICES MARKET, BY LAUNCH PLATFORM, 2022-2032 ($MILLION)
- TABLE 101. REST OF ASIA-PACIFIC SPACE LAUNCH SERVICES MARKET, BY SERVICE TYPE, 2022-2032 ($MILLION)
- TABLE 102. REST OF ASIA-PACIFIC SPACE LAUNCH SERVICES MARKET, BY LAUNCH VEHICLE, 2022-2032 ($MILLION)
- TABLE 103. REST OF ASIA-PACIFIC SPACE LAUNCH SERVICES MARKET, BY END USER, 2022-2032 ($MILLION)
- TABLE 104. LAMEA SPACE LAUNCH SERVICES MARKET, BY PAYLOAD, 2022-2032 ($MILLION)
- TABLE 105. LAMEA SPACE LAUNCH SERVICES MARKET, BY LAUNCH PLATFORM, 2022-2032 ($MILLION)
- TABLE 106. LAMEA SPACE LAUNCH SERVICES MARKET, BY SERVICE TYPE, 2022-2032 ($MILLION)
- TABLE 107. LAMEA SPACE LAUNCH SERVICES MARKET, BY LAUNCH VEHICLE, 2022-2032 ($MILLION)
- TABLE 108. LAMEA SPACE LAUNCH SERVICES MARKET, BY END USER, 2022-2032 ($MILLION)
- TABLE 109. LAMEA SPACE LAUNCH SERVICES MARKET, BY COUNTRY, 2022-2032 ($MILLION)
- TABLE 110. LATIN AMERICA SPACE LAUNCH SERVICES MARKET, BY PAYLOAD, 2022-2032 ($MILLION)
- TABLE 111. LATIN AMERICA SPACE LAUNCH SERVICES MARKET, BY LAUNCH PLATFORM, 2022-2032 ($MILLION)
- TABLE 112. LATIN AMERICA SPACE LAUNCH SERVICES MARKET, BY SERVICE TYPE, 2022-2032 ($MILLION)
- TABLE 113. LATIN AMERICA SPACE LAUNCH SERVICES MARKET, BY LAUNCH VEHICLE, 2022-2032 ($MILLION)
- TABLE 114. LATIN AMERICA SPACE LAUNCH SERVICES MARKET, BY END USER, 2022-2032 ($MILLION)
- TABLE 115. MIDDLE EAST SPACE LAUNCH SERVICES MARKET, BY PAYLOAD, 2022-2032 ($MILLION)
- TABLE 116. MIDDLE EAST SPACE LAUNCH SERVICES MARKET, BY LAUNCH PLATFORM, 2022-2032 ($MILLION)
- TABLE 117. MIDDLE EAST SPACE LAUNCH SERVICES MARKET, BY SERVICE TYPE, 2022-2032 ($MILLION)
- TABLE 118. MIDDLE EAST SPACE LAUNCH SERVICES MARKET, BY LAUNCH VEHICLE, 2022-2032 ($MILLION)
- TABLE 119. MIDDLE EAST SPACE LAUNCH SERVICES MARKET, BY END USER, 2022-2032 ($MILLION)
- TABLE 120. AFRICA SPACE LAUNCH SERVICES MARKET, BY PAYLOAD, 2022-2032 ($MILLION)
- TABLE 121. AFRICA SPACE LAUNCH SERVICES MARKET, BY LAUNCH PLATFORM, 2022-2032 ($MILLION)
- TABLE 122. AFRICA SPACE LAUNCH SERVICES MARKET, BY SERVICE TYPE, 2022-2032 ($MILLION)
- TABLE 123. AFRICA SPACE LAUNCH SERVICES MARKET, BY LAUNCH VEHICLE, 2022-2032 ($MILLION)
- TABLE 124. AFRICA SPACE LAUNCH SERVICES MARKET, BY END USER, 2022-2032 ($MILLION)
- TABLE 125. AIRBUS: KEY EXECUTIVES
- TABLE 126. AIRBUS: COMPANY SNAPSHOT
- TABLE 127. AIRBUS: PRODUCT SEGMENTS
- TABLE 128. AIRBUS: PRODUCT PORTFOLIO
- TABLE 129. AIRBUS: KEY STRATERGIES
- TABLE 130. ANTRIX CORPORATION LIMITED: KEY EXECUTIVES
- TABLE 131. ANTRIX CORPORATION LIMITED: COMPANY SNAPSHOT
- TABLE 132. ANTRIX CORPORATION LIMITED: SERVICE SEGMENTS
- TABLE 133. ANTRIX CORPORATION LIMITED: PRODUCT PORTFOLIO
- TABLE 134. CHINA AEROSPACE SCIENCE AND TECHNOLOGY CORPORATION: KEY EXECUTIVES
- TABLE 135. CHINA AEROSPACE SCIENCE AND TECHNOLOGY CORPORATION: COMPANY SNAPSHOT
- TABLE 136. CHINA AEROSPACE SCIENCE AND TECHNOLOGY CORPORATION: PRODUCT SEGMENTS
- TABLE 137. CHINA AEROSPACE SCIENCE AND TECHNOLOGY CORPORATION: PRODUCT PORTFOLIO
- TABLE 138. LOCKHEED MARTIN CORPORATION.: KEY EXECUTIVES
- TABLE 139. LOCKHEED MARTIN CORPORATION.: COMPANY SNAPSHOT
- TABLE 140. LOCKHEED MARTIN CORPORATION.: PRODUCT SEGMENTS
- TABLE 141. LOCKHEED MARTIN CORPORATION.: PRODUCT PORTFOLIO
- TABLE 142. LOCKHEED MARTIN CORPORATION.: KEY STRATERGIES
- TABLE 143. MITSUBISHI HEAVY INDUSTRIES, LTD: KEY EXECUTIVES
- TABLE 144. MITSUBISHI HEAVY INDUSTRIES, LTD: COMPANY SNAPSHOT
- TABLE 145. MITSUBISHI HEAVY INDUSTRIES, LTD: PRODUCT SEGMENTS
- TABLE 146. MITSUBISHI HEAVY INDUSTRIES, LTD: PRODUCT PORTFOLIO
- TABLE 147. MITSUBISHI HEAVY INDUSTRIES, LTD: KEY STRATERGIES
- TABLE 148. NORTHROP GRUMMAN CORPORATION: KEY EXECUTIVES
- TABLE 149. NORTHROP GRUMMAN CORPORATION: COMPANY SNAPSHOT
- TABLE 150. NORTHROP GRUMMAN CORPORATION: PRODUCT SEGMENTS
- TABLE 151. NORTHROP GRUMMAN CORPORATION: PRODUCT PORTFOLIO
- TABLE 152. NORTHROP GRUMMAN CORPORATION: KEY STRATERGIES
- TABLE 153. ROCKET LAB USA: KEY EXECUTIVES
- TABLE 154. ROCKET LAB USA: COMPANY SNAPSHOT
- TABLE 155. ROCKET LAB USA: PRODUCT SEGMENTS
- TABLE 156. ROCKET LAB USA: PRODUCT PORTFOLIO
- TABLE 157. ROCKET LAB USA: KEY STRATERGIES
- TABLE 158. SAFRAN SA: KEY EXECUTIVES
- TABLE 159. SAFRAN SA: COMPANY SNAPSHOT
- TABLE 160. SAFRAN SA: PRODUCT SEGMENTS
- TABLE 161. SAFRAN SA: PRODUCT PORTFOLIO
- TABLE 162. SAFRAN SA: KEY STRATERGIES
- TABLE 163. SPACEX: KEY EXECUTIVES
- TABLE 164. SPACEX: COMPANY SNAPSHOT
- TABLE 165. SPACEX: PRODUCT SEGMENTS
- TABLE 166. SPACEX: PRODUCT PORTFOLIO
- TABLE 167. SPACEX: KEY STRATERGIES
- TABLE 168. STARSEM: KEY EXECUTIVES
- TABLE 169. STARSEM: COMPANY SNAPSHOT
- TABLE 170. STARSEM: PRODUCT SEGMENTS
- TABLE 171. STARSEM: PRODUCT PORTFOLIO
- TABLE 172. STARSEM: KEY STRATERGIES
LIST OF FIGURES
- FIGURE 01. SPACE LAUNCH SERVICES MARKET, 2022-2032
- FIGURE 02. SEGMENTATION OF SPACE LAUNCH SERVICES MARKET,2022-2032
- FIGURE 03. TOP INVESTMENT POCKETS IN SPACE LAUNCH SERVICES MARKET (2023-2032)
- FIGURE 04. LOW BARGAINING POWER OF SUPPLIERS
- FIGURE 05. LOW THREAT OF NEW ENTRANTS
- FIGURE 06. LOW THREAT OF SUBSTITUTES
- FIGURE 07. LOW INTENSITY OF RIVALRY
- FIGURE 08. LOW BARGAINING POWER OF BUYERS
- FIGURE 09. GLOBAL SPACE LAUNCH SERVICES MARKET:DRIVERS, RESTRAINTS AND OPPORTUNITIES
- FIGURE 10. SPACE LAUNCH SERVICES MARKET, BY PAYLOAD, 2022(%)
- FIGURE 11. COMPARATIVE SHARE ANALYSIS OF SPACE LAUNCH SERVICES MARKET FOR SATELLITE, BY COUNTRY 2022 AND 2032(%)
- FIGURE 12. COMPARATIVE SHARE ANALYSIS OF SPACE LAUNCH SERVICES MARKET FOR HUMAN SPACEFLIGHT, BY COUNTRY 2022 AND 2032(%)
- FIGURE 13. COMPARATIVE SHARE ANALYSIS OF SPACE LAUNCH SERVICES MARKET FOR CARGO, BY COUNTRY 2022 AND 2032(%)
- FIGURE 14. COMPARATIVE SHARE ANALYSIS OF SPACE LAUNCH SERVICES MARKET FOR TESTING PROBES, BY COUNTRY 2022 AND 2032(%)
- FIGURE 15. COMPARATIVE SHARE ANALYSIS OF SPACE LAUNCH SERVICES MARKET FOR STRATOLLITES, BY COUNTRY 2022 AND 2032(%)
- FIGURE 16. SPACE LAUNCH SERVICES MARKET, BY LAUNCH PLATFORM, 2022(%)
- FIGURE 17. COMPARATIVE SHARE ANALYSIS OF SPACE LAUNCH SERVICES MARKET FOR LAND, BY COUNTRY 2022 AND 2032(%)
- FIGURE 18. COMPARATIVE SHARE ANALYSIS OF SPACE LAUNCH SERVICES MARKET FOR AIR, BY COUNTRY 2022 AND 2032(%)
- FIGURE 19. COMPARATIVE SHARE ANALYSIS OF SPACE LAUNCH SERVICES MARKET FOR SEA, BY COUNTRY 2022 AND 2032(%)
- FIGURE 20. SPACE LAUNCH SERVICES MARKET, BY SERVICE TYPE, 2022(%)
- FIGURE 21. COMPARATIVE SHARE ANALYSIS OF SPACE LAUNCH SERVICES MARKET FOR PRE LAUNCH, BY COUNTRY 2022 AND 2032(%)
- FIGURE 22. COMPARATIVE SHARE ANALYSIS OF SPACE LAUNCH SERVICES MARKET FOR POST LAUNCH, BY COUNTRY 2022 AND 2032(%)
- FIGURE 23. SPACE LAUNCH SERVICES MARKET, BY LAUNCH VEHICLE, 2022(%)
- FIGURE 24. COMPARATIVE SHARE ANALYSIS OF SPACE LAUNCH SERVICES MARKET FOR SMALL LAUNCH VEHICLE, BY COUNTRY 2022 AND 2032(%)
- FIGURE 25. COMPARATIVE SHARE ANALYSIS OF SPACE LAUNCH SERVICES MARKET FOR HEAVY LAUNCH VEHICLE, BY COUNTRY 2022 AND 2032(%)
- FIGURE 26. SPACE LAUNCH SERVICES MARKET, BY END USER, 2022(%)
- FIGURE 27. COMPARATIVE SHARE ANALYSIS OF SPACE LAUNCH SERVICES MARKET FOR GOVERNMENT AND MILITARY, BY COUNTRY 2022 AND 2032(%)
- FIGURE 28. COMPARATIVE SHARE ANALYSIS OF SPACE LAUNCH SERVICES MARKET FOR COMMERCIAL, BY COUNTRY 2022 AND 2032(%)
- FIGURE 29. SPACE LAUNCH SERVICES MARKET BY REGION, 2022(%)
- FIGURE 30. U.S. SPACE LAUNCH SERVICES MARKET, 2022-2032 ($MILLION)
- FIGURE 31. CANADA SPACE LAUNCH SERVICES MARKET, 2022-2032 ($MILLION)
- FIGURE 32. RUSSIA SPACE LAUNCH SERVICES MARKET, 2022-2032 ($MILLION)
- FIGURE 33. FRANCE SPACE LAUNCH SERVICES MARKET, 2022-2032 ($MILLION)
- FIGURE 34. GERMANY SPACE LAUNCH SERVICES MARKET, 2022-2032 ($MILLION)
- FIGURE 35. ITALY SPACE LAUNCH SERVICES MARKET, 2022-2032 ($MILLION)
- FIGURE 36. UK SPACE LAUNCH SERVICES MARKET, 2022-2032 ($MILLION)
- FIGURE 37. REST OF EUROPE SPACE LAUNCH SERVICES MARKET, 2022-2032 ($MILLION)
- FIGURE 38. CHINA SPACE LAUNCH SERVICES MARKET, 2022-2032 ($MILLION)
- FIGURE 39. JAPAN SPACE LAUNCH SERVICES MARKET, 2022-2032 ($MILLION)
- FIGURE 40. INDIA SPACE LAUNCH SERVICES MARKET, 2022-2032 ($MILLION)
- FIGURE 41. SOUTH KOREA SPACE LAUNCH SERVICES MARKET, 2022-2032 ($MILLION)
- FIGURE 42. REST OF ASIA-PACIFIC SPACE LAUNCH SERVICES MARKET, 2022-2032 ($MILLION)
- FIGURE 43. LATIN AMERICA SPACE LAUNCH SERVICES MARKET, 2022-2032 ($MILLION)
- FIGURE 44. MIDDLE EAST SPACE LAUNCH SERVICES MARKET, 2022-2032 ($MILLION)
- FIGURE 45. AFRICA SPACE LAUNCH SERVICES MARKET, 2022-2032 ($MILLION)
- FIGURE 46. TOP WINNING STRATEGIES, BY YEAR
- FIGURE 47. TOP WINNING STRATEGIES, BY DEVELOPMENT
- FIGURE 48. TOP WINNING STRATEGIES, BY COMPANY
- FIGURE 49. PRODUCT MAPPING OF TOP 10 PLAYERS
- FIGURE 50. COMPETITIVE DASHBOARD
- FIGURE 51. COMPETITIVE HEATMAP: SPACE LAUNCH SERVICES MARKET
- FIGURE 52. TOP PLAYER POSITIONING, 2022
- FIGURE 53. AIRBUS: NET REVENUE, 2020-2022 ($MILLION)
- FIGURE 54. AIRBUS: RESEARCH & DEVELOPMENT EXPENDITURE, 2020-2022 ($MILLION)
- FIGURE 55. AIRBUS: REVENUE SHARE BY REGION, 2022 (%)
- FIGURE 56. AIRBUS: REVENUE SHARE BY SEGMENT, 2022 (%)
- FIGURE 57. ANTRIX CORPORATION LIMITED: NET REVENUE, 2019-2021 ($MILLION)
- FIGURE 58. LOCKHEED MARTIN CORPORATION.: NET SALES, 2020-2022 ($MILLION)
- FIGURE 59. LOCKHEED MARTIN CORPORATION.: RESEARCH & DEVELOPMENT EXPENDITURE, 2020-2022 ($MILLION)
- FIGURE 60. LOCKHEED MARTIN CORPORATION.: REVENUE SHARE BY SEGMENT, 2022 (%)
- FIGURE 61. LOCKHEED MARTIN CORPORATION.: REVENUE SHARE BY REGION, 2022 (%)
- FIGURE 62. MITSUBISHI HEAVY INDUSTRIES, LTD: NET SALES, 2020-2022 ($MILLION)
- FIGURE 63. MITSUBISHI HEAVY INDUSTRIES, LTD: RESEARCH & DEVELOPMENT EXPENDITURE, 2020-2022 ($MILLION)
- FIGURE 64. MITSUBISHI HEAVY INDUSTRIES, LTD: REVENUE SHARE BY SEGMENT, 2022 (%)
- FIGURE 65. MITSUBISHI HEAVY INDUSTRIES, LTD: REVENUE SHARE BY REGION, 2022 (%)
- FIGURE 66. NORTHROP GRUMMAN CORPORATION: RESEARCH & DEVELOPMENT EXPENDITURE, 2019-2021 ($MILLION)
- FIGURE 67. NORTHROP GRUMMAN CORPORATION: NET SALES, 2019-2021 ($MILLION)
- FIGURE 68. NORTHROP GRUMMAN CORPORATION: REVENUE SHARE BY SEGMENT, 2021 (%)
- FIGURE 69. NORTHROP GRUMMAN CORPORATION: REVENUE SHARE BY REGION, 2021 (%)
- FIGURE 70. ROCKET LAB USA: NET REVENUE, 2020-2022 ($MILLION)
- FIGURE 71. ROCKET LAB USA: RESEARCH & DEVELOPMENT EXPENDITURE, 2020-2022 ($MILLION)
- FIGURE 72. ROCKET LAB USA: REVENUE SHARE BY REGION, 2022 (%)
- FIGURE 73. ROCKET LAB USA: REVENUE SHARE BY SEGMENT, 2022 (%)
- FIGURE 74. SAFRAN S.A.: NET REVENUE, 2020-2022 ($MILLION)
- FIGURE 75. SAFRAN S.A.: RESEARCH & DEVELOPMENT EXPENDITURE, 2020-2022 ($MILLION)
- FIGURE 76. SAFRAN S.A.: REVENUE SHARE BY SEGMENT, 2022 (%)
 2025 年全球航太發射服務市場報告
 航太發射服務市場規模、佔有率、成長分析,按火箭、按發射類型、按軌道、按有效載荷、按服務類型、按最終用戶、按地區 - 行業預測,2025-2032 年
 航太發射服務市場:按服務、有效載荷、火箭尺寸、軌道、發射平台、最終用戶分類 - 2025-2030 年全球預測到 2033 年全球航太發射服務市場、機會與策略
 航太發射服務市場規模、佔有率和趨勢分析報告:按服務類型、有效載荷、發射平台、發射類型、運載火箭、最終用途、地區和細分市場預測,2024-2030年
 航太發射服務市場 - 2018-2028 年全球產業規模、佔有率、趨勢機會和預測,按軌道類型、運載火箭、有效載荷、地區、競爭細分