


 |
市場調查報告書
商品編碼
1344458
瓶裝水處理系統市場:按容量、按技術、按應用:2023-2032 年全球機會分析與產業預測Bottled Water Processing System Market By Capacity, By Technology (Filtration, UV treatment, Reverse Osmosis, Packaging, Other), By Application : Global Opportunity Analysis and Industry Forecast, 2023-2032 |
||||||
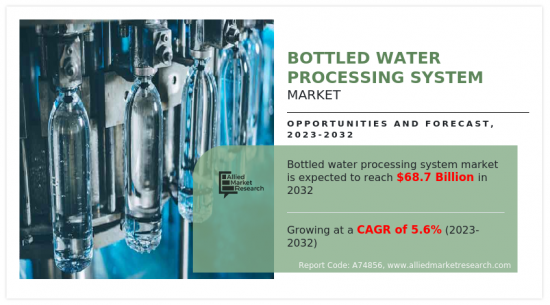
2022年瓶裝水處理系統市值為394億美元,預計2023年至2032年複合年增長率為5.6%,到2032年達到687億美元。
瓶裝水處理系統主要由各類水淨化系統及包裝系統所組成。 過濾裝置、紫外線處理系統和逆滲透裝置是瓶裝水處理系統中最常使用的淨化技術。 此外,吹塑機、清洗機和灌裝機、封蓋機和貼標機也廣泛用於水瓶裝應用。
由於世界人口的成長,對水、食物和藥品等必需品的需求大幅增加。 此外,喝水對於保持健康和避免脫水是必要的。 因此,瓶裝水是全球消費最多的飲料之一,預計未來幾年對瓶裝水的需求將進一步增加,從而推動瓶裝水處理系統市場的成長。
此外,瓶裝水還具有許多優點,包括保證純度和在公共場所易於取得。 此外,瓶裝水的容量範圍通常從 200 毫升到 2000 公升不等。 這些因素增加了瓶裝水的利用率並增加了對瓶裝水處理系統的需求。
此外,已開發國家和新興國家大型零售店的增加也對市場產生正面影響。 例如,大型商店以低廉的價格提供各種瓶裝水(靜止水、氣泡水和調味水)。 這增加了它在群眾中的受歡迎程度。
然而,瓶裝水處理系統的高初始成本和高營運成本等因素可能會阻礙市場成長。 此外,日益嚴重的環境問題和瓶裝水使用的塑膠用量的增加給瓶裝水市場帶來了挑戰。
此外,已開發國家的人均瓶裝水消費量高於開發中國家。 例如,2021 年瓶裝水銷量將超過 150 億加侖,高於 2011 年的近 90 億加侖。 這導致 10 年內成長約 65%。 此外,在研究期間,瓶裝水的消費量預計將進一步增加。 此外,瓶裝水產業的領先公司正在投資業務擴張以維持市場份額。 例如,2023年1月,主要飲料製造商尼加拉裝瓶公司投資1.6億美元在路易斯安那州建立工廠。 新廠將生產氣泡水、維生素水、風味水、即飲咖啡、瓶裝水等。
目錄
第一章簡介
第 2 章執行摘要
第三章市場概述
- 市場定義和範圍
- 主要發現
- 影響因素
- 主要投資機會
- 波特五力分析
- 市場動態
- 促進因素
- 提高公共衛生意識
- 水資源日益短缺
- 都市化進程
- 抑制因素
- 政府法規
- 環境問題增多
- 機會
- 新技術的採用和優質瓶裝水需求的增加
- 促進因素
- 新冠肺炎 (COVID-19) 市場影響分析
第 4 章瓶裝水處理系統市場:依容量劃分
- 摘要
- 每天少於 10,000 公升
- 10,001 至 30,000 公升/天
- 超過 30,000 公升/天
第 5 章瓶裝水處理系統市場:依技術
- 摘要
- 過濾
- 紫外線處理
- 逆滲透 (RO)
- 包裝
- 其他
第 6 章瓶裝水處理系統市場:依應用分類
- 摘要
- 斯蒂爾沃特
- 蘇打水
- 其他
第七章瓶裝水處理系統市場:依地區
- 摘要
- 北美
- 美國
- 加拿大
- 墨西哥
- 歐洲
- 德國
- 英國
- 法國
- 義大利
- 歐洲其他地區
- 亞太地區
- 中國
- 日本
- 印度
- 韓國
- 其他亞太地區
- 拉丁美洲
- 拉丁美洲
- 中東
- 非洲
第八章競爭態勢
- 簡介
- 關鍵成功策略
- 10家主要公司的產品圖譜
- 競爭對手儀表板
- 競爭熱圖
- 2022 年主要公司的定位
第九章公司簡介
- Merck KGaA
- E-Rotek Water Systems Co., Ltd.
- Shivsu Canadian Clear Water Technology Private Limited
- Evergreen Technologies
- Creative OZ-Air(I)Pvt Ltd
- Accutek Packaging Equipment Companies, Inc.
- Tetra Laval S.A.
- Lenntech B.V.
- Danaher Corporation(Pall Corporation)
- Marlo Incorporated
According to a new report published by Allied Market Research, titled, "Bottled Water Processing System Market," The bottled water processing system market was valued at $39.4 billion in 2022, and is estimated to reach $68.7 billion by 2032, growing at a CAGR of 5.6% from 2023 to 2032.
Bottled water processing systems primarily consist of a wide range of water purification and packaging systems. Filtrations units, UV treatment systems, and reverse osmosis equipment are some of the most used purification technologies in bottled water processing systems. And blow molders, washers & fillers, capping machines, and labeling machines are extensively used for water bottling applications.
The increasing global population has significantly increased the demand for essential products such as water, food, and medicines. Furthermore, consumption of water is necessary for maintaining good health and avoiding dehydration. Thus, bottled water is one of the most consumed beverages across the globe, and the demand for bottled water is further expected to increase in the coming years, thereby driving the growth of the bottled water processing system market.
Furthermore, bottled water has various advantages such as assurance of purity, and easy availability in public places. In addition, bottled water is available in a wide range of sizes typically ranging from 200 ml to 2000 liters. These factors increase the practicality of bottled water and increase the demand for bottled water processing systems.
Moreover, the rise in number of large retail stores in developed and developing countries has also positively influenced the market. For instance, large retail outlets provide a wide range of still, sparkling and flavored bottled water at discounted prices. Thereby, increasing its popularity among the masses.
However, factors such as high initial and operating costs of bottled water processing systems can hamper the growth of the market. Furthermore, the increase in environmental concerns and increased use of plastic for water bottling has created challenges for the bottled water market.
Moreover, the per capita consumption of bottled water is more in developed countries as compared to developing countries. For instance, the sales of bottled water reached over 15 billion gallons in 2021 up from nearly 9 billion gallons in 2011. Thereby, witnessing a growth of around 65% in a span of 10 years. And the consumption of bottled water is further expected to increase throughout the study period. Furthermore, major players in the bottled water industry are investing in business expansion in order to maintain their market share. For instance, in January 2023, Niagara Bottling, a major manufacturer of beverages has invested $160 million to set up a facility in Louisiana. The new facility will be involved in manufacturing drinks like sparkling, vitamin and flavored waters, ready-to-drink coffee, and bottled water.
Region wise, it is analyzed across North America (the U.S., Canada, and Mexico), Europe (Germany, France, UK, Italy, and rest of Europe), Asia-Pacific (China, Japan, India, South Korea, and rest of Asia-Pacific), and LAMEA (Latin America, the Middle East, and Africa).
The major players profiled in the global bottled water processing system market include Merck KGaA, Creative OZ-Air (I) Pvt Ltd., E-Rotek Water Systems Co., Ltd., Shivsu Canadian Clear Water Technology Private Limited, Evergreen Technologies, Tetra Laval S.A., Accutek Packaging Equipment Companies, Inc., Lenntech B.V., Danaher Corporation (Pall Corporation), and Marlo Incorporated.
Major companies in the market have adopted acquisition, product launch, business expansion, and other strategies as their key developmental strategies to offer better products and services to customers in the bottled water processing system market.
Key Benefits For Stakeholders
- This report provides a quantitative analysis of the market segments, current trends, estimations, and dynamics of the bottled water processing system market analysis from 2022 to 2032 to identify the prevailing bottled water processing system market opportunities.
- The market research is offered along with information related to key drivers, restraints, and opportunities.
- Porter's five forces analysis highlights the potency of buyers and suppliers to enable stakeholders make profit-oriented business decisions and strengthen their supplier-buyer network.
- In-depth analysis of the bottled water processing system market segmentation assists to determine the prevailing market opportunities.
- Major countries in each region are mapped according to their revenue contribution to the global market.
- Market player positioning facilitates benchmarking and provides a clear understanding of the present position of the market players.
- The report includes the analysis of the regional as well as global bottled water processing system market trends, key players, market segments, application areas, and market growth strategies.
Key Market Segments
By Capacity
- Less than 10,000 litres per day
- 10,001 to 30,000 litres per day
- More than 30,000 litres per day
By Technology
- Filtration
- UV treatment
- Reverse Osmosis (RO)
- Packaging
- Other
By Application
- Still water
- Sparkling water
- Other
By Region
- North America
- U.S.
- Canada
- Mexico
- Europe
- Germany
- UK
- France
- Italy
- Rest of Europe
- Asia-Pacific
- China
- Japan
- India
- South Korea
- Rest of Asia-Pacific
- LAMEA
- Latin America
- Middle East
- Africa
Key Market Players:
- Accutek Packaging Equipment Companies, Inc.
- Creative OZ-Air (I) Pvt Ltd
- Danaher Corporation (Pall Corporation)
- E-Rotek Water Systems Co., Ltd.
- Evergreen Technologies
- Lenntech B.V.
- Marlo Incorporated
- Merck KGaA
- Shivsu Canadian Clear Water Technology Private Limited
- Tetra Laval S.A.
TABLE OF CONTENTS
CHAPTER 1: INTRODUCTION
- 1.1. Report description
- 1.2. Key market segments
- 1.3. Key benefits to the stakeholders
- 1.4. Research Methodology
- 1.4.1. Primary research
- 1.4.2. Secondary research
- 1.4.3. Analyst tools and models
CHAPTER 2: EXECUTIVE SUMMARY
- 2.1. CXO Perspective
CHAPTER 3: MARKET OVERVIEW
- 3.1. Market definition and scope
- 3.2. Key findings
- 3.2.1. Top impacting factors
- 3.2.2. Top investment pockets
- 3.3. Porter's five forces analysis
- 3.3.1. Low bargaining power of suppliers
- 3.3.2. Low threat of new entrants
- 3.3.3. Low threat of substitutes
- 3.3.4. Low intensity of rivalry
- 3.3.5. Low bargaining power of buyers
- 3.4. Market dynamics
- 3.4.1. Drivers
- 3.4.1.1. Increasing health awareness amongst masses
- 3.4.1.2. Increasing water scarcity
- 3.4.1.3. Increase in Urbanization
- 3.4.1. Drivers
- 3.4.2. Restraints
- 3.4.2.1. Government regulations
- 3.4.2.2. Increase in environmental concerns
- 3.4.3. Opportunities
- 3.4.3.1. Adoption of new technologies and rising demand for premium bottled water
- 3.5. COVID-19 Impact Analysis on the market
CHAPTER 4: BOTTLED WATER PROCESSING SYSTEM MARKET, BY CAPACITY
- 4.1. Overview
- 4.1.1. Market size and forecast
- 4.2. Less than 10,000 litres per day
- 4.2.1. Key market trends, growth factors and opportunities
- 4.2.2. Market size and forecast, by region
- 4.2.3. Market share analysis by country
- 4.3. 10,001 to 30,000 litres per day
- 4.3.1. Key market trends, growth factors and opportunities
- 4.3.2. Market size and forecast, by region
- 4.3.3. Market share analysis by country
- 4.4. More than 30,000 litres per day
- 4.4.1. Key market trends, growth factors and opportunities
- 4.4.2. Market size and forecast, by region
- 4.4.3. Market share analysis by country
CHAPTER 5: BOTTLED WATER PROCESSING SYSTEM MARKET, BY TECHNOLOGY
- 5.1. Overview
- 5.1.1. Market size and forecast
- 5.2. Filtration
- 5.2.1. Key market trends, growth factors and opportunities
- 5.2.2. Market size and forecast, by region
- 5.2.3. Market share analysis by country
- 5.3. UV treatment
- 5.3.1. Key market trends, growth factors and opportunities
- 5.3.2. Market size and forecast, by region
- 5.3.3. Market share analysis by country
- 5.4. Reverse Osmosis (RO)
- 5.4.1. Key market trends, growth factors and opportunities
- 5.4.2. Market size and forecast, by region
- 5.4.3. Market share analysis by country
- 5.5. Packaging
- 5.5.1. Key market trends, growth factors and opportunities
- 5.5.2. Market size and forecast, by region
- 5.5.3. Market share analysis by country
- 5.6. Other
- 5.6.1. Key market trends, growth factors and opportunities
- 5.6.2. Market size and forecast, by region
- 5.6.3. Market share analysis by country
CHAPTER 6: BOTTLED WATER PROCESSING SYSTEM MARKET, BY APPLICATION
- 6.1. Overview
- 6.1.1. Market size and forecast
- 6.2. Still water
- 6.2.1. Key market trends, growth factors and opportunities
- 6.2.2. Market size and forecast, by region
- 6.2.3. Market share analysis by country
- 6.3. Sparkling water
- 6.3.1. Key market trends, growth factors and opportunities
- 6.3.2. Market size and forecast, by region
- 6.3.3. Market share analysis by country
- 6.4. Other
- 6.4.1. Key market trends, growth factors and opportunities
- 6.4.2. Market size and forecast, by region
- 6.4.3. Market share analysis by country
CHAPTER 7: BOTTLED WATER PROCESSING SYSTEM MARKET, BY REGION
- 7.1. Overview
- 7.1.1. Market size and forecast By Region
- 7.2. North America
- 7.2.1. Key trends and opportunities
- 7.2.2. Market size and forecast, by Capacity
- 7.2.3. Market size and forecast, by Technology
- 7.2.4. Market size and forecast, by Application
- 7.2.5. Market size and forecast, by country
- 7.2.5.1. U.S.
- 7.2.5.1.1. Key market trends, growth factors and opportunities
- 7.2.5.1.2. Market size and forecast, by Capacity
- 7.2.5.1.3. Market size and forecast, by Technology
- 7.2.5.1.4. Market size and forecast, by Application
- 7.2.5.2. Canada
- 7.2.5.2.1. Key market trends, growth factors and opportunities
- 7.2.5.2.2. Market size and forecast, by Capacity
- 7.2.5.2.3. Market size and forecast, by Technology
- 7.2.5.2.4. Market size and forecast, by Application
- 7.2.5.3. Mexico
- 7.2.5.3.1. Key market trends, growth factors and opportunities
- 7.2.5.3.2. Market size and forecast, by Capacity
- 7.2.5.3.3. Market size and forecast, by Technology
- 7.2.5.3.4. Market size and forecast, by Application
- 7.3. Europe
- 7.3.1. Key trends and opportunities
- 7.3.2. Market size and forecast, by Capacity
- 7.3.3. Market size and forecast, by Technology
- 7.3.4. Market size and forecast, by Application
- 7.3.5. Market size and forecast, by country
- 7.3.5.1. Germany
- 7.3.5.1.1. Key market trends, growth factors and opportunities
- 7.3.5.1.2. Market size and forecast, by Capacity
- 7.3.5.1.3. Market size and forecast, by Technology
- 7.3.5.1.4. Market size and forecast, by Application
- 7.3.5.2. UK
- 7.3.5.2.1. Key market trends, growth factors and opportunities
- 7.3.5.2.2. Market size and forecast, by Capacity
- 7.3.5.2.3. Market size and forecast, by Technology
- 7.3.5.2.4. Market size and forecast, by Application
- 7.3.5.3. France
- 7.3.5.3.1. Key market trends, growth factors and opportunities
- 7.3.5.3.2. Market size and forecast, by Capacity
- 7.3.5.3.3. Market size and forecast, by Technology
- 7.3.5.3.4. Market size and forecast, by Application
- 7.3.5.4. Italy
- 7.3.5.4.1. Key market trends, growth factors and opportunities
- 7.3.5.4.2. Market size and forecast, by Capacity
- 7.3.5.4.3. Market size and forecast, by Technology
- 7.3.5.4.4. Market size and forecast, by Application
- 7.3.5.5. Rest of Europe
- 7.3.5.5.1. Key market trends, growth factors and opportunities
- 7.3.5.5.2. Market size and forecast, by Capacity
- 7.3.5.5.3. Market size and forecast, by Technology
- 7.3.5.5.4. Market size and forecast, by Application
- 7.4. Asia-Pacific
- 7.4.1. Key trends and opportunities
- 7.4.2. Market size and forecast, by Capacity
- 7.4.3. Market size and forecast, by Technology
- 7.4.4. Market size and forecast, by Application
- 7.4.5. Market size and forecast, by country
- 7.4.5.1. China
- 7.4.5.1.1. Key market trends, growth factors and opportunities
- 7.4.5.1.2. Market size and forecast, by Capacity
- 7.4.5.1.3. Market size and forecast, by Technology
- 7.4.5.1.4. Market size and forecast, by Application
- 7.4.5.2. Japan
- 7.4.5.2.1. Key market trends, growth factors and opportunities
- 7.4.5.2.2. Market size and forecast, by Capacity
- 7.4.5.2.3. Market size and forecast, by Technology
- 7.4.5.2.4. Market size and forecast, by Application
- 7.4.5.3. India
- 7.4.5.3.1. Key market trends, growth factors and opportunities
- 7.4.5.3.2. Market size and forecast, by Capacity
- 7.4.5.3.3. Market size and forecast, by Technology
- 7.4.5.3.4. Market size and forecast, by Application
- 7.4.5.4. South Korea
- 7.4.5.4.1. Key market trends, growth factors and opportunities
- 7.4.5.4.2. Market size and forecast, by Capacity
- 7.4.5.4.3. Market size and forecast, by Technology
- 7.4.5.4.4. Market size and forecast, by Application
- 7.4.5.5. Rest of Asia-Pacific
- 7.4.5.5.1. Key market trends, growth factors and opportunities
- 7.4.5.5.2. Market size and forecast, by Capacity
- 7.4.5.5.3. Market size and forecast, by Technology
- 7.4.5.5.4. Market size and forecast, by Application
- 7.5. LAMEA
- 7.5.1. Key trends and opportunities
- 7.5.2. Market size and forecast, by Capacity
- 7.5.3. Market size and forecast, by Technology
- 7.5.4. Market size and forecast, by Application
- 7.5.5. Market size and forecast, by country
- 7.5.5.1. Latin America
- 7.5.5.1.1. Key market trends, growth factors and opportunities
- 7.5.5.1.2. Market size and forecast, by Capacity
- 7.5.5.1.3. Market size and forecast, by Technology
- 7.5.5.1.4. Market size and forecast, by Application
- 7.5.5.2. Middle East
- 7.5.5.2.1. Key market trends, growth factors and opportunities
- 7.5.5.2.2. Market size and forecast, by Capacity
- 7.5.5.2.3. Market size and forecast, by Technology
- 7.5.5.2.4. Market size and forecast, by Application
- 7.5.5.3. Africa
- 7.5.5.3.1. Key market trends, growth factors and opportunities
- 7.5.5.3.2. Market size and forecast, by Capacity
- 7.5.5.3.3. Market size and forecast, by Technology
- 7.5.5.3.4. Market size and forecast, by Application
CHAPTER 8: COMPETITIVE LANDSCAPE
- 8.1. Introduction
- 8.2. Top winning strategies
- 8.3. Product Mapping of Top 10 Player
- 8.4. Competitive Dashboard
- 8.5. Competitive Heatmap
- 8.6. Top player positioning, 2022
CHAPTER 9: COMPANY PROFILES
- 9.1. Merck KGaA
- 9.1.1. Company overview
- 9.1.2. Key Executives
- 9.1.3. Company snapshot
- 9.1.4. Operating business segments
- 9.1.5. Product portfolio
- 9.1.6. Business performance
- 9.2. E-Rotek Water Systems Co., Ltd.
- 9.2.1. Company overview
- 9.2.2. Key Executives
- 9.2.3. Company snapshot
- 9.2.4. Operating business segments
- 9.2.5. Product portfolio
- 9.3. Shivsu Canadian Clear Water Technology Private Limited
- 9.3.1. Company overview
- 9.3.2. Key Executives
- 9.3.3. Company snapshot
- 9.3.4. Operating business segments
- 9.3.5. Product portfolio
- 9.4. Evergreen Technologies
- 9.4.1. Company overview
- 9.4.2. Key Executives
- 9.4.3. Company snapshot
- 9.4.4. Operating business segments
- 9.4.5. Product portfolio
- 9.5. Creative OZ-Air (I) Pvt Ltd
- 9.5.1. Company overview
- 9.5.2. Key Executives
- 9.5.3. Company snapshot
- 9.5.4. Operating business segments
- 9.5.5. Product portfolio
- 9.6. Accutek Packaging Equipment Companies, Inc.
- 9.6.1. Company overview
- 9.6.2. Key Executives
- 9.6.3. Company snapshot
- 9.6.4. Operating business segments
- 9.6.5. Product portfolio
- 9.7. Tetra Laval S.A.
- 9.7.1. Company overview
- 9.7.2. Key Executives
- 9.7.3. Company snapshot
- 9.7.4. Operating business segments
- 9.7.5. Product portfolio
- 9.7.6. Business performance
- 9.8. Lenntech B.V.
- 9.8.1. Company overview
- 9.8.2. Key Executives
- 9.8.3. Company snapshot
- 9.8.4. Operating business segments
- 9.8.5. Product portfolio
- 9.9. Danaher Corporation (Pall Corporation)
- 9.9.1. Company overview
- 9.9.2. Key Executives
- 9.9.3. Company snapshot
- 9.9.4. Operating business segments
- 9.9.5. Product portfolio
- 9.9.6. Business performance
- 9.10. Marlo Incorporated
- 9.10.1. Company overview
- 9.10.2. Key Executives
- 9.10.3. Company snapshot
- 9.10.4. Operating business segments
- 9.10.5. Product portfolio
LIST OF TABLES
- TABLE 01. GLOBAL BOTTLED WATER PROCESSING SYSTEM MARKET, BY CAPACITY, 2022-2032 ($MILLION)
- TABLE 02. BOTTLED WATER PROCESSING SYSTEM MARKET FOR LESS THAN 10,000 LITRES PER DAY, BY REGION, 2022-2032 ($MILLION)
- TABLE 03. BOTTLED WATER PROCESSING SYSTEM MARKET FOR 10,001 TO 30,000 LITRES PER DAY, BY REGION, 2022-2032 ($MILLION)
- TABLE 04. BOTTLED WATER PROCESSING SYSTEM MARKET FOR MORE THAN 30,000 LITRES PER DAY, BY REGION, 2022-2032 ($MILLION)
- TABLE 05. GLOBAL BOTTLED WATER PROCESSING SYSTEM MARKET, BY TECHNOLOGY, 2022-2032 ($MILLION)
- TABLE 06. BOTTLED WATER PROCESSING SYSTEM MARKET FOR FILTRATION, BY REGION, 2022-2032 ($MILLION)
- TABLE 07. BOTTLED WATER PROCESSING SYSTEM MARKET FOR UV TREATMENT, BY REGION, 2022-2032 ($MILLION)
- TABLE 08. BOTTLED WATER PROCESSING SYSTEM MARKET FOR REVERSE OSMOSIS (RO), BY REGION, 2022-2032 ($MILLION)
- TABLE 09. BOTTLED WATER PROCESSING SYSTEM MARKET FOR PACKAGING, BY REGION, 2022-2032 ($MILLION)
- TABLE 10. BOTTLED WATER PROCESSING SYSTEM MARKET FOR OTHER, BY REGION, 2022-2032 ($MILLION)
- TABLE 11. GLOBAL BOTTLED WATER PROCESSING SYSTEM MARKET, BY APPLICATION, 2022-2032 ($MILLION)
- TABLE 12. BOTTLED WATER PROCESSING SYSTEM MARKET FOR STILL WATER, BY REGION, 2022-2032 ($MILLION)
- TABLE 13. BOTTLED WATER PROCESSING SYSTEM MARKET FOR SPARKLING WATER, BY REGION, 2022-2032 ($MILLION)
- TABLE 14. BOTTLED WATER PROCESSING SYSTEM MARKET FOR OTHER, BY REGION, 2022-2032 ($MILLION)
- TABLE 15. BOTTLED WATER PROCESSING SYSTEM MARKET, BY REGION, 2022-2032 ($MILLION)
- TABLE 16. NORTH AMERICA BOTTLED WATER PROCESSING SYSTEM MARKET, BY CAPACITY, 2022-2032 ($MILLION)
- TABLE 17. NORTH AMERICA BOTTLED WATER PROCESSING SYSTEM MARKET, BY TECHNOLOGY, 2022-2032 ($MILLION)
- TABLE 18. NORTH AMERICA BOTTLED WATER PROCESSING SYSTEM MARKET, BY APPLICATION, 2022-2032 ($MILLION)
- TABLE 19. NORTH AMERICA BOTTLED WATER PROCESSING SYSTEM MARKET, BY COUNTRY, 2022-2032 ($MILLION)
- TABLE 20. U.S. BOTTLED WATER PROCESSING SYSTEM MARKET, BY CAPACITY, 2022-2032 ($MILLION)
- TABLE 21. U.S. BOTTLED WATER PROCESSING SYSTEM MARKET, BY TECHNOLOGY, 2022-2032 ($MILLION)
- TABLE 22. U.S. BOTTLED WATER PROCESSING SYSTEM MARKET, BY APPLICATION, 2022-2032 ($MILLION)
- TABLE 23. CANADA BOTTLED WATER PROCESSING SYSTEM MARKET, BY CAPACITY, 2022-2032 ($MILLION)
- TABLE 24. CANADA BOTTLED WATER PROCESSING SYSTEM MARKET, BY TECHNOLOGY, 2022-2032 ($MILLION)
- TABLE 25. CANADA BOTTLED WATER PROCESSING SYSTEM MARKET, BY APPLICATION, 2022-2032 ($MILLION)
- TABLE 26. MEXICO BOTTLED WATER PROCESSING SYSTEM MARKET, BY CAPACITY, 2022-2032 ($MILLION)
- TABLE 27. MEXICO BOTTLED WATER PROCESSING SYSTEM MARKET, BY TECHNOLOGY, 2022-2032 ($MILLION)
- TABLE 28. MEXICO BOTTLED WATER PROCESSING SYSTEM MARKET, BY APPLICATION, 2022-2032 ($MILLION)
- TABLE 29. EUROPE BOTTLED WATER PROCESSING SYSTEM MARKET, BY CAPACITY, 2022-2032 ($MILLION)
- TABLE 30. EUROPE BOTTLED WATER PROCESSING SYSTEM MARKET, BY TECHNOLOGY, 2022-2032 ($MILLION)
- TABLE 31. EUROPE BOTTLED WATER PROCESSING SYSTEM MARKET, BY APPLICATION, 2022-2032 ($MILLION)
- TABLE 32. EUROPE BOTTLED WATER PROCESSING SYSTEM MARKET, BY COUNTRY, 2022-2032 ($MILLION)
- TABLE 33. GERMANY BOTTLED WATER PROCESSING SYSTEM MARKET, BY CAPACITY, 2022-2032 ($MILLION)
- TABLE 34. GERMANY BOTTLED WATER PROCESSING SYSTEM MARKET, BY TECHNOLOGY, 2022-2032 ($MILLION)
- TABLE 35. GERMANY BOTTLED WATER PROCESSING SYSTEM MARKET, BY APPLICATION, 2022-2032 ($MILLION)
- TABLE 36. UK BOTTLED WATER PROCESSING SYSTEM MARKET, BY CAPACITY, 2022-2032 ($MILLION)
- TABLE 37. UK BOTTLED WATER PROCESSING SYSTEM MARKET, BY TECHNOLOGY, 2022-2032 ($MILLION)
- TABLE 38. UK BOTTLED WATER PROCESSING SYSTEM MARKET, BY APPLICATION, 2022-2032 ($MILLION)
- TABLE 39. FRANCE BOTTLED WATER PROCESSING SYSTEM MARKET, BY CAPACITY, 2022-2032 ($MILLION)
- TABLE 40. FRANCE BOTTLED WATER PROCESSING SYSTEM MARKET, BY TECHNOLOGY, 2022-2032 ($MILLION)
- TABLE 41. FRANCE BOTTLED WATER PROCESSING SYSTEM MARKET, BY APPLICATION, 2022-2032 ($MILLION)
- TABLE 42. ITALY BOTTLED WATER PROCESSING SYSTEM MARKET, BY CAPACITY, 2022-2032 ($MILLION)
- TABLE 43. ITALY BOTTLED WATER PROCESSING SYSTEM MARKET, BY TECHNOLOGY, 2022-2032 ($MILLION)
- TABLE 44. ITALY BOTTLED WATER PROCESSING SYSTEM MARKET, BY APPLICATION, 2022-2032 ($MILLION)
- TABLE 45. REST OF EUROPE BOTTLED WATER PROCESSING SYSTEM MARKET, BY CAPACITY, 2022-2032 ($MILLION)
- TABLE 46. REST OF EUROPE BOTTLED WATER PROCESSING SYSTEM MARKET, BY TECHNOLOGY, 2022-2032 ($MILLION)
- TABLE 47. REST OF EUROPE BOTTLED WATER PROCESSING SYSTEM MARKET, BY APPLICATION, 2022-2032 ($MILLION)
- TABLE 48. ASIA-PACIFIC BOTTLED WATER PROCESSING SYSTEM MARKET, BY CAPACITY, 2022-2032 ($MILLION)
- TABLE 49. ASIA-PACIFIC BOTTLED WATER PROCESSING SYSTEM MARKET, BY TECHNOLOGY, 2022-2032 ($MILLION)
- TABLE 50. ASIA-PACIFIC BOTTLED WATER PROCESSING SYSTEM MARKET, BY APPLICATION, 2022-2032 ($MILLION)
- TABLE 51. ASIA-PACIFIC BOTTLED WATER PROCESSING SYSTEM MARKET, BY COUNTRY, 2022-2032 ($MILLION)
- TABLE 52. CHINA BOTTLED WATER PROCESSING SYSTEM MARKET, BY CAPACITY, 2022-2032 ($MILLION)
- TABLE 53. CHINA BOTTLED WATER PROCESSING SYSTEM MARKET, BY TECHNOLOGY, 2022-2032 ($MILLION)
- TABLE 54. CHINA BOTTLED WATER PROCESSING SYSTEM MARKET, BY APPLICATION, 2022-2032 ($MILLION)
- TABLE 55. JAPAN BOTTLED WATER PROCESSING SYSTEM MARKET, BY CAPACITY, 2022-2032 ($MILLION)
- TABLE 56. JAPAN BOTTLED WATER PROCESSING SYSTEM MARKET, BY TECHNOLOGY, 2022-2032 ($MILLION)
- TABLE 57. JAPAN BOTTLED WATER PROCESSING SYSTEM MARKET, BY APPLICATION, 2022-2032 ($MILLION)
- TABLE 58. INDIA BOTTLED WATER PROCESSING SYSTEM MARKET, BY CAPACITY, 2022-2032 ($MILLION)
- TABLE 59. INDIA BOTTLED WATER PROCESSING SYSTEM MARKET, BY TECHNOLOGY, 2022-2032 ($MILLION)
- TABLE 60. INDIA BOTTLED WATER PROCESSING SYSTEM MARKET, BY APPLICATION, 2022-2032 ($MILLION)
- TABLE 61. SOUTH KOREA BOTTLED WATER PROCESSING SYSTEM MARKET, BY CAPACITY, 2022-2032 ($MILLION)
- TABLE 62. SOUTH KOREA BOTTLED WATER PROCESSING SYSTEM MARKET, BY TECHNOLOGY, 2022-2032 ($MILLION)
- TABLE 63. SOUTH KOREA BOTTLED WATER PROCESSING SYSTEM MARKET, BY APPLICATION, 2022-2032 ($MILLION)
- TABLE 64. REST OF ASIA-PACIFIC BOTTLED WATER PROCESSING SYSTEM MARKET, BY CAPACITY, 2022-2032 ($MILLION)
- TABLE 65. REST OF ASIA-PACIFIC BOTTLED WATER PROCESSING SYSTEM MARKET, BY TECHNOLOGY, 2022-2032 ($MILLION)
- TABLE 66. REST OF ASIA-PACIFIC BOTTLED WATER PROCESSING SYSTEM MARKET, BY APPLICATION, 2022-2032 ($MILLION)
- TABLE 67. LAMEA BOTTLED WATER PROCESSING SYSTEM MARKET, BY CAPACITY, 2022-2032 ($MILLION)
- TABLE 68. LAMEA BOTTLED WATER PROCESSING SYSTEM MARKET, BY TECHNOLOGY, 2022-2032 ($MILLION)
- TABLE 69. LAMEA BOTTLED WATER PROCESSING SYSTEM MARKET, BY APPLICATION, 2022-2032 ($MILLION)
- TABLE 70. LAMEA BOTTLED WATER PROCESSING SYSTEM MARKET, BY COUNTRY, 2022-2032 ($MILLION)
- TABLE 71. LATIN AMERICA BOTTLED WATER PROCESSING SYSTEM MARKET, BY CAPACITY, 2022-2032 ($MILLION)
- TABLE 72. LATIN AMERICA BOTTLED WATER PROCESSING SYSTEM MARKET, BY TECHNOLOGY, 2022-2032 ($MILLION)
- TABLE 73. LATIN AMERICA BOTTLED WATER PROCESSING SYSTEM MARKET, BY APPLICATION, 2022-2032 ($MILLION)
- TABLE 74. MIDDLE EAST BOTTLED WATER PROCESSING SYSTEM MARKET, BY CAPACITY, 2022-2032 ($MILLION)
- TABLE 75. MIDDLE EAST BOTTLED WATER PROCESSING SYSTEM MARKET, BY TECHNOLOGY, 2022-2032 ($MILLION)
- TABLE 76. MIDDLE EAST BOTTLED WATER PROCESSING SYSTEM MARKET, BY APPLICATION, 2022-2032 ($MILLION)
- TABLE 77. AFRICA BOTTLED WATER PROCESSING SYSTEM MARKET, BY CAPACITY, 2022-2032 ($MILLION)
- TABLE 78. AFRICA BOTTLED WATER PROCESSING SYSTEM MARKET, BY TECHNOLOGY, 2022-2032 ($MILLION)
- TABLE 79. AFRICA BOTTLED WATER PROCESSING SYSTEM MARKET, BY APPLICATION, 2022-2032 ($MILLION)
- TABLE 80. MERCK KGAA: KEY EXECUTIVES
- TABLE 81. MERCK KGAA: COMPANY SNAPSHOT
- TABLE 82. MERCK KGAA: PRODUCT SEGMENTS
- TABLE 83. MERCK KGAA: PRODUCT PORTFOLIO
- TABLE 84. E-ROTEK WATER SYSTEMS CO., LTD.: KEY EXECUTIVES
- TABLE 85. E-ROTEK WATER SYSTEMS CO., LTD.: COMPANY SNAPSHOT
- TABLE 86. E-ROTEK WATER SYSTEMS CO., LTD.: PRODUCT SEGMENTS
- TABLE 87. E-ROTEK WATER SYSTEMS CO., LTD.: PRODUCT PORTFOLIO
- TABLE 88. SHIVSU CANADIAN CLEAR WATER TECHNOLOGY PRIVATE LIMITED: KEY EXECUTIVES
- TABLE 89. SHIVSU CANADIAN CLEAR WATER TECHNOLOGY PRIVATE LIMITED: COMPANY SNAPSHOT
- TABLE 90. SHIVSU CANADIAN CLEAR WATER TECHNOLOGY PRIVATE LIMITED: PRODUCT SEGMENTS
- TABLE 91. SHIVSU CANADIAN CLEAR WATER TECHNOLOGY PRIVATE LIMITED: PRODUCT PORTFOLIO
- TABLE 92. EVERGREEN TECHNOLOGIES: KEY EXECUTIVES
- TABLE 93. EVERGREEN TECHNOLOGIES: COMPANY SNAPSHOT
- TABLE 94. EVERGREEN TECHNOLOGIES: PRODUCT SEGMENTS
- TABLE 95. EVERGREEN TECHNOLOGIES: PRODUCT PORTFOLIO
- TABLE 96. CREATIVE OZ-AIR (I) PVT LTD: KEY EXECUTIVES
- TABLE 97. CREATIVE OZ-AIR (I) PVT LTD: COMPANY SNAPSHOT
- TABLE 98. CREATIVE OZ-AIR (I) PVT LTD: PRODUCT SEGMENTS
- TABLE 99. CREATIVE OZ-AIR (I) PVT LTD: PRODUCT PORTFOLIO
- TABLE 100. ACCUTEK PACKAGING EQUIPMENT COMPANIES, INC.: KEY EXECUTIVES
- TABLE 101. ACCUTEK PACKAGING EQUIPMENT COMPANIES, INC.: COMPANY SNAPSHOT
- TABLE 102. ACCUTEK PACKAGING EQUIPMENT COMPANIES, INC.: PRODUCT SEGMENTS
- TABLE 103. ACCUTEK PACKAGING EQUIPMENT COMPANIES, INC.: PRODUCT PORTFOLIO
- TABLE 104. TETRA LAVAL S.A.: KEY EXECUTIVES
- TABLE 105. TETRA LAVAL S.A.: COMPANY SNAPSHOT
- TABLE 106. TETRA LAVAL S.A.: PRODUCT SEGMENTS
- TABLE 107. TETRA LAVAL S.A.: PRODUCT PORTFOLIO
- TABLE 108. LENNTECH B.V.: KEY EXECUTIVES
- TABLE 109. LENNTECH B.V.: COMPANY SNAPSHOT
- TABLE 110. LENNTECH B.V.: PRODUCT SEGMENTS
- TABLE 111. LENNTECH B.V.: PRODUCT PORTFOLIO
- TABLE 112. DANAHER CORPORATION (PALL CORPORATION): KEY EXECUTIVES
- TABLE 113. DANAHER CORPORATION (PALL CORPORATION): COMPANY SNAPSHOT
- TABLE 114. DANAHER CORPORATION (PALL CORPORATION): PRODUCT SEGMENTS
- TABLE 115. DANAHER CORPORATION (PALL CORPORATION): PRODUCT PORTFOLIO
- TABLE 116. MARLO INCORPORATED: KEY EXECUTIVES
- TABLE 117. MARLO INCORPORATED: COMPANY SNAPSHOT
- TABLE 118. MARLO INCORPORATED: PRODUCT SEGMENTS
- TABLE 119. MARLO INCORPORATED: PRODUCT PORTFOLIO
LIST OF FIGURES
- FIGURE 01. BOTTLED WATER PROCESSING SYSTEM MARKET, 2022-2032
- FIGURE 02. SEGMENTATION OF BOTTLED WATER PROCESSING SYSTEM MARKET, 2022-2032
- FIGURE 03. BOTTLED WATER PROCESSING SYSTEM MARKET,2022-2032
- FIGURE 04. TOP INVESTMENT POCKETS IN BOTTLED WATER PROCESSING SYSTEM MARKET (2023-2032)
- FIGURE 05. LOW BARGAINING POWER OF SUPPLIERS
- FIGURE 06. LOW THREAT OF NEW ENTRANTS
- FIGURE 07. LOW THREAT OF SUBSTITUTES
- FIGURE 08. LOW INTENSITY OF RIVALRY
- FIGURE 09. LOW BARGAINING POWER OF BUYERS
- FIGURE 10. GLOBAL BOTTLED WATER PROCESSING SYSTEM MARKET:DRIVERS, RESTRAINTS AND OPPORTUNITIES
- FIGURE 11. BOTTLED WATER PROCESSING SYSTEM MARKET, BY CAPACITY, 2022(%)
- FIGURE 12. COMPARATIVE SHARE ANALYSIS OF BOTTLED WATER PROCESSING SYSTEM MARKET FOR LESS THAN 10,000 LITRES PER DAY, BY COUNTRY 2022 AND 2032(%)
- FIGURE 13. COMPARATIVE SHARE ANALYSIS OF BOTTLED WATER PROCESSING SYSTEM MARKET FOR 10,001 TO 30,000 LITRES PER DAY, BY COUNTRY 2022 AND 2032(%)
- FIGURE 14. COMPARATIVE SHARE ANALYSIS OF BOTTLED WATER PROCESSING SYSTEM MARKET FOR MORE THAN 30,000 LITRES PER DAY, BY COUNTRY 2022 AND 2032(%)
- FIGURE 15. BOTTLED WATER PROCESSING SYSTEM MARKET, BY TECHNOLOGY, 2022(%)
- FIGURE 16. COMPARATIVE SHARE ANALYSIS OF BOTTLED WATER PROCESSING SYSTEM MARKET FOR FILTRATION, BY COUNTRY 2022 AND 2032(%)
- FIGURE 17. COMPARATIVE SHARE ANALYSIS OF BOTTLED WATER PROCESSING SYSTEM MARKET FOR UV TREATMENT, BY COUNTRY 2022 AND 2032(%)
- FIGURE 18. COMPARATIVE SHARE ANALYSIS OF BOTTLED WATER PROCESSING SYSTEM MARKET FOR REVERSE OSMOSIS (RO), BY COUNTRY 2022 AND 2032(%)
- FIGURE 19. COMPARATIVE SHARE ANALYSIS OF BOTTLED WATER PROCESSING SYSTEM MARKET FOR PACKAGING, BY COUNTRY 2022 AND 2032(%)
- FIGURE 20. COMPARATIVE SHARE ANALYSIS OF BOTTLED WATER PROCESSING SYSTEM MARKET FOR OTHER, BY COUNTRY 2022 AND 2032(%)
- FIGURE 21. BOTTLED WATER PROCESSING SYSTEM MARKET, BY APPLICATION, 2022(%)
- FIGURE 22. COMPARATIVE SHARE ANALYSIS OF BOTTLED WATER PROCESSING SYSTEM MARKET FOR STILL WATER, BY COUNTRY 2022 AND 2032(%)
- FIGURE 23. COMPARATIVE SHARE ANALYSIS OF BOTTLED WATER PROCESSING SYSTEM MARKET FOR SPARKLING WATER, BY COUNTRY 2022 AND 2032(%)
- FIGURE 24. COMPARATIVE SHARE ANALYSIS OF BOTTLED WATER PROCESSING SYSTEM MARKET FOR OTHER, BY COUNTRY 2022 AND 2032(%)
- FIGURE 25. BOTTLED WATER PROCESSING SYSTEM MARKET BY REGION, 2022
- FIGURE 26. U.S. BOTTLED WATER PROCESSING SYSTEM MARKET, 2022-2032 ($MILLION)
- FIGURE 27. CANADA BOTTLED WATER PROCESSING SYSTEM MARKET, 2022-2032 ($MILLION)
- FIGURE 28. MEXICO BOTTLED WATER PROCESSING SYSTEM MARKET, 2022-2032 ($MILLION)
- FIGURE 29. GERMANY BOTTLED WATER PROCESSING SYSTEM MARKET, 2022-2032 ($MILLION)
- FIGURE 30. UK BOTTLED WATER PROCESSING SYSTEM MARKET, 2022-2032 ($MILLION)
- FIGURE 31. FRANCE BOTTLED WATER PROCESSING SYSTEM MARKET, 2022-2032 ($MILLION)
- FIGURE 32. ITALY BOTTLED WATER PROCESSING SYSTEM MARKET, 2022-2032 ($MILLION)
- FIGURE 33. REST OF EUROPE BOTTLED WATER PROCESSING SYSTEM MARKET, 2022-2032 ($MILLION)
- FIGURE 34. CHINA BOTTLED WATER PROCESSING SYSTEM MARKET, 2022-2032 ($MILLION)
- FIGURE 35. JAPAN BOTTLED WATER PROCESSING SYSTEM MARKET, 2022-2032 ($MILLION)
- FIGURE 36. INDIA BOTTLED WATER PROCESSING SYSTEM MARKET, 2022-2032 ($MILLION)
- FIGURE 37. SOUTH KOREA BOTTLED WATER PROCESSING SYSTEM MARKET, 2022-2032 ($MILLION)
- FIGURE 38. REST OF ASIA-PACIFIC BOTTLED WATER PROCESSING SYSTEM MARKET, 2022-2032 ($MILLION)
- FIGURE 39. LATIN AMERICA BOTTLED WATER PROCESSING SYSTEM MARKET, 2022-2032 ($MILLION)
- FIGURE 40. MIDDLE EAST BOTTLED WATER PROCESSING SYSTEM MARKET, 2022-2032 ($MILLION)
- FIGURE 41. AFRICA BOTTLED WATER PROCESSING SYSTEM MARKET, 2022-2032 ($MILLION)
- FIGURE 42. TOP WINNING STRATEGIES, BY YEAR
- FIGURE 43. TOP WINNING STRATEGIES, BY DEVELOPMENT
- FIGURE 44. TOP WINNING STRATEGIES, BY COMPANY
- FIGURE 45. PRODUCT MAPPING OF TOP 10 PLAYERS
- FIGURE 46. COMPETITIVE DASHBOARD
- FIGURE 47. COMPETITIVE HEATMAP: BOTTLED WATER PROCESSING SYSTEM MARKET
- FIGURE 48. TOP PLAYER POSITIONING, 2022
- FIGURE 49. MERCK KGAA: NET SALES, 2020-2022 ($MILLION)
- FIGURE 50. MERCK KGAA: RESEARCH & DEVELOPMENT EXPENDITURE, 2020-2022 ($MILLION)
- FIGURE 51. MERCK KGAA: REVENUE SHARE BY SEGMENT, 2022 (%)
- FIGURE 52. MERCK KGAA: REVENUE SHARE BY REGION, 2022 (%)
- FIGURE 53. TETRA LAVAL S.A.: NET SALES, 2020-2022 ($MILLION)
- FIGURE 54. TETRA LAVAL S.A.: REVENUE SHARE BY SEGMENT, 2022 (%)
- FIGURE 55. DANAHER CORPORATION (PALL CORPORATION): NET SALES, 2020-2022 ($MILLION)
- FIGURE 56. DANAHER CORPORATION (PALL CORPORATION): RESEARCH & DEVELOPMENT EXPENDITURE, 2020-2022 ($MILLION)
- FIGURE 57. DANAHER CORPORATION (PALL CORPORATION): REVENUE SHARE BY SEGMENT, 2022 (%)
- FIGURE 58. DANAHER CORPORATION (PALL CORPORATION): REVENUE SHARE BY REGION, 2022 (%)
 優質瓶裝水市場規模、佔有率和成長分析(按產品類型、包裝類型、分銷管道和地區)- 2025-2032 年行業預測
 優質瓶裝水市場機會、成長動力、產業趨勢分析及 2025 - 2034 年預測
 全球瓶裝水市場:預測(2025-2030)瓶裝飲用水市場規模、佔有率、成長分析、按產品、按分銷、按包裝、按地區 - 行業預測,2024-2031 年
 優質瓶裝水市場報告:2030 年趨勢、預測與競爭分析全球瓶裝水市場研究報告 - 2024 年至 2032 年產業分析、規模、佔有率、成長、趨勢與預測全球瓶裝水檢測設備市場
 全球瓶裝水市場規模、佔有率和趨勢分析報告 - 按瓶類型、分銷管道、規模、區域展望和預測,2024-2031全球礦泉水市場瓶裝水加工市場 - 按類型(純水、蘇打水、泉水、礦泉水)、按包裝(PET 瓶、玻璃瓶、金屬罐)、按技術(過濾、紫外線處理、逆滲透)和預測,2024 年至2032