


 |
市場調查報告書
商品編碼
1344307
奈米技術藥物傳輸市場:按配方、按應用:2023-2032 年全球機會分析與產業預測Nanotechnology Drug Delivery Market By Formulation, By Application : Global Opportunity Analysis and Industry Forecast, 2023-2032 |
||||||
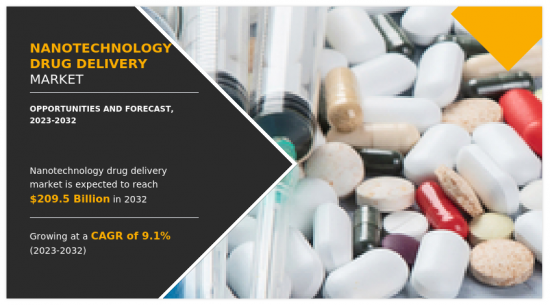
2022 年奈米技術藥物輸送市場估值為 875 億美元,預計 2023 年至 2032 年複合年增長率為 9.1%,到 2032 年達到 2095 億美元。
奈米技術透過提供創新解決方案來克服標靶治療、增強藥物療效和改善患者治療效果等挑戰,徹底改變了藥物傳輸領域。 奈米技術藥物傳輸市場正在經歷顯著成長,並為醫學的未來帶來巨大潛力。 奈米顆粒、奈米乳液和奈米載體是藥物傳輸系統中使用的奈米技術的一些主要成分。 這些奈米級結構具有獨特的物理化學特性,包括高表面積與體積比以及封裝治療劑並將其遞送至體內特定目標位點的能力。
奈米技術藥物傳輸市場是由慢性病盛行率上升和奈米技術進步所推動的。 慢性病的增加已成為奈米技術藥物傳輸市場的主要驅動因素。 癌症、糖尿病、心血管疾病和呼吸系統疾病等慢性疾病持續對全球健康構成重大挑戰。 根據國際糖尿病聯盟估計,2021年將有約5.37億人患有糖尿病。 此外,根據相同消息來源,預計到 2030 年,糖尿病患者總數將增加至 6.43 億,到 2045 年將增加至 7.83 億。 例如,莫納什大學、皇家墨爾本理工大學、墨爾本大學和貝克研究所的研究人員開發了對葡萄糖做出反應的系統,而目前的胰島素則不能。
臨床前研究設計了一種更好的人工胰臟系統,僅在身體真正需要時才釋放胰島素,以便更好地調節血糖水平。 這種創新的奈米碳水化合物平台可根據葡萄糖水平促進快速且一致的胰島素分泌,在持續時間和智慧方面超越其他系統。 奈米技術在提高藥物輸送精度、標靶性和個人化醫療方面具有獨特的能力,使其成為解決慢性病管理相關挑戰的有前景的解決方案。 因此,慢性病盛行率的增加是支持奈米技術藥物輸送市場成長的主要驅動力。
此外,奈米醫學的技術進步預計將在奈米技術藥物傳輸市場的成長中發揮重要作用。 由於傳統藥物遞送系統(DDS)的局限性,奈米載體的受歡迎程度顯著增加。 例如,亞利桑那州立大學的科學家創造了“摺紙奈米機器人”,之所以這樣稱呼是因為它們能夠轉變為不同的形狀。 它由一層塗有凝血□的合成 DNA 組成。 一旦注入血液中,奈米級 DNA 片就會發現腫瘤細胞,與其表面結合,引入凝血□,並有效地剝奪腫瘤細胞生存所需的血液供應。我就是。
這個微型機器人正在應對癌症治療的挑戰:消滅癌細胞,同時最大限度地減少對附近健康組織的損害。 然而,製造複雜性可能是市場成長的限制因素。 同時,鼓勵研究活動的財政支持等政府措施預計將成為奈米技術藥物輸送市場的成長機會。
目錄
第1章簡介
第 2 章執行摘要
第3章市場概述
- 市場定義和範圍
- 主要發現
- 影響因素
- 主要投資機會
- 波特五力分析
- 市場動態
- 促進因素
- 慢性疾病增加
- 奈米科技的進步
- 抑制因素
- 製造複雜性
- 機會
- 政府舉措
- 促進因素
- 新冠肺炎 (COVID-19) 市場影響分析
第 4 章奈米科技藥物傳輸市場:依配方
- 摘要
- 脂質奈米藥物
- 聚合物基奈米藥物
- 奈米晶體
- 其他
第5章奈米科技藥物傳輸市場:依應用
- 摘要
- 腫瘤學與血液學
- 傳染病
- 骨科
- 神經病學
- 泌尿科
- 免疫學
- 其他
第6章奈米科技藥物傳輸市場:依地區
- 摘要
- 北美
- 美國
- 加拿大
- 墨西哥
- 歐洲
- 德國
- 法國
- 英國
- 義大利
- 西班牙
- 歐洲其他地區
- 亞太地區
- 中國
- 日本
- 印度
- 澳大利亞
- 韓國
- 其他亞太地區
- 拉丁美洲/中東/非洲
- 巴西
- 沙烏地阿拉伯
- 南非
- 其他領域
第7章競爭態勢
- 簡介
- 關鍵成功策略
- 10家主要公司的產品圖譜
- 競爭對手儀表板
- 競爭熱圖
- 2022 年主要公司的定位
第8章公司簡介
- Abbvie Inc
- Pfizer Ltd
- AstraZeneca plc
- Johnson & Johnson
- Amgen Inc.
- Merck KGaA
- Nanobiotix SA
- Novartis AG
- Teva Pharmaceutical Industries Limited
- Bristol-Myers Squibb Company
According to a new report published by Allied Market Research, titled, "Nanotechnology Drug Delivery Market," The nanotechnology drug delivery market was valued at $87.5 billion in 2022, and is estimated to reach $209.5 billion by 2032, growing at a CAGR of 9.1% from 2023 to 2032. Nanotechnology has revolutionized the field of drug delivery by offering innovative solutions to overcome challenges in targeted therapy, enhanced drug efficacy, and improved patient outcomes. The nanotechnology-based drug delivery market has witnessed significant growth and holds immense potential for the future of medicine. Nanoparticles, nano emulsions, and nanocarriers are some of the key components of nanotechnology used in drug delivery systems. These nanoscale structures possess unique physicochemical properties, such as a high surface area-to-volume ratio and the ability to encapsulate and deliver therapeutic agents to specific target sites in the body.
The nanotechnology drug delivery market is driven by rise in prevalence of chronic diseases, and advancements in nanotechnology. The rise in prevalence of chronic diseases has emerged as a major driver for the nanotechnology drug delivery market. Chronic diseases, such as cancer, diabetes, cardiovascular diseases, and respiratory disorders, continue to pose significant health challenges globally. According to International Diabetes Federation, in 2021, it was estimated that approximately 537 million people were living with diabetes. Furthermore, according to the same source, the total number of people living with diabetes is projected to rise to 643 million by 2030 and 783 million by 2045. For instance, researchers from Monash University, RMIT University, The University of Melbourne and the Baker Institute developed a system that responds to glucose, which current insulin does not.
The preclinical study engineered a superior artificial pancreas system to release insulin only when it is genuinely required by the body, resulting in a more dependable regulation of blood glucose levels. This innovative nano sugar platform facilitated prompt and consistent insulin delivery that responded to glucose levels, surpassing other systems in terms of duration and intelligence. The unique capabilities of nanotechnology in enhancing drug delivery precision, targeting, and personalized medicine have positioned it as a promising solution to address the challenges associated with chronic disease management. Thus, the rise in prevalence of chronic diseases has become a key driving force behind the growth of the nanotechnology drug delivery market.
Furthermore, technological advancements in nanomedicines are expected to play a significant role in the growth of the nanotechnology drug delivery market. The limitations of traditional drug delivery systems (DDSs) have led to a significant rise in the popularity of nanocarriers. For instance, scientists at Arizona State University have created an "origami nanorobot" known as such due to its ability to transform into different forms. It comprises a flat synthetic DNA sheet coated with a blood-clotting enzyme. Once injected into the bloodstream, the nanoscale DNA sheet is designed to locate tumor cells, bind to their surface, and introduce the blood-clotting enzyme, effectively depriving the tumor cell of the necessary blood supply for its survival.
This tiny robot addresses a challenging aspect of cancer treatment, which involves eradicating cancer cells while minimizing damage to nearby healthy tissue. However, manufacturing complexities might act as a restraint for the growth of the market. On the other hand, government initiatives such as funding to encourage research activities are expected to serve as growth opportunity in the nanotechnology drug delivery market. The nanotechnology drug delivery market is segmented on the basis of formulation, application, and region. formulation, the market is categorized into lipid-based nanomedicine, polymer-based nanomedicine, nanocrystals, and others.
The others include inorganic nanoparticles, protein-based nanoparticles, and micelles. On the basis of application, the market is categorized into oncology & hematology, infectious diseases, orthopedics, neurology, urology, immunology, and others. The others include gastrointestinal, inflammatory, endocrine, integumentary ophthalmology, and cardiology.
On the basis of region, the market is analyzed across North America (the U.S., Canada, and Mexico), Europe (Germany, France, the UK, Italy, Spain, and Rest of Europe), Asia-Pacific (Japan, China, Australia, India, South Korea, and Rest of Asia-Pacific), and LAMEA (Brazil, South Africa, Saudi Arabia, and Rest of LAMEA). The key players that operate in the global nanotechnology drug delivery market are AbbVie Inc, Pfizer Inc., AstraZeneca plc, Johnson & Johnson, Amgen Inc, Merck KGaA, Nanobiotix SA, Novartis AG, Bristol-Myers Squibb Company, and Teva Pharmaceutical Industries Limited.
Key Benefits For Stakeholders
- This report provides a quantitative analysis of the market segments, current trends, estimations, and dynamics of the nanotechnology drug delivery market analysis from 2022 to 2032 to identify the prevailing nanotechnology drug delivery market opportunities.
- The market research is offered along with information related to key drivers, restraints, and opportunities.
- Porter's five forces analysis highlights the potency of buyers and suppliers to enable stakeholders make profit-oriented business decisions and strengthen their supplier-buyer network.
- In-depth analysis of the nanotechnology drug delivery market segmentation assists to determine the prevailing market opportunities.
- Major countries in each region are mapped according to their revenue contribution to the global market.
- Market player positioning facilitates benchmarking and provides a clear understanding of the present position of the market players.
- The report includes the analysis of the regional as well as global nanotechnology drug delivery market trends, key players, market segments, application areas, and market growth strategies.
Key Market Segments
By Formulation
- Lipid-based nanomedicine
- Polymer-based nanomedicine
- Nanocrystals
- Others
By Application
- Oncology and Hematology
- Infectious diseases
- Orthopedics
- Neurology
- Urology
- Immunology
- Others
By Region
- North America
- U.S.
- Canada
- Mexico
- Europe
- Germany
- France
- UK
- Italy
- Spain
- Rest of Europe
- Asia-Pacific
- China
- Japan
- India
- Australia
- South Korea
- Rest of Asia-Pacific
- LAMEA
- Brazil
- Saudi Arabia
- South Africa
- Rest of LAMEA
Key Market Players:
- Abbvie Inc
- Amgen Inc.
- AstraZeneca plc
- Bristol-Myers Squibb Company
- Johnson & Johnson
- Merck KGaA
- Nanobiotix SA
- Novartis AG
- Pfizer Ltd
- Teva Pharmaceutical Industries Limited
TABLE OF CONTENTS
CHAPTER 1: INTRODUCTION
- 1.1. Report description
- 1.2. Key market segments
- 1.3. Key benefits to the stakeholders
- 1.4. Research Methodology
- 1.4.1. Primary research
- 1.4.2. Secondary research
- 1.4.3. Analyst tools and models
CHAPTER 2: EXECUTIVE SUMMARY
- 2.1. CXO Perspective
CHAPTER 3: MARKET OVERVIEW
- 3.1. Market definition and scope
- 3.2. Key findings
- 3.2.1. Top impacting factors
- 3.2.2. Top investment pockets
- 3.3. Porter's five forces analysis
- 3.3.1. Low bargaining power of suppliers
- 3.3.2. Low threat of new entrants
- 3.3.3. Low threat of substitutes
- 3.3.4. Low intensity of rivalry
- 3.3.5. Low bargaining power of buyers
- 3.4. Market dynamics
- 3.4.1. Drivers
- 3.4.1.1. Rise in prevalence of chronic diseases.
- 3.4.1.2. Advancement in nanotechnology
- 3.4.1. Drivers
- 3.4.2. Restraints
- 3.4.2.1. Manufacturing Complexities
- 3.4.3. Opportunities
- 3.4.3.1. Government initiatives
- 3.5. COVID-19 Impact Analysis on the market
CHAPTER 4: NANOTECHNOLOGY DRUG DELIVERY MARKET, BY FORMULATION
- 4.1. Overview
- 4.1.1. Market size and forecast
- 4.2. Lipid-based nanomedicine
- 4.2.1. Key market trends, growth factors and opportunities
- 4.2.2. Market size and forecast, by region
- 4.2.3. Market share analysis by country
- 4.3. Polymer-based nanomedicine
- 4.3.1. Key market trends, growth factors and opportunities
- 4.3.2. Market size and forecast, by region
- 4.3.3. Market share analysis by country
- 4.4. Nanocrystals
- 4.4.1. Key market trends, growth factors and opportunities
- 4.4.2. Market size and forecast, by region
- 4.4.3. Market share analysis by country
- 4.5. Others
- 4.5.1. Key market trends, growth factors and opportunities
- 4.5.2. Market size and forecast, by region
- 4.5.3. Market share analysis by country
CHAPTER 5: NANOTECHNOLOGY DRUG DELIVERY MARKET, BY APPLICATION
- 5.1. Overview
- 5.1.1. Market size and forecast
- 5.2. Oncology and Hematology
- 5.2.1. Key market trends, growth factors and opportunities
- 5.2.2. Market size and forecast, by region
- 5.2.3. Market share analysis by country
- 5.3. Infectious diseases
- 5.3.1. Key market trends, growth factors and opportunities
- 5.3.2. Market size and forecast, by region
- 5.3.3. Market share analysis by country
- 5.4. Orthopedics
- 5.4.1. Key market trends, growth factors and opportunities
- 5.4.2. Market size and forecast, by region
- 5.4.3. Market share analysis by country
- 5.5. Neurology
- 5.5.1. Key market trends, growth factors and opportunities
- 5.5.2. Market size and forecast, by region
- 5.5.3. Market share analysis by country
- 5.6. Urology
- 5.6.1. Key market trends, growth factors and opportunities
- 5.6.2. Market size and forecast, by region
- 5.6.3. Market share analysis by country
- 5.7. Immunology
- 5.7.1. Key market trends, growth factors and opportunities
- 5.7.2. Market size and forecast, by region
- 5.7.3. Market share analysis by country
- 5.8. Others
- 5.8.1. Key market trends, growth factors and opportunities
- 5.8.2. Market size and forecast, by region
- 5.8.3. Market share analysis by country
CHAPTER 6: NANOTECHNOLOGY DRUG DELIVERY MARKET, BY REGION
- 6.1. Overview
- 6.1.1. Market size and forecast By Region
- 6.2. North America
- 6.2.1. Key trends and opportunities
- 6.2.2. Market size and forecast, by Formulation
- 6.2.3. Market size and forecast, by Application
- 6.2.4. Market size and forecast, by country
- 6.2.4.1. U.S.
- 6.2.4.1.1. Key market trends, growth factors and opportunities
- 6.2.4.1.2. Market size and forecast, by Formulation
- 6.2.4.1.3. Market size and forecast, by Application
- 6.2.4.2. Canada
- 6.2.4.2.1. Key market trends, growth factors and opportunities
- 6.2.4.2.2. Market size and forecast, by Formulation
- 6.2.4.2.3. Market size and forecast, by Application
- 6.2.4.3. Mexico
- 6.2.4.3.1. Key market trends, growth factors and opportunities
- 6.2.4.3.2. Market size and forecast, by Formulation
- 6.2.4.3.3. Market size and forecast, by Application
- 6.3. Europe
- 6.3.1. Key trends and opportunities
- 6.3.2. Market size and forecast, by Formulation
- 6.3.3. Market size and forecast, by Application
- 6.3.4. Market size and forecast, by country
- 6.3.4.1. Germany
- 6.3.4.1.1. Key market trends, growth factors and opportunities
- 6.3.4.1.2. Market size and forecast, by Formulation
- 6.3.4.1.3. Market size and forecast, by Application
- 6.3.4.2. France
- 6.3.4.2.1. Key market trends, growth factors and opportunities
- 6.3.4.2.2. Market size and forecast, by Formulation
- 6.3.4.2.3. Market size and forecast, by Application
- 6.3.4.3. UK
- 6.3.4.3.1. Key market trends, growth factors and opportunities
- 6.3.4.3.2. Market size and forecast, by Formulation
- 6.3.4.3.3. Market size and forecast, by Application
- 6.3.4.4. Italy
- 6.3.4.4.1. Key market trends, growth factors and opportunities
- 6.3.4.4.2. Market size and forecast, by Formulation
- 6.3.4.4.3. Market size and forecast, by Application
- 6.3.4.5. Spain
- 6.3.4.5.1. Key market trends, growth factors and opportunities
- 6.3.4.5.2. Market size and forecast, by Formulation
- 6.3.4.5.3. Market size and forecast, by Application
- 6.3.4.6. Rest of Europe
- 6.3.4.6.1. Key market trends, growth factors and opportunities
- 6.3.4.6.2. Market size and forecast, by Formulation
- 6.3.4.6.3. Market size and forecast, by Application
- 6.4. Asia-Pacific
- 6.4.1. Key trends and opportunities
- 6.4.2. Market size and forecast, by Formulation
- 6.4.3. Market size and forecast, by Application
- 6.4.4. Market size and forecast, by country
- 6.4.4.1. China
- 6.4.4.1.1. Key market trends, growth factors and opportunities
- 6.4.4.1.2. Market size and forecast, by Formulation
- 6.4.4.1.3. Market size and forecast, by Application
- 6.4.4.2. Japan
- 6.4.4.2.1. Key market trends, growth factors and opportunities
- 6.4.4.2.2. Market size and forecast, by Formulation
- 6.4.4.2.3. Market size and forecast, by Application
- 6.4.4.3. India
- 6.4.4.3.1. Key market trends, growth factors and opportunities
- 6.4.4.3.2. Market size and forecast, by Formulation
- 6.4.4.3.3. Market size and forecast, by Application
- 6.4.4.4. Australia
- 6.4.4.4.1. Key market trends, growth factors and opportunities
- 6.4.4.4.2. Market size and forecast, by Formulation
- 6.4.4.4.3. Market size and forecast, by Application
- 6.4.4.5. South Korea
- 6.4.4.5.1. Key market trends, growth factors and opportunities
- 6.4.4.5.2. Market size and forecast, by Formulation
- 6.4.4.5.3. Market size and forecast, by Application
- 6.4.4.6. Rest of Asia-Pacific
- 6.4.4.6.1. Key market trends, growth factors and opportunities
- 6.4.4.6.2. Market size and forecast, by Formulation
- 6.4.4.6.3. Market size and forecast, by Application
- 6.5. LAMEA
- 6.5.1. Key trends and opportunities
- 6.5.2. Market size and forecast, by Formulation
- 6.5.3. Market size and forecast, by Application
- 6.5.4. Market size and forecast, by country
- 6.5.4.1. Brazil
- 6.5.4.1.1. Key market trends, growth factors and opportunities
- 6.5.4.1.2. Market size and forecast, by Formulation
- 6.5.4.1.3. Market size and forecast, by Application
- 6.5.4.2. Saudi Arabia
- 6.5.4.2.1. Key market trends, growth factors and opportunities
- 6.5.4.2.2. Market size and forecast, by Formulation
- 6.5.4.2.3. Market size and forecast, by Application
- 6.5.4.3. South Africa
- 6.5.4.3.1. Key market trends, growth factors and opportunities
- 6.5.4.3.2. Market size and forecast, by Formulation
- 6.5.4.3.3. Market size and forecast, by Application
- 6.5.4.4. Rest of LAMEA
- 6.5.4.4.1. Key market trends, growth factors and opportunities
- 6.5.4.4.2. Market size and forecast, by Formulation
- 6.5.4.4.3. Market size and forecast, by Application
CHAPTER 7: COMPETITIVE LANDSCAPE
- 7.1. Introduction
- 7.2. Top winning strategies
- 7.3. Product Mapping of Top 10 Player
- 7.4. Competitive Dashboard
- 7.5. Competitive Heatmap
- 7.6. Top player positioning, 2022
CHAPTER 8: COMPANY PROFILES
- 8.1. Abbvie Inc
- 8.1.1. Company overview
- 8.1.2. Key Executives
- 8.1.3. Company snapshot
- 8.1.4. Operating business segments
- 8.1.5. Product portfolio
- 8.1.6. Business performance
- 8.2. Pfizer Ltd
- 8.2.1. Company overview
- 8.2.2. Key Executives
- 8.2.3. Company snapshot
- 8.2.4. Operating business segments
- 8.2.5. Product portfolio
- 8.2.6. Business performance
- 8.2.7. Key strategic moves and developments
- 8.3. AstraZeneca plc
- 8.3.1. Company overview
- 8.3.2. Key Executives
- 8.3.3. Company snapshot
- 8.3.4. Operating business segments
- 8.3.5. Product portfolio
- 8.3.6. Business performance
- 8.4. Johnson & Johnson
- 8.4.1. Company overview
- 8.4.2. Key Executives
- 8.4.3. Company snapshot
- 8.4.4. Operating business segments
- 8.4.5. Product portfolio
- 8.4.6. Business performance
- 8.5. Amgen Inc.
- 8.5.1. Company overview
- 8.5.2. Key Executives
- 8.5.3. Company snapshot
- 8.5.4. Operating business segments
- 8.5.5. Product portfolio
- 8.5.6. Business performance
- 8.6. Merck KGaA
- 8.6.1. Company overview
- 8.6.2. Key Executives
- 8.6.3. Company snapshot
- 8.6.4. Operating business segments
- 8.6.5. Product portfolio
- 8.6.6. Business performance
- 8.7. Nanobiotix SA
- 8.7.1. Company overview
- 8.7.2. Key Executives
- 8.7.3. Company snapshot
- 8.7.4. Operating business segments
- 8.7.5. Product portfolio
- 8.7.6. Business performance
- 8.7.7. Key strategic moves and developments
- 8.8. Novartis AG
- 8.8.1. Company overview
- 8.8.2. Key Executives
- 8.8.3. Company snapshot
- 8.8.4. Operating business segments
- 8.8.5. Product portfolio
- 8.8.6. Business performance
- 8.9. Teva Pharmaceutical Industries Limited
- 8.9.1. Company overview
- 8.9.2. Key Executives
- 8.9.3. Company snapshot
- 8.9.4. Operating business segments
- 8.9.5. Product portfolio
- 8.9.6. Business performance
- 8.10. Bristol-Myers Squibb Company
- 8.10.1. Company overview
- 8.10.2. Key Executives
- 8.10.3. Company snapshot
- 8.10.4. Operating business segments
- 8.10.5. Product portfolio
- 8.10.6. Business performance
LIST OF TABLES
- TABLE 01. GLOBAL NANOTECHNOLOGY DRUG DELIVERY MARKET, BY FORMULATION, 2022-2032 ($MILLION)
- TABLE 02. NANOTECHNOLOGY DRUG DELIVERY MARKET FOR LIPID-BASED NANOMEDICINE, BY REGION, 2022-2032 ($MILLION)
- TABLE 03. NANOTECHNOLOGY DRUG DELIVERY MARKET FOR POLYMER-BASED NANOMEDICINE, BY REGION, 2022-2032 ($MILLION)
- TABLE 04. NANOTECHNOLOGY DRUG DELIVERY MARKET FOR NANOCRYSTALS, BY REGION, 2022-2032 ($MILLION)
- TABLE 05. NANOTECHNOLOGY DRUG DELIVERY MARKET FOR OTHERS, BY REGION, 2022-2032 ($MILLION)
- TABLE 06. GLOBAL NANOTECHNOLOGY DRUG DELIVERY MARKET, BY APPLICATION, 2022-2032 ($MILLION)
- TABLE 07. NANOTECHNOLOGY DRUG DELIVERY MARKET FOR ONCOLOGY AND HEMATOLOGY, BY REGION, 2022-2032 ($MILLION)
- TABLE 08. NANOTECHNOLOGY DRUG DELIVERY MARKET FOR INFECTIOUS DISEASES, BY REGION, 2022-2032 ($MILLION)
- TABLE 09. NANOTECHNOLOGY DRUG DELIVERY MARKET FOR ORTHOPEDICS, BY REGION, 2022-2032 ($MILLION)
- TABLE 10. NANOTECHNOLOGY DRUG DELIVERY MARKET FOR NEUROLOGY, BY REGION, 2022-2032 ($MILLION)
- TABLE 11. NANOTECHNOLOGY DRUG DELIVERY MARKET FOR UROLOGY, BY REGION, 2022-2032 ($MILLION)
- TABLE 12. NANOTECHNOLOGY DRUG DELIVERY MARKET FOR IMMUNOLOGY, BY REGION, 2022-2032 ($MILLION)
- TABLE 13. NANOTECHNOLOGY DRUG DELIVERY MARKET FOR OTHERS, BY REGION, 2022-2032 ($MILLION)
- TABLE 14. NANOTECHNOLOGY DRUG DELIVERY MARKET, BY REGION, 2022-2032 ($MILLION)
- TABLE 15. NORTH AMERICA NANOTECHNOLOGY DRUG DELIVERY MARKET, BY FORMULATION, 2022-2032 ($MILLION)
- TABLE 16. NORTH AMERICA NANOTECHNOLOGY DRUG DELIVERY MARKET, BY APPLICATION, 2022-2032 ($MILLION)
- TABLE 17. NORTH AMERICA NANOTECHNOLOGY DRUG DELIVERY MARKET, BY COUNTRY, 2022-2032 ($MILLION)
- TABLE 18. U.S. NANOTECHNOLOGY DRUG DELIVERY MARKET, BY FORMULATION, 2022-2032 ($MILLION)
- TABLE 19. U.S. NANOTECHNOLOGY DRUG DELIVERY MARKET, BY APPLICATION, 2022-2032 ($MILLION)
- TABLE 20. CANADA NANOTECHNOLOGY DRUG DELIVERY MARKET, BY FORMULATION, 2022-2032 ($MILLION)
- TABLE 21. CANADA NANOTECHNOLOGY DRUG DELIVERY MARKET, BY APPLICATION, 2022-2032 ($MILLION)
- TABLE 22. MEXICO NANOTECHNOLOGY DRUG DELIVERY MARKET, BY FORMULATION, 2022-2032 ($MILLION)
- TABLE 23. MEXICO NANOTECHNOLOGY DRUG DELIVERY MARKET, BY APPLICATION, 2022-2032 ($MILLION)
- TABLE 24. EUROPE NANOTECHNOLOGY DRUG DELIVERY MARKET, BY FORMULATION, 2022-2032 ($MILLION)
- TABLE 25. EUROPE NANOTECHNOLOGY DRUG DELIVERY MARKET, BY APPLICATION, 2022-2032 ($MILLION)
- TABLE 26. EUROPE NANOTECHNOLOGY DRUG DELIVERY MARKET, BY COUNTRY, 2022-2032 ($MILLION)
- TABLE 27. GERMANY NANOTECHNOLOGY DRUG DELIVERY MARKET, BY FORMULATION, 2022-2032 ($MILLION)
- TABLE 28. GERMANY NANOTECHNOLOGY DRUG DELIVERY MARKET, BY APPLICATION, 2022-2032 ($MILLION)
- TABLE 29. FRANCE NANOTECHNOLOGY DRUG DELIVERY MARKET, BY FORMULATION, 2022-2032 ($MILLION)
- TABLE 30. FRANCE NANOTECHNOLOGY DRUG DELIVERY MARKET, BY APPLICATION, 2022-2032 ($MILLION)
- TABLE 31. UK NANOTECHNOLOGY DRUG DELIVERY MARKET, BY FORMULATION, 2022-2032 ($MILLION)
- TABLE 32. UK NANOTECHNOLOGY DRUG DELIVERY MARKET, BY APPLICATION, 2022-2032 ($MILLION)
- TABLE 33. ITALY NANOTECHNOLOGY DRUG DELIVERY MARKET, BY FORMULATION, 2022-2032 ($MILLION)
- TABLE 34. ITALY NANOTECHNOLOGY DRUG DELIVERY MARKET, BY APPLICATION, 2022-2032 ($MILLION)
- TABLE 35. SPAIN NANOTECHNOLOGY DRUG DELIVERY MARKET, BY FORMULATION, 2022-2032 ($MILLION)
- TABLE 36. SPAIN NANOTECHNOLOGY DRUG DELIVERY MARKET, BY APPLICATION, 2022-2032 ($MILLION)
- TABLE 37. REST OF EUROPE NANOTECHNOLOGY DRUG DELIVERY MARKET, BY FORMULATION, 2022-2032 ($MILLION)
- TABLE 38. REST OF EUROPE NANOTECHNOLOGY DRUG DELIVERY MARKET, BY APPLICATION, 2022-2032 ($MILLION)
- TABLE 39. ASIA-PACIFIC NANOTECHNOLOGY DRUG DELIVERY MARKET, BY FORMULATION, 2022-2032 ($MILLION)
- TABLE 40. ASIA-PACIFIC NANOTECHNOLOGY DRUG DELIVERY MARKET, BY APPLICATION, 2022-2032 ($MILLION)
- TABLE 41. ASIA-PACIFIC NANOTECHNOLOGY DRUG DELIVERY MARKET, BY COUNTRY, 2022-2032 ($MILLION)
- TABLE 42. CHINA NANOTECHNOLOGY DRUG DELIVERY MARKET, BY FORMULATION, 2022-2032 ($MILLION)
- TABLE 43. CHINA NANOTECHNOLOGY DRUG DELIVERY MARKET, BY APPLICATION, 2022-2032 ($MILLION)
- TABLE 44. JAPAN NANOTECHNOLOGY DRUG DELIVERY MARKET, BY FORMULATION, 2022-2032 ($MILLION)
- TABLE 45. JAPAN NANOTECHNOLOGY DRUG DELIVERY MARKET, BY APPLICATION, 2022-2032 ($MILLION)
- TABLE 46. INDIA NANOTECHNOLOGY DRUG DELIVERY MARKET, BY FORMULATION, 2022-2032 ($MILLION)
- TABLE 47. INDIA NANOTECHNOLOGY DRUG DELIVERY MARKET, BY APPLICATION, 2022-2032 ($MILLION)
- TABLE 48. AUSTRALIA NANOTECHNOLOGY DRUG DELIVERY MARKET, BY FORMULATION, 2022-2032 ($MILLION)
- TABLE 49. AUSTRALIA NANOTECHNOLOGY DRUG DELIVERY MARKET, BY APPLICATION, 2022-2032 ($MILLION)
- TABLE 50. SOUTH KOREA NANOTECHNOLOGY DRUG DELIVERY MARKET, BY FORMULATION, 2022-2032 ($MILLION)
- TABLE 51. SOUTH KOREA NANOTECHNOLOGY DRUG DELIVERY MARKET, BY APPLICATION, 2022-2032 ($MILLION)
- TABLE 52. REST OF ASIA-PACIFIC NANOTECHNOLOGY DRUG DELIVERY MARKET, BY FORMULATION, 2022-2032 ($MILLION)
- TABLE 53. REST OF ASIA-PACIFIC NANOTECHNOLOGY DRUG DELIVERY MARKET, BY APPLICATION, 2022-2032 ($MILLION)
- TABLE 54. LAMEA NANOTECHNOLOGY DRUG DELIVERY MARKET, BY FORMULATION, 2022-2032 ($MILLION)
- TABLE 55. LAMEA NANOTECHNOLOGY DRUG DELIVERY MARKET, BY APPLICATION, 2022-2032 ($MILLION)
- TABLE 56. LAMEA NANOTECHNOLOGY DRUG DELIVERY MARKET, BY COUNTRY, 2022-2032 ($MILLION)
- TABLE 57. BRAZIL NANOTECHNOLOGY DRUG DELIVERY MARKET, BY FORMULATION, 2022-2032 ($MILLION)
- TABLE 58. BRAZIL NANOTECHNOLOGY DRUG DELIVERY MARKET, BY APPLICATION, 2022-2032 ($MILLION)
- TABLE 59. SAUDI ARABIA NANOTECHNOLOGY DRUG DELIVERY MARKET, BY FORMULATION, 2022-2032 ($MILLION)
- TABLE 60. SAUDI ARABIA NANOTECHNOLOGY DRUG DELIVERY MARKET, BY APPLICATION, 2022-2032 ($MILLION)
- TABLE 61. SOUTH AFRICA NANOTECHNOLOGY DRUG DELIVERY MARKET, BY FORMULATION, 2022-2032 ($MILLION)
- TABLE 62. SOUTH AFRICA NANOTECHNOLOGY DRUG DELIVERY MARKET, BY APPLICATION, 2022-2032 ($MILLION)
- TABLE 63. REST OF LAMEA NANOTECHNOLOGY DRUG DELIVERY MARKET, BY FORMULATION, 2022-2032 ($MILLION)
- TABLE 64. REST OF LAMEA NANOTECHNOLOGY DRUG DELIVERY MARKET, BY APPLICATION, 2022-2032 ($MILLION)
- TABLE 65. ABBVIE INC: KEY EXECUTIVES
- TABLE 66. ABBVIE INC: COMPANY SNAPSHOT
- TABLE 67. ABBVIE INC: PRODUCT SEGMENTS
- TABLE 68. ABBVIE INC: PRODUCT PORTFOLIO
- TABLE 69. PFIZER LTD: KEY EXECUTIVES
- TABLE 70. PFIZER LTD: COMPANY SNAPSHOT
- TABLE 71. PFIZER LTD: PRODUCT SEGMENTS
- TABLE 72. PFIZER LTD: PRODUCT PORTFOLIO
- TABLE 73. PFIZER LTD: KEY STRATERGIES
- TABLE 74. ASTRAZENECA PLC: KEY EXECUTIVES
- TABLE 75. ASTRAZENECA PLC: COMPANY SNAPSHOT
- TABLE 76. ASTRAZENECA PLC: PRODUCT SEGMENTS
- TABLE 77. ASTRAZENECA PLC: PRODUCT PORTFOLIO
- TABLE 78. JOHNSON & JOHNSON: KEY EXECUTIVES
- TABLE 79. JOHNSON & JOHNSON: COMPANY SNAPSHOT
- TABLE 80. JOHNSON & JOHNSON: PRODUCT SEGMENTS
- TABLE 81. JOHNSON & JOHNSON: PRODUCT PORTFOLIO
- TABLE 82. AMGEN INC.: KEY EXECUTIVES
- TABLE 83. AMGEN INC.: COMPANY SNAPSHOT
- TABLE 84. AMGEN INC.: PRODUCT SEGMENTS
- TABLE 85. AMGEN INC.: PRODUCT PORTFOLIO
- TABLE 86. MERCK KGAA: KEY EXECUTIVES
- TABLE 87. MERCK KGAA: COMPANY SNAPSHOT
- TABLE 88. MERCK KGAA: PRODUCT SEGMENTS
- TABLE 89. MERCK KGAA: PRODUCT PORTFOLIO
- TABLE 90. NANOBIOTIX SA: KEY EXECUTIVES
- TABLE 91. NANOBIOTIX SA: COMPANY SNAPSHOT
- TABLE 92. NANOBIOTIX SA: PRODUCT SEGMENTS
- TABLE 93. NANOBIOTIX SA: PRODUCT PORTFOLIO
- TABLE 94. NANOBIOTIX SA: KEY STRATERGIES
- TABLE 95. NOVARTIS AG: KEY EXECUTIVES
- TABLE 96. NOVARTIS AG: COMPANY SNAPSHOT
- TABLE 97. NOVARTIS AG: PRODUCT SEGMENTS
- TABLE 98. NOVARTIS AG: PRODUCT PORTFOLIO
- TABLE 99. TEVA PHARMACEUTICAL INDUSTRIES LIMITED: KEY EXECUTIVES
- TABLE 100. TEVA PHARMACEUTICAL INDUSTRIES LIMITED: COMPANY SNAPSHOT
- TABLE 101. TEVA PHARMACEUTICAL INDUSTRIES LIMITED: PRODUCT SEGMENTS
- TABLE 102. TEVA PHARMACEUTICAL INDUSTRIES LIMITED: PRODUCT PORTFOLIO
- TABLE 103. BRISTOL-MYERS SQUIBB COMPANY: KEY EXECUTIVES
- TABLE 104. BRISTOL-MYERS SQUIBB COMPANY: COMPANY SNAPSHOT
- TABLE 105. BRISTOL-MYERS SQUIBB COMPANY: PRODUCT SEGMENTS
- TABLE 106. BRISTOL-MYERS SQUIBB COMPANY: PRODUCT PORTFOLIO
LIST OF FIGURES
- FIGURE 01. NANOTECHNOLOGY DRUG DELIVERY MARKET, 2022-2032
- FIGURE 02. SEGMENTATION OF NANOTECHNOLOGY DRUG DELIVERY MARKET, 2022-2032
- FIGURE 03. TOP INVESTMENT POCKETS IN NANOTECHNOLOGY DRUG DELIVERY MARKET (2023-2032)
- FIGURE 04. LOW BARGAINING POWER OF SUPPLIERS
- FIGURE 05. LOW THREAT OF NEW ENTRANTS
- FIGURE 06. LOW THREAT OF SUBSTITUTES
- FIGURE 07. LOW INTENSITY OF RIVALRY
- FIGURE 08. LOW BARGAINING POWER OF BUYERS
- FIGURE 09. DRIVERS, RESTRAINTS AND OPPORTUNITIES: GLOBALNANOTECHNOLOGY DRUG DELIVERY MARKET
- FIGURE 09. NANOTECHNOLOGY DRUG DELIVERY MARKET, BY FORMULATION, 2022(%)
- FIGURE 10. COMPARATIVE SHARE ANALYSIS OF NANOTECHNOLOGY DRUG DELIVERY MARKET FOR LIPID-BASED NANOMEDICINE, BY COUNTRY 2022 AND 2032(%)
- FIGURE 11. COMPARATIVE SHARE ANALYSIS OF NANOTECHNOLOGY DRUG DELIVERY MARKET FOR POLYMER-BASED NANOMEDICINE, BY COUNTRY 2022 AND 2032(%)
- FIGURE 12. COMPARATIVE SHARE ANALYSIS OF NANOTECHNOLOGY DRUG DELIVERY MARKET FOR NANOCRYSTALS, BY COUNTRY 2022 AND 2032(%)
- FIGURE 13. COMPARATIVE SHARE ANALYSIS OF NANOTECHNOLOGY DRUG DELIVERY MARKET FOR OTHERS, BY COUNTRY 2022 AND 2032(%)
- FIGURE 14. NANOTECHNOLOGY DRUG DELIVERY MARKET, BY APPLICATION, 2022(%)
- FIGURE 15. COMPARATIVE SHARE ANALYSIS OF NANOTECHNOLOGY DRUG DELIVERY MARKET FOR ONCOLOGY AND HEMATOLOGY, BY COUNTRY 2022 AND 2032(%)
- FIGURE 16. COMPARATIVE SHARE ANALYSIS OF NANOTECHNOLOGY DRUG DELIVERY MARKET FOR INFECTIOUS DISEASES, BY COUNTRY 2022 AND 2032(%)
- FIGURE 17. COMPARATIVE SHARE ANALYSIS OF NANOTECHNOLOGY DRUG DELIVERY MARKET FOR ORTHOPEDICS, BY COUNTRY 2022 AND 2032(%)
- FIGURE 18. COMPARATIVE SHARE ANALYSIS OF NANOTECHNOLOGY DRUG DELIVERY MARKET FOR NEUROLOGY, BY COUNTRY 2022 AND 2032(%)
- FIGURE 19. COMPARATIVE SHARE ANALYSIS OF NANOTECHNOLOGY DRUG DELIVERY MARKET FOR UROLOGY, BY COUNTRY 2022 AND 2032(%)
- FIGURE 20. COMPARATIVE SHARE ANALYSIS OF NANOTECHNOLOGY DRUG DELIVERY MARKET FOR IMMUNOLOGY, BY COUNTRY 2022 AND 2032(%)
- FIGURE 21. COMPARATIVE SHARE ANALYSIS OF NANOTECHNOLOGY DRUG DELIVERY MARKET FOR OTHERS, BY COUNTRY 2022 AND 2032(%)
- FIGURE 22. NANOTECHNOLOGY DRUG DELIVERY MARKET BY REGION, 2022
- FIGURE 23. U.S. NANOTECHNOLOGY DRUG DELIVERY MARKET, 2022-2032 ($MILLION)
- FIGURE 24. CANADA NANOTECHNOLOGY DRUG DELIVERY MARKET, 2022-2032 ($MILLION)
- FIGURE 25. MEXICO NANOTECHNOLOGY DRUG DELIVERY MARKET, 2022-2032 ($MILLION)
- FIGURE 26. GERMANY NANOTECHNOLOGY DRUG DELIVERY MARKET, 2022-2032 ($MILLION)
- FIGURE 27. FRANCE NANOTECHNOLOGY DRUG DELIVERY MARKET, 2022-2032 ($MILLION)
- FIGURE 28. UK NANOTECHNOLOGY DRUG DELIVERY MARKET, 2022-2032 ($MILLION)
- FIGURE 29. ITALY NANOTECHNOLOGY DRUG DELIVERY MARKET, 2022-2032 ($MILLION)
- FIGURE 30. SPAIN NANOTECHNOLOGY DRUG DELIVERY MARKET, 2022-2032 ($MILLION)
- FIGURE 31. REST OF EUROPE NANOTECHNOLOGY DRUG DELIVERY MARKET, 2022-2032 ($MILLION)
- FIGURE 32. CHINA NANOTECHNOLOGY DRUG DELIVERY MARKET, 2022-2032 ($MILLION)
- FIGURE 33. JAPAN NANOTECHNOLOGY DRUG DELIVERY MARKET, 2022-2032 ($MILLION)
- FIGURE 34. INDIA NANOTECHNOLOGY DRUG DELIVERY MARKET, 2022-2032 ($MILLION)
- FIGURE 35. AUSTRALIA NANOTECHNOLOGY DRUG DELIVERY MARKET, 2022-2032 ($MILLION)
- FIGURE 36. SOUTH KOREA NANOTECHNOLOGY DRUG DELIVERY MARKET, 2022-2032 ($MILLION)
- FIGURE 37. REST OF ASIA-PACIFIC NANOTECHNOLOGY DRUG DELIVERY MARKET, 2022-2032 ($MILLION)
- FIGURE 38. BRAZIL NANOTECHNOLOGY DRUG DELIVERY MARKET, 2022-2032 ($MILLION)
- FIGURE 39. SAUDI ARABIA NANOTECHNOLOGY DRUG DELIVERY MARKET, 2022-2032 ($MILLION)
- FIGURE 40. SOUTH AFRICA NANOTECHNOLOGY DRUG DELIVERY MARKET, 2022-2032 ($MILLION)
- FIGURE 41. REST OF LAMEA NANOTECHNOLOGY DRUG DELIVERY MARKET, 2022-2032 ($MILLION)
- FIGURE 42. TOP WINNING STRATEGIES, BY YEAR
- FIGURE 43. TOP WINNING STRATEGIES, BY DEVELOPMENT
- FIGURE 44. TOP WINNING STRATEGIES, BY COMPANY
- FIGURE 45. PRODUCT MAPPING OF TOP 10 PLAYERS
- FIGURE 46. COMPETITIVE DASHBOARD
- FIGURE 47. COMPETITIVE HEATMAP: NANOTECHNOLOGY DRUG DELIVERY MARKET
- FIGURE 48. TOP PLAYER POSITIONING, 2022
- FIGURE 49. ABBVIE INC: NET REVENUE, 2020-2022 ($MILLION)
- FIGURE 50. ABBVIE INC: REVENUE SHARE BY SEGMENT, 2022 (%)
- FIGURE 51. ABBVIE INC: REVENUE SHARE BY REGION, 2022 (%)
- FIGURE 52. PFIZER LTD: SALES REVENUE, 2020-2022 ($MILLION)
- FIGURE 53. PFIZER LTD: REVENUE SHARE BY REGION, 2022 (%)
- FIGURE 54. PFIZER LTD: REVENUE SHARE BY REGION, 2022 (%)
- FIGURE 55. ASTRAZENECA PLC: NET REVENUE, 2020-2022 ($MILLION)
- FIGURE 56. JOHNSON & JOHNSON: NET SALES, 2020-2022 ($MILLION)
- FIGURE 57. JOHNSON & JOHNSON: REVENUE SHARE BY SEGMENT, 2022 (%)
- FIGURE 58. JOHNSON & JOHNSON: REVENUE SHARE BY REGION, 2022 (%)
- FIGURE 59. AMGEN INC.: NET REVENUE, 2020-2022 ($MILLION)
- FIGURE 60. AMGEN INC.: REVENUE SHARE BY REGION, 2022 (%)
- FIGURE 61. AMGEN INC.: REVENUE SHARE BY SEGMENT, 2022 (%)
- FIGURE 62. MERCK KGAA: NET SALES, 2020-2022 ($MILLION)
- FIGURE 63. MERCK KGAA: REVENUE SHARE BY SEGMENT, 2022 (%)
- FIGURE 64. MERCK KGAA: REVENUE SHARE BY REGION, 2022 (%)
- FIGURE 65. NANOBIOTIX SA: NET REVENUE, 2020-2022 ($MILLION)
- FIGURE 66. NOVARTIS AG: NET SALES, 2020-2022 ($MILLION)
- FIGURE 67. NOVARTIS AG: REVENUE SHARE BY SEGMENT, 2022 (%)
- FIGURE 68. NOVARTIS AG: REVENUE SHARE BY REGION, 2022 (%)
- FIGURE 69. TEVA PHARMACEUTICAL INDUSTRIES LIMITED: NET REVENUE, 2020-2022 ($MILLION)
- FIGURE 70. TEVA PHARMACEUTICAL INDUSTRIES LIMITED: REVENUE SHARE BY SEGMENT, 2022 (%)
- FIGURE 71. BRISTOL-MYERS SQUIBB COMPANY: NET SALES, 2020-2022 ($MILLION)
- FIGURE 72. BRISTOL-MYERS SQUIBB COMPANY: REVENUE SHARE BY REGION, 2022 (%)


