


 |
市場調查報告書
商品編碼
1298388
航空航天零部件製造市場(按產品類型(按最終用戶)):2021-2031 年全球機遇分析和行業預測Aerospace Parts Manufacturing Market By Product Type, By End User : Global Opportunity Analysis and Industry Forecast, 2021-2031 |
||||||
航空航天部件是用於設計、製造和維護在地球大氣層和外層空間運行的飛機、航天器和其他飛行器的零件、系統和材料。
航空航天部件包括發動機、機艙內飾、航空結構、設備、系統和支架、航空電子設備、絕緣部件以及航空航天器安全可靠運行所需的其他設備。
航空航天部件必須符合嚴格的質量和安全標準,以確保使用它們的飛機和航天器的可靠性和使用壽命。這些部件經過嚴格的測試、認證和檢查程序,以確保它們滿足監管要求和行業特定的性能標準。航空航天零部件製造行業是一個高度專業化和復雜的領域,需要高度的專業知識和精密製造能力。航空航天零部件製造商必須不斷投資研發,生產出滿足航空航天業不斷變化的需求的創新產品,例如減輕重量以提高燃油經濟性、提高安全性和性能。
隨著航空航天技術的不斷進步,對更先進、更精密零件的需求不斷增加。材料科學、電子和軟件系統的創新以及全球經濟(尤其是新興市場)的增長正在增加對航空旅行的需求,這反過來又推動了對航空航天零部件的需求。航空航天業受到嚴格監管,政府法規在確定航空航天部件必須滿足的安全、質量和性能標準方面發揮著重要作用。監管變化可能為航空航天零部件製造商帶來新的機遇和挑戰。此外,環境法規在航空航天業中變得越來越重要。人們對氣候變化和可持續發展的日益擔憂迫使製造商開發更環保的航空航天部件和系統。
自 COVID-19 以來,航空乘客數量在 2022 年已基本恢復。飛機訂單的增長速度驚人,供應商、運營商和原始設備製造商都感受到了交付壓力,導致產能和勞動力緊張。商業航空業目前面臨需求激增。根據國際航空運輸協會的數據,2021 年的旅行總量比 2019 年減少了 47%。2022年為83%,2023年為94%,2024年為103%,2025年為111%。隨著使用商用飛機的乘客數量預計將增加,航空航天零部件市場預計將增長。
儘管數以百萬計的乘客正在返回商業航空公司,並且包機費用因通貨膨脹而上漲,但與冠狀病毒大流行同時發生的私人飛機使用量的增加並沒有顯示出放緩的跡象。據航空數據公司WingX預測,與疫情前相比,2022年同比增長10%,2019年同比增長14%。WingX首席執行官Richard Kou聲稱,過去兩年對私人飛機的需求一直“創紀錄”。由於富有的個人和商務旅行者試圖避開人群和航空公司實施的新冠肺炎 (COVID-19) 限制,私人航班預訂量在 2020 年開始增加。儘管飛行員短缺,小型機場的航班也減少,但自由行旅客仍然蜂擁而至。公務機需求的增加預計將增加對備件和組件的需求。
當前的俄羅斯-烏克蘭戰爭正在推動軍用飛機市場。由於烏克蘭考慮購買數十架 F-16 戰鬥機,美國航空航天、武器和國防組織洛克希德·馬丁公司打算提高 F-16 戰鬥機的產量。澳大利亞、美國、阿根廷和埃及等國家對印度的光輝輕型戰鬥機(LCA)表現出了興趣。這些全球趨勢預計將產生對軍用飛機相關零部件的需求。
航空航天業不斷創新和開發節能發動機、複合材料和先進航空電子設備等尖端技術。這些進步提高了飛機的性能和安全性,吸引了更多客戶。北美各國政府為航空航天業提供了政策和資金支持。例如,當 2020 年冠狀病毒大流行實際上導致旅行停止時,美國政府批准了一項針對陷入困境的航空業的 250 億美元救助計劃。在北美,美國政府是航空航天業的最大客戶,其支出的很大一部分為航空航天公司開發和供應軍用飛機及相關技術創造了機會。美國政府提出了2022年軍事預算提案,其中包括70億美元用於飛機採購。
歐盟(EU)及其成員國增加了國防開支,為航空航天公司開發和供應軍用飛機以及各國根據需要購買新飛機創造了機會。歐洲環境法規一直是航空航天業創新的驅動力。2022年,德國宣布將用35架美製F-35取代其過時的龍捲風戰鬥機。這是自總理奧拉夫·肖爾茨承諾斥資 1080 億美元進行軍事升級以應對俄羅斯入侵烏克蘭以來的首次重大國防採購。隨著航空業努力開發更環保的技術,例如電動和混合動力飛機,以滿足排放和噪音法規,預計這些發展將創造對飛機新零部件的需求。
目錄
第 1 章 簡介
第二章執行摘要
第三章市場概況
- 市場定義和範圍
- 主要發現
- 影響因素
- 主要投資機會
- 波特五力分析
- 供應商的議價能力
- 買方議價能力
- 替代品的威脅
- 新進入者的威脅
- 競爭強度
- 市場動態
- 促進者
- 商用飛機的需求增加
- 複合材料零件的採用增加,促進銷售
- 由於軍用飛機需求增加和技術進步,航空航天零部件製造市場的銷售額增加
- 阻礙因素
- 監管基礎設施有限
- 航空航天零件的製造成本昂貴
- 製造航空航天零部件的熟練工人短缺
- 機會
- 飛機製造中越來越多地採用 3D 打印推動增長
- 對輕質、耐用航空航天部件的需求增加
- 促進者
- COVID-19 市場影響分析
4 航空航天零部件製造市場,按產品類型
- 概述
- 市場規模及預測
- 引擎
- 主要市場趨勢、增長動力和機遇
- 市場規模/預測:按地區
- 市場份額分析:按國家分類
- 房間內部
- 主要市場趨勢、增長動力和機遇
- 市場規模/預測:按地區
- 市場份額分析:按國家分類
- 航空結構
- 主要市場趨勢、增長動力和機遇
- 市場規模/預測:按地區
- 市場份額分析:按國家分類
- 設備、系統、支持
- 主要市場趨勢、增長動力和機遇
- 市場規模/預測:按地區
- 市場份額分析:按國家分類
- 航空電子設備
- 主要市場趨勢、增長動力和機遇
- 市場規模/預測:按地區
- 市場份額分析:按國家分類
- 絕緣件
- 主要市場趨勢、增長動力和機遇
- 市場規模/預測:按地區
- 市場份額分析:按國家分類
5 航空航天零部件製造市場(按最終用戶)
- 概述
- 市場規模及預測
- 商用飛機
- 主要市場趨勢、增長動力和機遇
- 市場規模/預測:按地區
- 市場份額分析:按國家分類
- 公務機
- 主要市場趨勢、增長動力和機遇
- 市場規模/預測:按地區
- 市場份額分析:按國家分類
- 軍用飛機
- 主要市場趨勢、增長動力和機遇
- 市場規模/預測:按地區
- 市場份額分析:按國家分類
- 其他
- 主要市場趨勢、增長動力和機遇
- 市場規模/預測:按地區
- 市場份額分析:按國家分類
6.按地區劃分的航空航天零部件製造市場
- 概述
- 市場規模/預測:按地區
- 北美
- 主要趨勢和機遇
- 市場規模/預測:按產品類型
- 市場規模/預測:按最終用戶分類
- 市場規模/預測:按國家
- 美國
- 主要市場趨勢、增長動力和機遇
- 市場規模/預測:按產品類型
- 市場規模/預測:按最終用戶分類
- 加拿大
- 主要市場趨勢、增長動力和機遇
- 市場規模/預測:按產品類型
- 市場規模/預測:按最終用戶分類
- 墨西哥
- 主要市場趨勢、增長動力和機遇
- 市場規模/預測:按產品類型
- 市場規模/預測:按最終用戶分類
- 歐洲
- 主要趨勢和機遇
- 市場規模/預測:按產品類型
- 市場規模/預測:按最終用戶分類
- 市場規模/預測:按國家
- 英國
- 主要市場趨勢、增長動力和機遇
- 市場規模/預測:按產品類型
- 市場規模/預測:按最終用戶分類
- 德國
- 主要市場趨勢、增長動力和機遇
- 市場規模/預測:按產品類型
- 市場規模/預測:按最終用戶分類
- 法國
- 主要市場趨勢、增長動力和機遇
- 市場規模/預測:按產品類型
- 市場規模/預測:按最終用戶分類
- 意大利
- 主要市場趨勢、增長動力和機遇
- 市場規模/預測:按產品類型
- 市場規模/預測:按最終用戶分類
- 俄羅斯
- 主要市場趨勢、增長動力和機遇
- 市場規模/預測:按產品類型
- 市場規模/預測:按最終用戶分類
- 歐洲其他地區
- 主要市場趨勢、增長動力和機遇
- 市場規模/預測:按產品類型
- 市場規模/預測:按最終用戶分類
- 亞太地區
- 主要趨勢和機遇
- 市場規模/預測:按產品類型
- 市場規模/預測:按最終用戶分類
- 市場規模/預測:按國家
- 中國
- 主要市場趨勢、增長動力和機遇
- 市場規模/預測:按產品類型
- 市場規模/預測:按最終用戶分類
- 日本
- 主要市場趨勢、增長動力和機遇
- 市場規模/預測:按產品類型
- 市場規模/預測:按最終用戶分類
- 印度
- 主要市場趨勢、增長動力和機遇
- 市場規模/預測:按產品類型
- 市場規模/預測:按最終用戶分類
- 澳大利亞
- 主要市場趨勢、增長動力和機遇
- 市場規模/預測:按產品類型
- 市場規模/預測:按最終用戶分類
- 韓國
- 主要市場趨勢、增長動力和機遇
- 市場規模/預測:按產品類型
- 市場規模/預測:按最終用戶分類
- 亞太其他地區
- 主要市場趨勢、增長動力和機遇
- 市場規模/預測:按產品類型
- 市場規模/預測:按最終用戶分類
- 拉丁美洲/中東/非洲
- 主要趨勢和機遇
- 市場規模/預測:按產品類型
- 市場規模/預測:按最終用戶分類
- 市場規模/預測:按國家
- 拉丁美洲
- 主要市場趨勢、增長動力和機遇
- 市場規模/預測:按產品類型
- 市場規模/預測:按最終用戶分類
- 中東
- 主要市場趨勢、增長動力和機遇
- 市場規模/預測:按產品類型
- 市場規模/預測:按最終用戶分類
- 非洲
- 主要市場趨勢、增長動力和機遇
- 市場規模/預測:按產品類型
- 市場規模/預測:按最終用戶分類
第7章 競爭格局
- 介紹
- 關鍵成功策略
- 10大公司產品圖
- 比賽儀表板
- 比賽熱圖
- 2021 年頂級公司定位
第八章公司簡介
- Boeing Company
- Dassault Aviation
- GENERAL ELECTRIC
- Honeywell International Inc.
- Lockheed Martin Corporation
- Lufthansa Technik
- PARKER HANNIFIN CORP
- Rolls-Royce plc
- Safran S.A.
- Thales Group
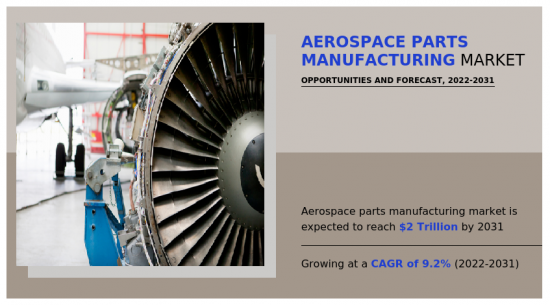
Aerospace parts are components, systems, and materials used in the design, manufacturing, and maintenance of aircraft, spacecraft, and other vehicles that operate in the atmosphere of the earth or in space. Aerospace parts may include engines, cabin interiors, aerostructure, equipment, system & support, avionics, insulation components, and other equipment necessary for the safe and reliable operation of aerospace vehicles.
Aerospace parts must meet stringent quality and safety standards to ensure the reliability and longevity of the aircraft or spacecraft in which they are used. These parts are subject to rigorous testing, certification, and inspection procedures to ensure they meet regulatory requirements and the specific performance standards of the industry. The aerospace parts manufacturing industry is a highly specialized and complex field that requires a high level of technical expertise and precision manufacturing capabilities. Aerospace parts manufacturers must continually invest in research and development to produce innovative products that meet the evolving needs of the aerospace industry, including reducing weight, which increases fuel efficiency, and improve safety and performance.
The demand for more advanced and sophisticated parts increases as aerospace technology continues to advance. Innovations in materials science, electronics, and software systems, and the growth of the global economy, especially in emerging markets, increase the demand for air travel, which in turn drives demand for aerospace parts. The aerospace industry is highly regulated, and government regulations play a significant role in determining the safety, quality, and performance standards that aerospace parts must meet. Changes in regulations may create new opportunities or challenges for aerospace parts manufacturers. Moreover, environmental regulations have become increasingly important in the aerospace industry. Manufacturers are under pressure to develop more eco-friendly aerospace components and systems as concerns over climate change and sustainability grow.
The passengers travelled through air travel has largely recovered in 2022 since COVID-19; aircraft orders are being placed at a remarkable rate, and suppliers, operators, and OEMs are feeling pressure to deliver at a level that is taxing production capacity and workforces. The commercial aviation industry currently faces a tidal wave of demand. According to the International Air Transport Association, the total number of travelers was 47% lower in 2021 than it was in 2019. In 2022, 83% is anticipated, followed by 94% in 2023, 103% in 2024, and 111% in 2025. The expected growth in passenger travel on commercial aircraft is anticipated to give rise to the growth of the aerospace parts and components market.
Millions of passengers return to commercial airlines, and while the cost of a charter flight rises due to inflation, the increase in private jet use that coincided with the coronavirus pandemic is not showing any signs of abating. According to aviation data company WingX, corporate aircraft flights increased globally by 10% from the previous year in 2022 and by 14% from before the epidemic in 2019. The chief executive of WingX, Richard Koe, claimed that the demand for private planes had been "record-breaking" for the previous two years. Private flight reservations started to increase in 2020 as wealthy and business travelers tried to avoid swarms of people and COVID-19 regulations in place at airlines. Private travelers have been attracted despite pilot shortages and service reductions at smaller airports. The rise in demand for business jets is anticipated to increase the demand for spare parts and components.
The present war between Russia and Ukraine drives the military aircraft market. Lockheed Martin, an American aerospace, arms, and defense organization, intends to ramp up F-16 Fighter Manufacturing as Ukraine looks to purchase dozens of jets. Countries such as Australia, the U.S., Argentina, and Egypt have shown interest in the Indian TEJAS light combat aircraft (LCA). These developments around the globe are expected to create demand for the parts and components related to military aircraft.
The aerospace industry continuously innovates and develops modern technologies, such as fuel-efficient engines, composite materials, and advanced avionics. These advancements improve the performance and safety of airplanes, which attracts more customers. The government in North America had provided policy and financial support to the aerospace industry. For instance, in 2020 the coronavirus pandemic virtually halts travel in 2020, the U.S. government approved a $25 billion bailout for the struggling airline sector. In North America, the U.S. government is the largest customer for the aerospace industry, with a significant portion of its spending has created opportunities for aerospace companies to develop and supply military aircraft and related technologies. In 2022, the U.S. government suggests a military budget package that includes $7 billion for purchasing planes.
The European Union and its members had increased their defense spending, creating opportunities for aerospace companies to develop and supply military aircraft and for countries to purchase new aircraft according to their needs. European environmental regulations have been a driver for innovation in the aerospace industry. In 2022, Germany announced that it would replace its outdated Tornado fighter jets with 35 US F-35s, marking the first significant defense purchase since Chancellor Olaf Scholz promised a $ 108 bn military upgrade in reaction to Russian invasion of Ukraine. The industry has been working to develop more environmentally friendly technologies, such as electric and hybrid aircraft, in response to regulations on emissions and noise, thus these developments are expected to create demand for new components and parts for the aircraft.
The aerospace parts manufacturing market is segmented on the basis of product type, end user, and region. On the basis of product type, it is divided into engines, cabin interiors, aerostructure, equipment, system & support, avionics, and insulation components. On the basis of end users, it is classified into commercial aircraft, business aircraft, military aircraft, and others. On the basis of region, the market is analyzed across North America, Europe, Asia-Pacific, and LAMEA.
Growth drivers, restraints, and opportunities are explained in the study to better understand the market dynamics. This study further highlights key areas of investment. In addition, it includes Porter's five forces analysis to understand the competitive scenario of the industry and the role of each stakeholder. The study features strategies adopted by key market players to maintain their foothold in the market.
Companies have adopted product development, partnership, and product launch as their key development strategies in the Aerospace parts manufacturing market. The key players operating in this market are Boeing Co, Dassault Aviation SA, GE Aviation, Honeywell International Inc., Lockheed Martin Corp, Lufthansa Technik AG, Parker Hannifin, Rolls-Royce plc, Safran S.A., and Thales Group.
Key Benefits For Stakeholders
- This report provides a quantitative analysis of the market segments, current trends, estimations, and dynamics of the aerospace parts manufacturing market analysis from 2021 to 2031 to identify the prevailing aerospace parts manufacturing market opportunities.
- The market research is offered along with information related to key drivers, restraints, and opportunities.
- Porter's five forces analysis highlights the potency of buyers and suppliers to enable stakeholders make profit-oriented business decisions and strengthen their supplier-buyer network.
- In-depth analysis of the aerospace parts manufacturing market segmentation assists to determine the prevailing market opportunities.
- Major countries in each region are mapped according to their revenue contribution to the global market.
- Market player positioning facilitates benchmarking and provides a clear understanding of the present position of the market players.
- The report includes the analysis of the regional as well as global aerospace parts manufacturing market trends, key players, market segments, application areas, and market growth strategies.
Key Market Segments
By Product Type
- Engines
- Cabin Interiors
- Aerostructure
- Equipment, System, and Support
- Avionics
- Insulation Components
By End User
- Commercial Aircraft
- Business Aircraft
- Military Aircraft
- Others
By Region
- North America
- U.S.
- Canada
- Mexico
- Europe
- UK
- Germany
- France
- Italy
- Russia
- Rest of Europe
- Asia-Pacific
- China
- Japan
- India
- Australia
- South Korea
- Rest of Asia-Pacific
- LAMEA
- Latin America
- Middle East
- Africa
Key Market Players:
- Boeing Company
- Dassault Aviation
- Honeywell International Inc.
- Lockheed Martin Corporation
- Safran S.A.
- Thales Group
- GENERAL ELECTRIC
- Lufthansa Technik
- PARKER HANNIFIN CORP
- Rolls-Royce plc
TABLE OF CONTENTS
CHAPTER 1: INTRODUCTION
- 1.1. Report description
- 1.2. Key market segments
- 1.3. Key benefits to the stakeholders
- 1.4. Research Methodology
- 1.4.1. Primary research
- 1.4.2. Secondary research
- 1.4.3. Analyst tools and models
CHAPTER 2: EXECUTIVE SUMMARY
- 2.1. CXO Perspective
CHAPTER 3: MARKET OVERVIEW
- 3.1. Market definition and scope
- 3.2. Key findings
- 3.2.1. Top impacting factors
- 3.2.2. Top investment pockets
- 3.3. Porter's five forces analysis
- 3.3.1. Bargaining power of suppliers
- 3.3.2. Bargaining power of buyers
- 3.3.3. Threat of substitutes
- 3.3.4. Threat of new entrants
- 3.3.5. Intensity of rivalry
- 3.4. Market dynamics
- 3.4.1. Drivers
- 3.4.1.1. Increasing demand for commercial aircraft
- 3.4.1.2. Rising adoption of composite components to boost the sales
- 3.4.1.3. Growing need for military aircraft and advancement in technologies to boost the sales for aerospace parts manufacturing market
- 3.4.1. Drivers
- 3.4.2. Restraints
- 3.4.2.1. Limited regulatory infrastructure
- 3.4.2.2. High cost in manufacturing aerospace parts
- 3.4.2.3. Lack of skilled person to manufacture aerospace parts
- 3.4.3. Opportunities
- 3.4.3.1. Increasing adoption of 3d printing in aircraft manufacturing to favor growth
- 3.4.3.2. Increase in demand for lightweight & durable aerospace components
- 3.5. COVID-19 Impact Analysis on the market
CHAPTER 4: AEROSPACE PARTS MANUFACTURING MARKET, BY PRODUCT TYPE
- 4.1. Overview
- 4.1.1. Market size and forecast
- 4.2. Engines
- 4.2.1. Key market trends, growth factors and opportunities
- 4.2.2. Market size and forecast, by region
- 4.2.3. Market share analysis by country
- 4.3. Cabin Interiors
- 4.3.1. Key market trends, growth factors and opportunities
- 4.3.2. Market size and forecast, by region
- 4.3.3. Market share analysis by country
- 4.4. Aerostructure
- 4.4.1. Key market trends, growth factors and opportunities
- 4.4.2. Market size and forecast, by region
- 4.4.3. Market share analysis by country
- 4.5. Equipment, System, and Support
- 4.5.1. Key market trends, growth factors and opportunities
- 4.5.2. Market size and forecast, by region
- 4.5.3. Market share analysis by country
- 4.6. Avionics
- 4.6.1. Key market trends, growth factors and opportunities
- 4.6.2. Market size and forecast, by region
- 4.6.3. Market share analysis by country
- 4.7. Insulation Components
- 4.7.1. Key market trends, growth factors and opportunities
- 4.7.2. Market size and forecast, by region
- 4.7.3. Market share analysis by country
CHAPTER 5: AEROSPACE PARTS MANUFACTURING MARKET, BY END USER
- 5.1. Overview
- 5.1.1. Market size and forecast
- 5.2. Commercial Aircraft
- 5.2.1. Key market trends, growth factors and opportunities
- 5.2.2. Market size and forecast, by region
- 5.2.3. Market share analysis by country
- 5.3. Business Aircraft
- 5.3.1. Key market trends, growth factors and opportunities
- 5.3.2. Market size and forecast, by region
- 5.3.3. Market share analysis by country
- 5.4. Military Aircraft
- 5.4.1. Key market trends, growth factors and opportunities
- 5.4.2. Market size and forecast, by region
- 5.4.3. Market share analysis by country
- 5.5. Others
- 5.5.1. Key market trends, growth factors and opportunities
- 5.5.2. Market size and forecast, by region
- 5.5.3. Market share analysis by country
CHAPTER 6: AEROSPACE PARTS MANUFACTURING MARKET, BY REGION
- 6.1. Overview
- 6.1.1. Market size and forecast By Region
- 6.2. North America
- 6.2.1. Key trends and opportunities
- 6.2.2. Market size and forecast, by Product Type
- 6.2.3. Market size and forecast, by End User
- 6.2.4. Market size and forecast, by country
- 6.2.4.1. U.S.
- 6.2.4.1.1. Key market trends, growth factors and opportunities
- 6.2.4.1.2. Market size and forecast, by Product Type
- 6.2.4.1.3. Market size and forecast, by End User
- 6.2.4.2. Canada
- 6.2.4.2.1. Key market trends, growth factors and opportunities
- 6.2.4.2.2. Market size and forecast, by Product Type
- 6.2.4.2.3. Market size and forecast, by End User
- 6.2.4.3. Mexico
- 6.2.4.3.1. Key market trends, growth factors and opportunities
- 6.2.4.3.2. Market size and forecast, by Product Type
- 6.2.4.3.3. Market size and forecast, by End User
- 6.3. Europe
- 6.3.1. Key trends and opportunities
- 6.3.2. Market size and forecast, by Product Type
- 6.3.3. Market size and forecast, by End User
- 6.3.4. Market size and forecast, by country
- 6.3.4.1. UK
- 6.3.4.1.1. Key market trends, growth factors and opportunities
- 6.3.4.1.2. Market size and forecast, by Product Type
- 6.3.4.1.3. Market size and forecast, by End User
- 6.3.4.2. Germany
- 6.3.4.2.1. Key market trends, growth factors and opportunities
- 6.3.4.2.2. Market size and forecast, by Product Type
- 6.3.4.2.3. Market size and forecast, by End User
- 6.3.4.3. France
- 6.3.4.3.1. Key market trends, growth factors and opportunities
- 6.3.4.3.2. Market size and forecast, by Product Type
- 6.3.4.3.3. Market size and forecast, by End User
- 6.3.4.4. Italy
- 6.3.4.4.1. Key market trends, growth factors and opportunities
- 6.3.4.4.2. Market size and forecast, by Product Type
- 6.3.4.4.3. Market size and forecast, by End User
- 6.3.4.5. Russia
- 6.3.4.5.1. Key market trends, growth factors and opportunities
- 6.3.4.5.2. Market size and forecast, by Product Type
- 6.3.4.5.3. Market size and forecast, by End User
- 6.3.4.6. Rest of Europe
- 6.3.4.6.1. Key market trends, growth factors and opportunities
- 6.3.4.6.2. Market size and forecast, by Product Type
- 6.3.4.6.3. Market size and forecast, by End User
- 6.4. Asia-Pacific
- 6.4.1. Key trends and opportunities
- 6.4.2. Market size and forecast, by Product Type
- 6.4.3. Market size and forecast, by End User
- 6.4.4. Market size and forecast, by country
- 6.4.4.1. China
- 6.4.4.1.1. Key market trends, growth factors and opportunities
- 6.4.4.1.2. Market size and forecast, by Product Type
- 6.4.4.1.3. Market size and forecast, by End User
- 6.4.4.2. Japan
- 6.4.4.2.1. Key market trends, growth factors and opportunities
- 6.4.4.2.2. Market size and forecast, by Product Type
- 6.4.4.2.3. Market size and forecast, by End User
- 6.4.4.3. India
- 6.4.4.3.1. Key market trends, growth factors and opportunities
- 6.4.4.3.2. Market size and forecast, by Product Type
- 6.4.4.3.3. Market size and forecast, by End User
- 6.4.4.4. Australia
- 6.4.4.4.1. Key market trends, growth factors and opportunities
- 6.4.4.4.2. Market size and forecast, by Product Type
- 6.4.4.4.3. Market size and forecast, by End User
- 6.4.4.5. South Korea
- 6.4.4.5.1. Key market trends, growth factors and opportunities
- 6.4.4.5.2. Market size and forecast, by Product Type
- 6.4.4.5.3. Market size and forecast, by End User
- 6.4.4.6. Rest of Asia-Pacific
- 6.4.4.6.1. Key market trends, growth factors and opportunities
- 6.4.4.6.2. Market size and forecast, by Product Type
- 6.4.4.6.3. Market size and forecast, by End User
- 6.5. LAMEA
- 6.5.1. Key trends and opportunities
- 6.5.2. Market size and forecast, by Product Type
- 6.5.3. Market size and forecast, by End User
- 6.5.4. Market size and forecast, by country
- 6.5.4.1. Latin America
- 6.5.4.1.1. Key market trends, growth factors and opportunities
- 6.5.4.1.2. Market size and forecast, by Product Type
- 6.5.4.1.3. Market size and forecast, by End User
- 6.5.4.2. Middle East
- 6.5.4.2.1. Key market trends, growth factors and opportunities
- 6.5.4.2.2. Market size and forecast, by Product Type
- 6.5.4.2.3. Market size and forecast, by End User
- 6.5.4.3. Africa
- 6.5.4.3.1. Key market trends, growth factors and opportunities
- 6.5.4.3.2. Market size and forecast, by Product Type
- 6.5.4.3.3. Market size and forecast, by End User
CHAPTER 7: COMPETITIVE LANDSCAPE
- 7.1. Introduction
- 7.2. Top winning strategies
- 7.3. Product Mapping of Top 10 Player
- 7.4. Competitive Dashboard
- 7.5. Competitive Heatmap
- 7.6. Top player positioning, 2021
CHAPTER 8: COMPANY PROFILES
- 8.1. Boeing Company
- 8.1.1. Company overview
- 8.1.2. Key Executives
- 8.1.3. Company snapshot
- 8.1.4. Operating business segments
- 8.1.5. Product portfolio
- 8.1.6. Business performance
- 8.1.7. Key strategic moves and developments
- 8.2. Dassault Aviation
- 8.2.1. Company overview
- 8.2.2. Key Executives
- 8.2.3. Company snapshot
- 8.2.4. Operating business segments
- 8.2.5. Product portfolio
- 8.2.6. Business performance
- 8.2.7. Key strategic moves and developments
- 8.3. GENERAL ELECTRIC
- 8.3.1. Company overview
- 8.3.2. Key Executives
- 8.3.3. Company snapshot
- 8.3.4. Operating business segments
- 8.3.5. Product portfolio
- 8.3.6. Business performance
- 8.3.7. Key strategic moves and developments
- 8.4. Honeywell International Inc.
- 8.4.1. Company overview
- 8.4.2. Key Executives
- 8.4.3. Company snapshot
- 8.4.4. Operating business segments
- 8.4.5. Product portfolio
- 8.4.6. Business performance
- 8.4.7. Key strategic moves and developments
- 8.5. Lockheed Martin Corporation
- 8.5.1. Company overview
- 8.5.2. Key Executives
- 8.5.3. Company snapshot
- 8.5.4. Operating business segments
- 8.5.5. Product portfolio
- 8.5.6. Business performance
- 8.5.7. Key strategic moves and developments
- 8.6. Lufthansa Technik
- 8.6.1. Company overview
- 8.6.2. Key Executives
- 8.6.3. Company snapshot
- 8.6.4. Operating business segments
- 8.6.5. Product portfolio
- 8.6.6. Business performance
- 8.6.7. Key strategic moves and developments
- 8.7. PARKER HANNIFIN CORP
- 8.7.1. Company overview
- 8.7.2. Key Executives
- 8.7.3. Company snapshot
- 8.7.4. Operating business segments
- 8.7.5. Product portfolio
- 8.7.6. Business performance
- 8.7.7. Key strategic moves and developments
- 8.8. Rolls-Royce plc
- 8.8.1. Company overview
- 8.8.2. Key Executives
- 8.8.3. Company snapshot
- 8.8.4. Operating business segments
- 8.8.5. Product portfolio
- 8.8.6. Business performance
- 8.8.7. Key strategic moves and developments
- 8.9. Safran S.A.
- 8.9.1. Company overview
- 8.9.2. Key Executives
- 8.9.3. Company snapshot
- 8.9.4. Operating business segments
- 8.9.5. Product portfolio
- 8.9.6. Business performance
- 8.9.7. Key strategic moves and developments
- 8.10. Thales Group
- 8.10.1. Company overview
- 8.10.2. Key Executives
- 8.10.3. Company snapshot
- 8.10.4. Operating business segments
- 8.10.5. Product portfolio
- 8.10.6. Business performance
- 8.10.7. Key strategic moves and developments
LIST OF TABLES
- TABLE 01. GLOBAL AEROSPACE PARTS MANUFACTURING MARKET, BY PRODUCT TYPE, 2021-2031 ($MILLION)
- TABLE 02. AEROSPACE PARTS MANUFACTURING MARKET FOR ENGINES, BY REGION, 2021-2031 ($MILLION)
- TABLE 03. AEROSPACE PARTS MANUFACTURING MARKET FOR CABIN INTERIORS, BY REGION, 2021-2031 ($MILLION)
- TABLE 04. AEROSPACE PARTS MANUFACTURING MARKET FOR AEROSTRUCTURE, BY REGION, 2021-2031 ($MILLION)
- TABLE 05. AEROSPACE PARTS MANUFACTURING MARKET FOR EQUIPMENT, SYSTEM, AND SUPPORT, BY REGION, 2021-2031 ($MILLION)
- TABLE 06. AEROSPACE PARTS MANUFACTURING MARKET FOR AVIONICS, BY REGION, 2021-2031 ($MILLION)
- TABLE 07. AEROSPACE PARTS MANUFACTURING MARKET FOR INSULATION COMPONENTS, BY REGION, 2021-2031 ($MILLION)
- TABLE 08. GLOBAL AEROSPACE PARTS MANUFACTURING MARKET, BY END USER, 2021-2031 ($MILLION)
- TABLE 09. AEROSPACE PARTS MANUFACTURING MARKET FOR COMMERCIAL AIRCRAFT, BY REGION, 2021-2031 ($MILLION)
- TABLE 10. AEROSPACE PARTS MANUFACTURING MARKET FOR BUSINESS AIRCRAFT, BY REGION, 2021-2031 ($MILLION)
- TABLE 11. AEROSPACE PARTS MANUFACTURING MARKET FOR MILITARY AIRCRAFT, BY REGION, 2021-2031 ($MILLION)
- TABLE 12. AEROSPACE PARTS MANUFACTURING MARKET FOR OTHERS, BY REGION, 2021-2031 ($MILLION)
- TABLE 13. AEROSPACE PARTS MANUFACTURING MARKET, BY REGION, 2021-2031 ($MILLION)
- TABLE 14. NORTH AMERICA AEROSPACE PARTS MANUFACTURING MARKET, BY PRODUCT TYPE, 2021-2031 ($MILLION)
- TABLE 15. NORTH AMERICA AEROSPACE PARTS MANUFACTURING MARKET, BY END USER, 2021-2031 ($MILLION)
- TABLE 16. NORTH AMERICA AEROSPACE PARTS MANUFACTURING MARKET, BY COUNTRY, 2021-2031 ($MILLION)
- TABLE 17. U.S. AEROSPACE PARTS MANUFACTURING MARKET, BY PRODUCT TYPE, 2021-2031 ($MILLION)
- TABLE 18. U.S. AEROSPACE PARTS MANUFACTURING MARKET, BY END USER, 2021-2031 ($MILLION)
- TABLE 19. CANADA AEROSPACE PARTS MANUFACTURING MARKET, BY PRODUCT TYPE, 2021-2031 ($MILLION)
- TABLE 20. CANADA AEROSPACE PARTS MANUFACTURING MARKET, BY END USER, 2021-2031 ($MILLION)
- TABLE 21. MEXICO AEROSPACE PARTS MANUFACTURING MARKET, BY PRODUCT TYPE, 2021-2031 ($MILLION)
- TABLE 22. MEXICO AEROSPACE PARTS MANUFACTURING MARKET, BY END USER, 2021-2031 ($MILLION)
- TABLE 23. EUROPE AEROSPACE PARTS MANUFACTURING MARKET, BY PRODUCT TYPE, 2021-2031 ($MILLION)
- TABLE 24. EUROPE AEROSPACE PARTS MANUFACTURING MARKET, BY END USER, 2021-2031 ($MILLION)
- TABLE 25. EUROPE AEROSPACE PARTS MANUFACTURING MARKET, BY COUNTRY, 2021-2031 ($MILLION)
- TABLE 26. UK AEROSPACE PARTS MANUFACTURING MARKET, BY PRODUCT TYPE, 2021-2031 ($MILLION)
- TABLE 27. UK AEROSPACE PARTS MANUFACTURING MARKET, BY END USER, 2021-2031 ($MILLION)
- TABLE 28. GERMANY AEROSPACE PARTS MANUFACTURING MARKET, BY PRODUCT TYPE, 2021-2031 ($MILLION)
- TABLE 29. GERMANY AEROSPACE PARTS MANUFACTURING MARKET, BY END USER, 2021-2031 ($MILLION)
- TABLE 30. FRANCE AEROSPACE PARTS MANUFACTURING MARKET, BY PRODUCT TYPE, 2021-2031 ($MILLION)
- TABLE 31. FRANCE AEROSPACE PARTS MANUFACTURING MARKET, BY END USER, 2021-2031 ($MILLION)
- TABLE 32. ITALY AEROSPACE PARTS MANUFACTURING MARKET, BY PRODUCT TYPE, 2021-2031 ($MILLION)
- TABLE 33. ITALY AEROSPACE PARTS MANUFACTURING MARKET, BY END USER, 2021-2031 ($MILLION)
- TABLE 34. RUSSIA AEROSPACE PARTS MANUFACTURING MARKET, BY PRODUCT TYPE, 2021-2031 ($MILLION)
- TABLE 35. RUSSIA AEROSPACE PARTS MANUFACTURING MARKET, BY END USER, 2021-2031 ($MILLION)
- TABLE 36. REST OF EUROPE AEROSPACE PARTS MANUFACTURING MARKET, BY PRODUCT TYPE, 2021-2031 ($MILLION)
- TABLE 37. REST OF EUROPE AEROSPACE PARTS MANUFACTURING MARKET, BY END USER, 2021-2031 ($MILLION)
- TABLE 38. ASIA-PACIFIC AEROSPACE PARTS MANUFACTURING MARKET, BY PRODUCT TYPE, 2021-2031 ($MILLION)
- TABLE 39. ASIA-PACIFIC AEROSPACE PARTS MANUFACTURING MARKET, BY END USER, 2021-2031 ($MILLION)
- TABLE 40. ASIA-PACIFIC AEROSPACE PARTS MANUFACTURING MARKET, BY COUNTRY, 2021-2031 ($MILLION)
- TABLE 41. CHINA AEROSPACE PARTS MANUFACTURING MARKET, BY PRODUCT TYPE, 2021-2031 ($MILLION)
- TABLE 42. CHINA AEROSPACE PARTS MANUFACTURING MARKET, BY END USER, 2021-2031 ($MILLION)
- TABLE 43. JAPAN AEROSPACE PARTS MANUFACTURING MARKET, BY PRODUCT TYPE, 2021-2031 ($MILLION)
- TABLE 44. JAPAN AEROSPACE PARTS MANUFACTURING MARKET, BY END USER, 2021-2031 ($MILLION)
- TABLE 45. INDIA AEROSPACE PARTS MANUFACTURING MARKET, BY PRODUCT TYPE, 2021-2031 ($MILLION)
- TABLE 46. INDIA AEROSPACE PARTS MANUFACTURING MARKET, BY END USER, 2021-2031 ($MILLION)
- TABLE 47. AUSTRALIA AEROSPACE PARTS MANUFACTURING MARKET, BY PRODUCT TYPE, 2021-2031 ($MILLION)
- TABLE 48. AUSTRALIA AEROSPACE PARTS MANUFACTURING MARKET, BY END USER, 2021-2031 ($MILLION)
- TABLE 49. SOUTH KOREA AEROSPACE PARTS MANUFACTURING MARKET, BY PRODUCT TYPE, 2021-2031 ($MILLION)
- TABLE 50. SOUTH KOREA AEROSPACE PARTS MANUFACTURING MARKET, BY END USER, 2021-2031 ($MILLION)
- TABLE 51. REST OF ASIA-PACIFIC AEROSPACE PARTS MANUFACTURING MARKET, BY PRODUCT TYPE, 2021-2031 ($MILLION)
- TABLE 52. REST OF ASIA-PACIFIC AEROSPACE PARTS MANUFACTURING MARKET, BY END USER, 2021-2031 ($MILLION)
- TABLE 53. LAMEA AEROSPACE PARTS MANUFACTURING MARKET, BY PRODUCT TYPE, 2021-2031 ($MILLION)
- TABLE 54. LAMEA AEROSPACE PARTS MANUFACTURING MARKET, BY END USER, 2021-2031 ($MILLION)
- TABLE 55. LAMEA AEROSPACE PARTS MANUFACTURING MARKET, BY COUNTRY, 2021-2031 ($MILLION)
- TABLE 56. LATIN AMERICA AEROSPACE PARTS MANUFACTURING MARKET, BY PRODUCT TYPE, 2021-2031 ($MILLION)
- TABLE 57. LATIN AMERICA AEROSPACE PARTS MANUFACTURING MARKET, BY END USER, 2021-2031 ($MILLION)
- TABLE 58. MIDDLE EAST AEROSPACE PARTS MANUFACTURING MARKET, BY PRODUCT TYPE, 2021-2031 ($MILLION)
- TABLE 59. MIDDLE EAST AEROSPACE PARTS MANUFACTURING MARKET, BY END USER, 2021-2031 ($MILLION)
- TABLE 60. AFRICA AEROSPACE PARTS MANUFACTURING MARKET, BY PRODUCT TYPE, 2021-2031 ($MILLION)
- TABLE 61. AFRICA AEROSPACE PARTS MANUFACTURING MARKET, BY END USER, 2021-2031 ($MILLION)
- TABLE 62. BOEING COMPANY: KEY EXECUTIVES
- TABLE 63. BOEING COMPANY: COMPANY SNAPSHOT
- TABLE 64. BOEING COMPANY: PRODUCT SEGMENTS
- TABLE 65. BOEING COMPANY: PRODUCT PORTFOLIO
- TABLE 66. BOEING COMPANY: KEY STRATERGIES
- TABLE 67. DASSAULT AVIATION: KEY EXECUTIVES
- TABLE 68. DASSAULT AVIATION: COMPANY SNAPSHOT
- TABLE 69. DASSAULT AVIATION: PRODUCT SEGMENTS
- TABLE 70. DASSAULT AVIATION: PRODUCT PORTFOLIO
- TABLE 71. DASSAULT AVIATION: KEY STRATERGIES
- TABLE 72. GENERAL ELECTRIC: KEY EXECUTIVES
- TABLE 73. GENERAL ELECTRIC: COMPANY SNAPSHOT
- TABLE 74. GENERAL ELECTRIC: PRODUCT SEGMENTS
- TABLE 75. GENERAL ELECTRIC: PRODUCT PORTFOLIO
- TABLE 76. GENERAL ELECTRIC: KEY STRATERGIES
- TABLE 77. HONEYWELL INTERNATIONAL INC.: KEY EXECUTIVES
- TABLE 78. HONEYWELL INTERNATIONAL INC.: COMPANY SNAPSHOT
- TABLE 79. HONEYWELL INTERNATIONAL INC.: PRODUCT SEGMENTS
- TABLE 80. HONEYWELL INTERNATIONAL INC.: PRODUCT PORTFOLIO
- TABLE 81. HONEYWELL INTERNATIONAL INC.: KEY STRATERGIES
- TABLE 82. LOCKHEED MARTIN CORPORATION: KEY EXECUTIVES
- TABLE 83. LOCKHEED MARTIN CORPORATION: COMPANY SNAPSHOT
- TABLE 84. LOCKHEED MARTIN CORPORATION: PRODUCT SEGMENTS
- TABLE 85. LOCKHEED MARTIN CORPORATION: PRODUCT PORTFOLIO
- TABLE 86. LOCKHEED MARTIN CORPORATION: KEY STRATERGIES
- TABLE 87. LUFTHANSA TECHNIK: KEY EXECUTIVES
- TABLE 88. LUFTHANSA TECHNIK: COMPANY SNAPSHOT
- TABLE 89. LUFTHANSA TECHNIK: PRODUCT SEGMENTS
- TABLE 90. LUFTHANSA TECHNIK: PRODUCT PORTFOLIO
- TABLE 91. LUFTHANSA TECHNIK: KEY STRATERGIES
- TABLE 92. PARKER HANNIFIN CORP: KEY EXECUTIVES
- TABLE 93. PARKER HANNIFIN CORP: COMPANY SNAPSHOT
- TABLE 94. PARKER HANNIFIN CORP: PRODUCT SEGMENTS
- TABLE 95. PARKER HANNIFIN CORP: PRODUCT PORTFOLIO
- TABLE 96. PARKER HANNIFIN CORP: KEY STRATERGIES
- TABLE 97. ROLLS-ROYCE PLC: KEY EXECUTIVES
- TABLE 98. ROLLS-ROYCE PLC: COMPANY SNAPSHOT
- TABLE 99. ROLLS-ROYCE PLC: PRODUCT SEGMENTS
- TABLE 100. ROLLS-ROYCE PLC: PRODUCT PORTFOLIO
- TABLE 101. ROLLS-ROYCE PLC: KEY STRATERGIES
- TABLE 102. SAFRAN S.A.: KEY EXECUTIVES
- TABLE 103. SAFRAN S.A.: COMPANY SNAPSHOT
- TABLE 104. SAFRAN S.A.: PRODUCT SEGMENTS
- TABLE 105. SAFRAN S.A.: PRODUCT PORTFOLIO
- TABLE 106. SAFRAN S.A.: KEY STRATERGIES
- TABLE 107. THALES GROUP: KEY EXECUTIVES
- TABLE 108. THALES GROUP: COMPANY SNAPSHOT
- TABLE 109. THALES GROUP: PRODUCT SEGMENTS
- TABLE 110. THALES GROUP: PRODUCT PORTFOLIO
- TABLE 111. THALES GROUP: KEY STRATERGIES
LIST OF FIGURES
- FIGURE 01. AEROSPACE PARTS MANUFACTURING MARKET, 2021-2031
- FIGURE 02. SEGMENTATION OF AEROSPACE PARTS MANUFACTURING MARKET, 2021-2031
- FIGURE 03. TOP INVESTMENT POCKETS IN AEROSPACE PARTS MANUFACTURING MARKET (2022-2031)
- FIGURE 04. LOW BARGAINING POWER OF SUPPLIERS
- FIGURE 05. LOW BARGAINING POWER OF BUYERS
- FIGURE 06. LOW THREAT OF SUBSTITUTES
- FIGURE 07. LOW THREAT OF NEW ENTRANTS
- FIGURE 08. LOW INTENSITY OF RIVALRY
- FIGURE 09. DRIVERS, RESTRAINTS AND OPPORTUNITIES: GLOBALAEROSPACE PARTS MANUFACTURING MARKET
- FIGURE 10. AEROSPACE PARTS MANUFACTURING MARKET, BY PRODUCT TYPE, 2021(%)
- FIGURE 11. COMPARATIVE SHARE ANALYSIS OF AEROSPACE PARTS MANUFACTURING MARKET FOR ENGINES, BY COUNTRY 2021 AND 2031(%)
- FIGURE 12. COMPARATIVE SHARE ANALYSIS OF AEROSPACE PARTS MANUFACTURING MARKET FOR CABIN INTERIORS, BY COUNTRY 2021 AND 2031(%)
- FIGURE 13. COMPARATIVE SHARE ANALYSIS OF AEROSPACE PARTS MANUFACTURING MARKET FOR AEROSTRUCTURE, BY COUNTRY 2021 AND 2031(%)
- FIGURE 14. COMPARATIVE SHARE ANALYSIS OF AEROSPACE PARTS MANUFACTURING MARKET FOR EQUIPMENT, SYSTEM, AND SUPPORT, BY COUNTRY 2021 AND 2031(%)
- FIGURE 15. COMPARATIVE SHARE ANALYSIS OF AEROSPACE PARTS MANUFACTURING MARKET FOR AVIONICS, BY COUNTRY 2021 AND 2031(%)
- FIGURE 16. COMPARATIVE SHARE ANALYSIS OF AEROSPACE PARTS MANUFACTURING MARKET FOR INSULATION COMPONENTS, BY COUNTRY 2021 AND 2031(%)
- FIGURE 17. AEROSPACE PARTS MANUFACTURING MARKET, BY END USER, 2021(%)
- FIGURE 18. COMPARATIVE SHARE ANALYSIS OF AEROSPACE PARTS MANUFACTURING MARKET FOR COMMERCIAL AIRCRAFT, BY COUNTRY 2021 AND 2031(%)
- FIGURE 19. COMPARATIVE SHARE ANALYSIS OF AEROSPACE PARTS MANUFACTURING MARKET FOR BUSINESS AIRCRAFT, BY COUNTRY 2021 AND 2031(%)
- FIGURE 20. COMPARATIVE SHARE ANALYSIS OF AEROSPACE PARTS MANUFACTURING MARKET FOR MILITARY AIRCRAFT, BY COUNTRY 2021 AND 2031(%)
- FIGURE 21. COMPARATIVE SHARE ANALYSIS OF AEROSPACE PARTS MANUFACTURING MARKET FOR OTHERS, BY COUNTRY 2021 AND 2031(%)
- FIGURE 22. AEROSPACE PARTS MANUFACTURING MARKET BY REGION, 2021
- FIGURE 23. U.S. AEROSPACE PARTS MANUFACTURING MARKET, 2021-2031 ($MILLION)
- FIGURE 24. CANADA AEROSPACE PARTS MANUFACTURING MARKET, 2021-2031 ($MILLION)
- FIGURE 25. MEXICO AEROSPACE PARTS MANUFACTURING MARKET, 2021-2031 ($MILLION)
- FIGURE 26. UK AEROSPACE PARTS MANUFACTURING MARKET, 2021-2031 ($MILLION)
- FIGURE 27. GERMANY AEROSPACE PARTS MANUFACTURING MARKET, 2021-2031 ($MILLION)
- FIGURE 28. FRANCE AEROSPACE PARTS MANUFACTURING MARKET, 2021-2031 ($MILLION)
- FIGURE 29. ITALY AEROSPACE PARTS MANUFACTURING MARKET, 2021-2031 ($MILLION)
- FIGURE 30. RUSSIA AEROSPACE PARTS MANUFACTURING MARKET, 2021-2031 ($MILLION)
- FIGURE 31. REST OF EUROPE AEROSPACE PARTS MANUFACTURING MARKET, 2021-2031 ($MILLION)
- FIGURE 32. CHINA AEROSPACE PARTS MANUFACTURING MARKET, 2021-2031 ($MILLION)
- FIGURE 33. JAPAN AEROSPACE PARTS MANUFACTURING MARKET, 2021-2031 ($MILLION)
- FIGURE 34. INDIA AEROSPACE PARTS MANUFACTURING MARKET, 2021-2031 ($MILLION)
- FIGURE 35. AUSTRALIA AEROSPACE PARTS MANUFACTURING MARKET, 2021-2031 ($MILLION)
- FIGURE 36. SOUTH KOREA AEROSPACE PARTS MANUFACTURING MARKET, 2021-2031 ($MILLION)
- FIGURE 37. REST OF ASIA-PACIFIC AEROSPACE PARTS MANUFACTURING MARKET, 2021-2031 ($MILLION)
- FIGURE 38. LATIN AMERICA AEROSPACE PARTS MANUFACTURING MARKET, 2021-2031 ($MILLION)
- FIGURE 39. MIDDLE EAST AEROSPACE PARTS MANUFACTURING MARKET, 2021-2031 ($MILLION)
- FIGURE 40. AFRICA AEROSPACE PARTS MANUFACTURING MARKET, 2021-2031 ($MILLION)
- FIGURE 41. TOP WINNING STRATEGIES, BY YEAR
- FIGURE 42. TOP WINNING STRATEGIES, BY DEVELOPMENT
- FIGURE 43. TOP WINNING STRATEGIES, BY COMPANY
- FIGURE 44. PRODUCT MAPPING OF TOP 10 PLAYERS
- FIGURE 45. COMPETITIVE DASHBOARD
- FIGURE 46. COMPETITIVE HEATMAP: AEROSPACE PARTS MANUFACTURING MARKET
- FIGURE 47. TOP PLAYER POSITIONING, 2021
- FIGURE 48. BOEING COMPANY: RESEARCH & DEVELOPMENT EXPENDITURE, 2019-2021
- FIGURE 49. BOEING COMPANY: NET SALES, 2019-2021 ($MILLION)
- FIGURE 50. BOEING COMPANY: REVENUE SHARE BY SEGMENT, 2021 (%)
- FIGURE 51. BOEING COMPANY: REVENUE SHARE BY REGION, 2021 (%)
- FIGURE 52. DASSAULT AVIATION: RESEARCH & DEVELOPMENT EXPENDITURE, 2019-2021 ($MILLION)
- FIGURE 53. DASSAULT AVIATION: NET SALES, 2019-2021 ($MILLION)
- FIGURE 54. DASSAULT AVIATION: REVENUE SHARE BY REGION, 2021 (%)
- FIGURE 55. GENERAL ELECTRIC: NET REVENUE, 2020-2022 ($MILLION)
- FIGURE 56. GENERAL ELECTRIC: RESEARCH & DEVELOPMENT EXPENDITURE, 2020-2022 ($MILLION)
- FIGURE 57. GENERAL ELECTRIC: REVENUE SHARE BY REGION, 2022 (%)
- FIGURE 58. GENERAL ELECTRIC: REVENUE SHARE BY SEGMENT, 2022 (%)
- FIGURE 59. HONEYWELL INTERNATIONAL INC.: NET REVENUE, 2020-2022 ($MILLION)
- FIGURE 60. HONEYWELL INTERNATIONAL INC.: REVENUE SHARE BY SEGMENT, 2022 (%)
- FIGURE 61. LOCKHEED MARTIN CORPORATION: NET SALES, 2019-2021 ($MILLION)
- FIGURE 62. LOCKHEED MARTIN CORPORATION: RESEARCH & DEVELOPMENT EXPENDITURE, 2019-2021 ($MILLION)
- FIGURE 63. LOCKHEED MARTIN CORPORATION: REVENUE SHARE BY SEGMENT, 2021 (%)
- FIGURE 64. LOCKHEED MARTIN CORPORATION: REVENUE SHARE BY REGION, 2021 (%)
- FIGURE 65. LUFTHANSA TECHNIK: NET REVENUE, 2020-2022 ($MILLION)
- FIGURE 66. LUFTHANSA TECHNIK: REVENUE SHARE BY SEGMENT, 2022 (%)
- FIGURE 67. PARKER HANNIFIN CORP: NET SALES, 2019-2021 ($MILLION)
- FIGURE 68. PARKER HANNIFIN CORP: RESEARCH & DEVELOPMENT EXPENDITURE, 2019-2021 ($MILLION)
- FIGURE 69. PARKER HANNIFIN CORP: REVENUE SHARE BY REGION, 2021 (%)
- FIGURE 70. PARKER HANNIFIN CORP: REVENUE SHARE BY SEGMENT, 2021 (%)
- FIGURE 71. ROLLS-ROYCE PLC: NET REVENUE, 2020-2022 ($MILLION)
- FIGURE 72. ROLLS-ROYCE PLC: RESEARCH & DEVELOPMENT EXPENDITURE, 2020-2022 ($MILLION)
- FIGURE 73. ROLLS-ROYCE PLC: REVENUE SHARE BY REGION, 2022 (%)
- FIGURE 74. ROLLS-ROYCE PLC: REVENUE SHARE BY SEGMENT, 2022 (%)
- FIGURE 75. SAFRAN S.A.: RESEARCH & DEVELOPMENT EXPENDITURE, 2019-2021
- FIGURE 76. SAFRAN S.A.: NET SALES, 2019-2021 ($MILLION)
- FIGURE 77. SAFRAN S.A.: REVENUE SHARE BY SEGMENT, 2021 (%)
- FIGURE 78. SAFRAN S.A.: REVENUE SHARE BY REGION, 2021 (%)
- FIGURE 79. THALES GROUP: RESEARCH & DEVELOPMENT EXPENDITURE, 2019-2021
- FIGURE 80. THALES GROUP: NET SALES, 2019-2021 ($MILLION)
- FIGURE 81. THALES GROUP: REVENUE SHARE BY SEGMENT, 2021 (%)
- FIGURE 82. THALES GROUP: REVENUE SHARE BY REGION, 2021 (%)
 2024-2028年全球航太零件製造市場
 航太零件製造市場:按產品、按飛機類型、按應用、按地區
 2024 年航太零件製造全球市場報告
 全球航太零件製造市場規模、佔有率、成長分析(按產品類型)- 產業預測,2023-2030 年
 2024 年航太耦合器全球市場報告
 航太零件製造市場:按產品、材料、製造方法和最終用戶分類 - 全球預測 2024-2030
 全球航太零件製造市場:按產品類型、應用和最終用戶分類的市場規模、區域前景、競爭策略和細分市場預測(至 2033 年)
 全球航太零件製造市場:規模、佔有率和趨勢分析報告 - 按產品、飛機類型、地區、細分市場預測,2024-2030 年
 航空航太零件製造市場、份額、規模、趨勢、產業分析報告:按產品、按最終用途、按地區、按細分市場、預測,2023-2032 年
 航太零件製造的全球市場 2023