


 |
市場調查報告書
商品編碼
1298246
聯網設備分析市場:按組件、按公司規模、按部署模型、按應用、按行業:2021-2031 年全球機會分析和行業預測Connected Device Analytics Market By Component, By Enterprise Size, By Deployment Model, By Application, By Industry Vertical : Global Opportunity Analysis and Industry Forecast, 2021-2031 |
||||||
連接設備分析正在幫助公司構建可以有效管理和探索來自不同數據源的實時信息流的平台和服務。
這使得公司能夠更輕鬆地管理、優化和設想其業務流程和運營,同時提高盈利能力、有效性並消除威脅。
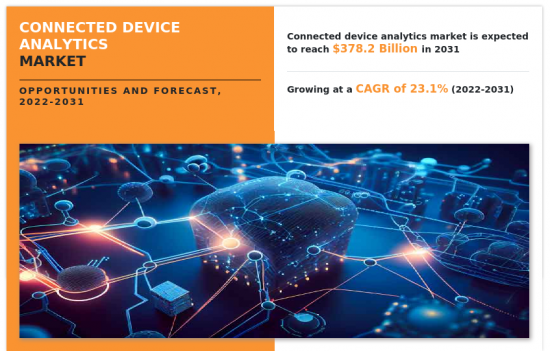
人們越來越關注遠程監控以支持遠程辦公,以及互聯網和物聯網設備的日益普及,正在推動全球聯網設備分析市場的增長。此外,數字化轉型技術的利用不斷增加,也對互聯設備分析市場的增長產生了積極影響。然而,技術工人的短缺和日益嚴重的安全問題正在阻礙聯網設備分析市場的增長。相反,作為關鍵物聯網計劃而出現的實時分析的興起預計將為預測期內聯網設備分析市場的擴展提供利潤豐厚的機會。
目錄
第 1 章 簡介
第二章執行摘要
第三章市場概況
- 市場定義和範圍
- 主要發現
- 影響因素
- 主要投資機會
- 波特五力分析
- 供應商的議價能力
- 買方議價能力
- 替代品的威脅
- 新進入者的威脅
- 競爭強度
- 市場動態
- 促進者
- 更多地使用數字化轉型技術
- 越來越關注遠程監控以支持遠程辦公
- 互聯網和物聯網設備的普及率提高
- 抑製劑
- 熟練工人短缺
- 安全問題日益嚴重
- 機會
- 實時分析的增加成為一項關鍵的物聯網計劃
- 促進者
- COVID-19 的市場影響分析
4 連接設備分析市場(按組件)
- 概述
- 市場規模及預測
- 解決方案
- 主要市場趨勢、增長動力和機遇
- 市場規模/預測:按地區
- 市場份額分析:按國家分類
- 服務
- 主要市場趨勢、增長動力和機遇
- 市場規模/預測:按地區
- 市場份額分析:按國家分類
5 連接設備分析市場(按公司規模)
- 概述
- 市場規模及預測
- 大公司
- 主要市場趨勢、增長動力和機遇
- 市場規模/預測:按地區
- 市場份額分析:按國家分類
- 中小企業
- 主要市場趨勢、增長動力和機遇
- 市場規模/預測:按地區
- 市場份額分析:按國家分類
6 連接設備分析市場(按部署模型)
- 概述
- 市場規模及預測
- 本地
- 主要市場趨勢、增長動力和機遇
- 市場規模/預測:按地區
- 市場份額分析:按國家分類
- 雲
- 主要市場趨勢、增長動力和機遇
- 市場規模/預測:按地區
- 市場份額分析:按國家分類
7 連接設備分析市場(按應用)
- 概述
- 市場規模/預測
- 銷售/客戶管理
- 主要市場趨勢、增長動力和機遇
- 市場規模/預測:按地區
- 市場份額分析:按國家分類
- 安全與應急管理
- 主要市場趨勢、增長動力和機遇
- 市場規模/預測:按地區
- 市場份額分析:按國家分類
- 遠程監控
- 主要市場趨勢、增長動力和機遇
- 市場規模/預測:按地區
- 市場份額分析:按國家分類
- 主動維護和資產管理
- 主要市場趨勢、增長動力和機遇
- 市場規模/預測:按地區
- 市場份額分析:按國家分類
- 庫存控制
- 主要市場趨勢、增長動力和機遇
- 市場規模/預測:按地區
- 市場份額分析:按國家分類
- 能源管理
- 主要市場趨勢、增長動力和機遇
- 市場規模/預測:按地區
- 市場份額分析:按國家分類
- 樓宇自動化
- 主要市場趨勢、增長動力和機遇
- 市場規模/預測:按地區
- 市場份額分析:按國家分類
- 其他
- 主要市場趨勢、增長動力和機遇
- 市場規模/預測:按地區
- 市場份額分析:按國家分類
8 連接設備分析市場(按行業)
- 概述
- 市場規模及預測
- 製造業
- 主要市場趨勢、增長動力和機遇
- 市場規模/預測:按地區
- 市場份額分析:按國家分類
- 運輸/物流
- 主要市場趨勢、增長動力和機遇
- 市場規模/預測:按地區
- 市場份額分析:按國家分類
- 能源與公用事業
- 主要市場趨勢、增長動力和機遇
- 市場規模/預測:按地區
- 市場份額分析:按國家分類
- 零售/電子商務
- 主要市場趨勢、增長動力和機遇
- 市場規模/預測:按地區
- 市場份額分析:按國家分類
- BFSI市場
- 主要市場趨勢、增長動力和機遇
- 市場規模/預測:按地區
- 市場份額分析:按國家分類
- 健康/生命科學
- 主要市場趨勢、增長動力和機遇
- 市場規模/預測:按地區
- 市場份額分析:按國家分類
- 政府/國防
- 主要市場趨勢、增長動力和機遇
- 市場規模/預測:按地區
- 市場份額分析:按國家分類
- 其他
- 主要市場趨勢、增長動力和機遇
- 市場規模/預測:按地區
- 市場份額分析:按國家分類
9 連接設備分析市場(按地區)
- 概述
- 市場規模/預測:按地區
- 北美
- 主要趨勢和機遇
- 市場規模/預測:按組件
- 市場規模/預測:按公司規模
- 市場規模/預測:按部署模型
- 市場規模/預測:應用
- 市場規模/預測:按行業劃分
- 市場規模/預測:按國家
- 美國
- 主要市場趨勢、增長動力和機遇
- 市場規模/預測:按組件
- 市場規模/預測:按公司規模
- 市場規模/預測:按部署模型
- 市場規模/預測:應用
- 市場規模/預測:按行業劃分
- 加拿大
- 主要市場趨勢、增長動力和機遇
- 市場規模/預測:按組件
- 市場規模/預測:按公司規模
- 市場規模/預測:按部署模型
- 市場規模/預測:應用
- 市場規模/預測:按行業劃分
- 歐洲
- 主要趨勢和機遇
- 市場規模/預測:按組件
- 市場規模/預測:按公司規模
- 市場規模/預測:按部署模型
- 市場規模/預測:應用
- 市場規模/預測:按行業劃分
- 市場規模/預測:按國家
- 英國
- 主要市場趨勢、增長動力和機遇
- 市場規模/預測:按組件
- 市場規模/預測:按公司規模
- 市場規模/預測:按部署模型
- 市場規模/預測:應用
- 市場規模/預測:按行業劃分
- 德國
- 主要市場趨勢、增長動力和機遇
- 市場規模/預測:按組件
- 市場規模/預測:按公司規模
- 市場規模/預測:按部署模型
- 市場規模/預測:應用
- 市場規模/預測:按行業劃分
- 法國
- 主要市場趨勢、增長動力和機遇
- 市場規模/預測:按組件
- 市場規模/預測:按公司規模
- 市場規模/預測:按部署模型
- 市場規模/預測:應用
- 市場規模/預測:按行業劃分
- 西班牙
- 主要市場趨勢、增長動力和機遇
- 市場規模/預測:按組件
- 市場規模/預測:按公司規模
- 市場規模/預測:按部署模型
- 市場規模/預測:應用
- 市場規模/預測:按行業劃分
- 意大利
- 主要市場趨勢、增長動力和機遇
- 市場規模/預測:按組件
- 市場規模/預測:按公司規模
- 市場規模/預測:按部署模型
- 市場規模/預測:應用
- 市場規模/預測:按行業劃分
- 歐洲其他地區
- 主要市場趨勢、增長動力和機遇
- 市場規模/預測:按組件
- 市場規模/預測:按公司規模
- 市場規模/預測:按部署模型
- 市場規模/預測:應用
- 市場規模/預測:按行業劃分
- 亞太地區
- 主要趨勢和機遇
- 市場規模/預測:按組件
- 市場規模/預測:按公司規模
- 市場規模/預測:按部署模型
- 市場規模/預測:應用
- 市場規模/預測:按行業劃分
- 市場規模/預測:按國家
- 中國市場
- 主要市場趨勢、增長動力和機遇
- 市場規模/預測:按組件
- 市場規模/預測:按公司規模
- 市場規模/預測:按部署模型
- 市場規模/預測:應用
- 市場規模/預測:按行業劃分
- 日本
- 主要市場趨勢、增長動力和機遇
- 市場規模/預測:按組件
- 市場規模/預測:按公司規模
- 市場規模/預測:按部署模型
- 市場規模/預測:應用
- 市場規模/預測:按行業劃分
- 韓國市場
- 主要市場趨勢、增長動力和機遇
- 市場規模/預測:按組件
- 市場規模/預測:按公司規模
- 市場規模/預測:按部署模型
- 市場規模/預測:應用
- 市場規模/預測:按行業劃分
- 印度市場
- 主要市場趨勢、增長動力和機遇
- 市場規模/預測:按組件
- 市場規模/預測:按公司規模
- 市場規模/預測:按部署模型
- 市場規模/預測:應用
- 市場規模/預測:按行業劃分
- 澳大利亞
- 主要市場趨勢、增長動力和機遇
- 市場規模/預測:按組件
- 市場規模/預測:按公司規模
- 市場規模/預測:按部署模型
- 市場規模/預測:應用
- 市場規模/預測:按行業劃分
- 亞太其他地區
- 主要市場趨勢、增長動力和機遇
- 市場規模/預測:按組件
- 市場規模/預測:按公司規模
- 市場規模/預測:按部署模型
- 市場規模/預測:應用
- 市場規模/預測:按行業劃分
- 拉丁美洲/中東/非洲
- 主要趨勢和機遇
- 市場規模/預測:按組件
- 市場規模/預測:按公司規模
- 市場規模/預測:按部署模型
- 市場規模/預測:應用
- 市場規模/預測:按行業劃分
- 市場規模/預測:按國家
- 拉丁美洲
- 主要市場趨勢、增長動力和機遇
- 市場規模/預測:按組件
- 市場規模/預測:按公司規模
- 市場規模/預測:按部署模型
- 市場規模/預測:應用
- 市場規模/預測:按行業劃分
- 中東市場
- 主要市場趨勢、增長動力和機遇
- 市場規模/預測:按組件
- 市場規模/預測:按公司規模
- 市場規模/預測:按部署模型
- 市場規模/預測:應用
- 市場規模/預測:按行業劃分
- 非洲市場
- 主要市場趨勢、增長動力和機遇
- 市場規模/預測:按組件
- 市場規模/預測:按公司規模
- 市場規模/預測:按部署模型
- 市場規模/預測:應用
- 市場規模/預測:按行業劃分
第10章 競爭格局
- 介紹
- 關鍵成功策略
- 10大公司產品圖
- 比賽儀表板
- 比賽熱圖
- 2021 年頂級公司定位
第十一章公司簡介
- Microsoft Corporation
- Oracle Corporation
- SAP SE
- IBM Corporation
- Amazon Web Services Inc.
- Cisco Systems Inc.
- Google LLC
- Adobe
- Teradata Corporation
- Hitachi Ltd.
The connected device analytics helps to allow the companies to create platforms and services which enable them to proficiently manage and examine real-time information streams from diverse data sources. This facilitates companies to manage, better optimize and envisage business processes and operations as well as also improves the profitability and effectiveness and neutralizes threats.
Increase in focus on remote monitoring in support of work from home initiatives and increase in penetration of the internet and IoT devices is boosting the growth of the global connected device analytics market. In addition, increase in use of digital transformation technology is positively impacting growth of the connected device analytics market. However, lack of skilled workforce and increase in security concerns is hampering the connected device analytics market growth. On the contrary, increase in real-time analytics emerging as a key vital IoT initiative is expected to offer remunerative opportunities for expansion of the connected device analytics market during the forecast period.
The connected device analytics market is segmented on the basis of by component, deployment mode, enterprise size, application, industry vertical, and region. On the basis of component, the market is categorized into solution and service. On the basis of deployment mode, the market is fragmented into cloud and on-premise. On the basis of enterprise size, the market is bifurcated into large enterprises and SMEs. By application, it is segmented into security and emergency management, sales and customer management, remote monitoring, predictive maintaince and asset management, inventory management, energy management, building automation and others. By industry vertical, it is classified into manufacturing, transport and logistics, energy and utilities, retail and eCommerce, BFSI, health and life science, government and defense, and others. By region, the market is analyzed across North America, Europe, Asia-Pacific, and LAMEA.
The key players that operate in the connected device analytics market are: Adobe, Cisco Systems Inc., Amazon Web Services Inc., Hitachi Ltd., Google LLC, Teradata Corporation, IBM Corporation, SAP SE, Oracle Corporation, and Microsoft Corporation. These players have adopted various strategies to increase their market penetration and strengthen their position in the industry.
KEY BENEFITS FOR STAKEHOLDERS
- The study provides an in-depth analysis of the global connected device analytics market forecast along with the current and future trends to explain the imminent investment pockets.
- Information about key drivers, restraints, and opportunities and their impact analysis on global connected device analytics market trend is provided in the report.
- The Porter's five forces analysis illustrates the potency of the buyers and suppliers operating in the industry.
- The quantitative analysis of the market from 2022 to 2031 is provided to determine the market potential.
- .
Key Market Segments
By Component
- Solution
- Service
By Enterprise Size
- Large Enterprise
- SMEs
By Deployment Model
- On-Premise
- Cloud
By Application
- Sales and Customer Management
- Security and Emergency Management
- Remote Monitoring
- Predective Maintaince and Asset Management
- Inventory Management
- Energy Management
- Building Automation
- Others
By Industry Vertical
- Manufacturing
- Transport and logistics
- Energy and Utilities
- Retail and eCommerce
- BFSI
- Health and life science
- Government and defense
- Others
By Region
- North America
- U.S.
- Canada
- Europe
- UK
- Germany
- France
- Spain
- Italy
- Rest of Europe
- Asia-Pacific
- China
- Japan
- South Korea
- India
- Australia
- Rest of Asia-Pacific
- LAMEA
- Latin America
- Middle East
- Africa
Key Market Players:
- SAP SE
- Amazon Web Services Inc.
- Google LLC
- Hitachi Ltd.
- Teradata Corporation
- Microsoft Corporation
- IBM Corporation
- Cisco Systems Inc.
- Oracle Corporation
- Adobe
TABLE OF CONTENTS
CHAPTER 1: INTRODUCTION
- 1.1. Report description
- 1.2. Key market segments
- 1.3. Key benefits to the stakeholders
- 1.4. Research Methodology
- 1.4.1. Primary research
- 1.4.2. Secondary research
- 1.4.3. Analyst tools and models
CHAPTER 2: EXECUTIVE SUMMARY
- 2.1. CXO Perspective
CHAPTER 3: MARKET OVERVIEW
- 3.1. Market definition and scope
- 3.2. Key findings
- 3.2.1. Top impacting factors
- 3.2.2. Top investment pockets
- 3.3. Porter's five forces analysis
- 3.3.1. Bargaining power of suppliers
- 3.3.2. Bargaining power of buyers
- 3.3.3. Threat of substitutes
- 3.3.4. Threat of new entrants
- 3.3.5. Intensity of rivalry
- 3.4. Market dynamics
- 3.4.1. Drivers
- 3.4.1.1. Increase in use of digital transformation technology
- 3.4.1.2. Increase in focus on remote monitoring in support of work from home initiatives
- 3.4.1.3. Increase in penetration of the internet and IoT devices
- 3.4.1. Drivers
- 3.4.2. Restraints
- 3.4.2.1. Lack of skilled workforce
- 3.4.2.2. Increase in security concerns
- 3.4.3. Opportunities
- 3.4.3.1. Increase in real-time analytics emerging as a key vital IoT initiative
- 3.5. COVID-19 Impact Analysis on the market
CHAPTER 4: CONNECTED DEVICE ANALYTICS MARKET, BY COMPONENT
- 4.1. Overview
- 4.1.1. Market size and forecast
- 4.2. Solution
- 4.2.1. Key market trends, growth factors and opportunities
- 4.2.2. Market size and forecast, by region
- 4.2.3. Market share analysis by country
- 4.3. Service
- 4.3.1. Key market trends, growth factors and opportunities
- 4.3.2. Market size and forecast, by region
- 4.3.3. Market share analysis by country
CHAPTER 5: CONNECTED DEVICE ANALYTICS MARKET, BY ENTERPRISE SIZE
- 5.1. Overview
- 5.1.1. Market size and forecast
- 5.2. Large Enterprise
- 5.2.1. Key market trends, growth factors and opportunities
- 5.2.2. Market size and forecast, by region
- 5.2.3. Market share analysis by country
- 5.3. SMEs
- 5.3.1. Key market trends, growth factors and opportunities
- 5.3.2. Market size and forecast, by region
- 5.3.3. Market share analysis by country
CHAPTER 6: CONNECTED DEVICE ANALYTICS MARKET, BY DEPLOYMENT MODEL
- 6.1. Overview
- 6.1.1. Market size and forecast
- 6.2. On-Premise
- 6.2.1. Key market trends, growth factors and opportunities
- 6.2.2. Market size and forecast, by region
- 6.2.3. Market share analysis by country
- 6.3. Cloud
- 6.3.1. Key market trends, growth factors and opportunities
- 6.3.2. Market size and forecast, by region
- 6.3.3. Market share analysis by country
CHAPTER 7: CONNECTED DEVICE ANALYTICS MARKET, BY APPLICATION
- 7.1. Overview
- 7.1.1. Market size and forecast
- 7.2. Sales and Customer Management
- 7.2.1. Key market trends, growth factors and opportunities
- 7.2.2. Market size and forecast, by region
- 7.2.3. Market share analysis by country
- 7.3. Security and Emergency Management
- 7.3.1. Key market trends, growth factors and opportunities
- 7.3.2. Market size and forecast, by region
- 7.3.3. Market share analysis by country
- 7.4. Remote Monitoring
- 7.4.1. Key market trends, growth factors and opportunities
- 7.4.2. Market size and forecast, by region
- 7.4.3. Market share analysis by country
- 7.5. Predective Maintaince and Asset Management
- 7.5.1. Key market trends, growth factors and opportunities
- 7.5.2. Market size and forecast, by region
- 7.5.3. Market share analysis by country
- 7.6. Inventory Management
- 7.6.1. Key market trends, growth factors and opportunities
- 7.6.2. Market size and forecast, by region
- 7.6.3. Market share analysis by country
- 7.7. Energy Management
- 7.7.1. Key market trends, growth factors and opportunities
- 7.7.2. Market size and forecast, by region
- 7.7.3. Market share analysis by country
- 7.8. Building Automation
- 7.8.1. Key market trends, growth factors and opportunities
- 7.8.2. Market size and forecast, by region
- 7.8.3. Market share analysis by country
- 7.9. Others
- 7.9.1. Key market trends, growth factors and opportunities
- 7.9.2. Market size and forecast, by region
- 7.9.3. Market share analysis by country
CHAPTER 8: CONNECTED DEVICE ANALYTICS MARKET, BY INDUSTRY VERTICAL
- 8.1. Overview
- 8.1.1. Market size and forecast
- 8.2. Manufacturing
- 8.2.1. Key market trends, growth factors and opportunities
- 8.2.2. Market size and forecast, by region
- 8.2.3. Market share analysis by country
- 8.3. Transport and logistics
- 8.3.1. Key market trends, growth factors and opportunities
- 8.3.2. Market size and forecast, by region
- 8.3.3. Market share analysis by country
- 8.4. Energy and Utilities
- 8.4.1. Key market trends, growth factors and opportunities
- 8.4.2. Market size and forecast, by region
- 8.4.3. Market share analysis by country
- 8.5. Retail and eCommerce
- 8.5.1. Key market trends, growth factors and opportunities
- 8.5.2. Market size and forecast, by region
- 8.5.3. Market share analysis by country
- 8.6. BFSI
- 8.6.1. Key market trends, growth factors and opportunities
- 8.6.2. Market size and forecast, by region
- 8.6.3. Market share analysis by country
- 8.7. Health and life science
- 8.7.1. Key market trends, growth factors and opportunities
- 8.7.2. Market size and forecast, by region
- 8.7.3. Market share analysis by country
- 8.8. Government and defense
- 8.8.1. Key market trends, growth factors and opportunities
- 8.8.2. Market size and forecast, by region
- 8.8.3. Market share analysis by country
- 8.9. Others
- 8.9.1. Key market trends, growth factors and opportunities
- 8.9.2. Market size and forecast, by region
- 8.9.3. Market share analysis by country
CHAPTER 9: CONNECTED DEVICE ANALYTICS MARKET, BY REGION
- 9.1. Overview
- 9.1.1. Market size and forecast By Region
- 9.2. North America
- 9.2.1. Key trends and opportunities
- 9.2.2. Market size and forecast, by Component
- 9.2.3. Market size and forecast, by Enterprise Size
- 9.2.4. Market size and forecast, by Deployment Model
- 9.2.5. Market size and forecast, by Application
- 9.2.6. Market size and forecast, by Industry Vertical
- 9.2.7. Market size and forecast, by country
- 9.2.7.1. U.S.
- 9.2.7.1.1. Key market trends, growth factors and opportunities
- 9.2.7.1.2. Market size and forecast, by Component
- 9.2.7.1.3. Market size and forecast, by Enterprise Size
- 9.2.7.1.4. Market size and forecast, by Deployment Model
- 9.2.7.1.5. Market size and forecast, by Application
- 9.2.7.1.6. Market size and forecast, by Industry Vertical
- 9.2.7.2. Canada
- 9.2.7.2.1. Key market trends, growth factors and opportunities
- 9.2.7.2.2. Market size and forecast, by Component
- 9.2.7.2.3. Market size and forecast, by Enterprise Size
- 9.2.7.2.4. Market size and forecast, by Deployment Model
- 9.2.7.2.5. Market size and forecast, by Application
- 9.2.7.2.6. Market size and forecast, by Industry Vertical
- 9.3. Europe
- 9.3.1. Key trends and opportunities
- 9.3.2. Market size and forecast, by Component
- 9.3.3. Market size and forecast, by Enterprise Size
- 9.3.4. Market size and forecast, by Deployment Model
- 9.3.5. Market size and forecast, by Application
- 9.3.6. Market size and forecast, by Industry Vertical
- 9.3.7. Market size and forecast, by country
- 9.3.7.1. UK
- 9.3.7.1.1. Key market trends, growth factors and opportunities
- 9.3.7.1.2. Market size and forecast, by Component
- 9.3.7.1.3. Market size and forecast, by Enterprise Size
- 9.3.7.1.4. Market size and forecast, by Deployment Model
- 9.3.7.1.5. Market size and forecast, by Application
- 9.3.7.1.6. Market size and forecast, by Industry Vertical
- 9.3.7.2. Germany
- 9.3.7.2.1. Key market trends, growth factors and opportunities
- 9.3.7.2.2. Market size and forecast, by Component
- 9.3.7.2.3. Market size and forecast, by Enterprise Size
- 9.3.7.2.4. Market size and forecast, by Deployment Model
- 9.3.7.2.5. Market size and forecast, by Application
- 9.3.7.2.6. Market size and forecast, by Industry Vertical
- 9.3.7.3. France
- 9.3.7.3.1. Key market trends, growth factors and opportunities
- 9.3.7.3.2. Market size and forecast, by Component
- 9.3.7.3.3. Market size and forecast, by Enterprise Size
- 9.3.7.3.4. Market size and forecast, by Deployment Model
- 9.3.7.3.5. Market size and forecast, by Application
- 9.3.7.3.6. Market size and forecast, by Industry Vertical
- 9.3.7.4. Spain
- 9.3.7.4.1. Key market trends, growth factors and opportunities
- 9.3.7.4.2. Market size and forecast, by Component
- 9.3.7.4.3. Market size and forecast, by Enterprise Size
- 9.3.7.4.4. Market size and forecast, by Deployment Model
- 9.3.7.4.5. Market size and forecast, by Application
- 9.3.7.4.6. Market size and forecast, by Industry Vertical
- 9.3.7.5. Italy
- 9.3.7.5.1. Key market trends, growth factors and opportunities
- 9.3.7.5.2. Market size and forecast, by Component
- 9.3.7.5.3. Market size and forecast, by Enterprise Size
- 9.3.7.5.4. Market size and forecast, by Deployment Model
- 9.3.7.5.5. Market size and forecast, by Application
- 9.3.7.5.6. Market size and forecast, by Industry Vertical
- 9.3.7.6. Rest of Europe
- 9.3.7.6.1. Key market trends, growth factors and opportunities
- 9.3.7.6.2. Market size and forecast, by Component
- 9.3.7.6.3. Market size and forecast, by Enterprise Size
- 9.3.7.6.4. Market size and forecast, by Deployment Model
- 9.3.7.6.5. Market size and forecast, by Application
- 9.3.7.6.6. Market size and forecast, by Industry Vertical
- 9.4. Asia-Pacific
- 9.4.1. Key trends and opportunities
- 9.4.2. Market size and forecast, by Component
- 9.4.3. Market size and forecast, by Enterprise Size
- 9.4.4. Market size and forecast, by Deployment Model
- 9.4.5. Market size and forecast, by Application
- 9.4.6. Market size and forecast, by Industry Vertical
- 9.4.7. Market size and forecast, by country
- 9.4.7.1. China
- 9.4.7.1.1. Key market trends, growth factors and opportunities
- 9.4.7.1.2. Market size and forecast, by Component
- 9.4.7.1.3. Market size and forecast, by Enterprise Size
- 9.4.7.1.4. Market size and forecast, by Deployment Model
- 9.4.7.1.5. Market size and forecast, by Application
- 9.4.7.1.6. Market size and forecast, by Industry Vertical
- 9.4.7.2. Japan
- 9.4.7.2.1. Key market trends, growth factors and opportunities
- 9.4.7.2.2. Market size and forecast, by Component
- 9.4.7.2.3. Market size and forecast, by Enterprise Size
- 9.4.7.2.4. Market size and forecast, by Deployment Model
- 9.4.7.2.5. Market size and forecast, by Application
- 9.4.7.2.6. Market size and forecast, by Industry Vertical
- 9.4.7.3. South Korea
- 9.4.7.3.1. Key market trends, growth factors and opportunities
- 9.4.7.3.2. Market size and forecast, by Component
- 9.4.7.3.3. Market size and forecast, by Enterprise Size
- 9.4.7.3.4. Market size and forecast, by Deployment Model
- 9.4.7.3.5. Market size and forecast, by Application
- 9.4.7.3.6. Market size and forecast, by Industry Vertical
- 9.4.7.4. India
- 9.4.7.4.1. Key market trends, growth factors and opportunities
- 9.4.7.4.2. Market size and forecast, by Component
- 9.4.7.4.3. Market size and forecast, by Enterprise Size
- 9.4.7.4.4. Market size and forecast, by Deployment Model
- 9.4.7.4.5. Market size and forecast, by Application
- 9.4.7.4.6. Market size and forecast, by Industry Vertical
- 9.4.7.5. Australia
- 9.4.7.5.1. Key market trends, growth factors and opportunities
- 9.4.7.5.2. Market size and forecast, by Component
- 9.4.7.5.3. Market size and forecast, by Enterprise Size
- 9.4.7.5.4. Market size and forecast, by Deployment Model
- 9.4.7.5.5. Market size and forecast, by Application
- 9.4.7.5.6. Market size and forecast, by Industry Vertical
- 9.4.7.6. Rest of Asia-Pacific
- 9.4.7.6.1. Key market trends, growth factors and opportunities
- 9.4.7.6.2. Market size and forecast, by Component
- 9.4.7.6.3. Market size and forecast, by Enterprise Size
- 9.4.7.6.4. Market size and forecast, by Deployment Model
- 9.4.7.6.5. Market size and forecast, by Application
- 9.4.7.6.6. Market size and forecast, by Industry Vertical
- 9.5. LAMEA
- 9.5.1. Key trends and opportunities
- 9.5.2. Market size and forecast, by Component
- 9.5.3. Market size and forecast, by Enterprise Size
- 9.5.4. Market size and forecast, by Deployment Model
- 9.5.5. Market size and forecast, by Application
- 9.5.6. Market size and forecast, by Industry Vertical
- 9.5.7. Market size and forecast, by country
- 9.5.7.1. Latin America
- 9.5.7.1.1. Key market trends, growth factors and opportunities
- 9.5.7.1.2. Market size and forecast, by Component
- 9.5.7.1.3. Market size and forecast, by Enterprise Size
- 9.5.7.1.4. Market size and forecast, by Deployment Model
- 9.5.7.1.5. Market size and forecast, by Application
- 9.5.7.1.6. Market size and forecast, by Industry Vertical
- 9.5.7.2. Middle East
- 9.5.7.2.1. Key market trends, growth factors and opportunities
- 9.5.7.2.2. Market size and forecast, by Component
- 9.5.7.2.3. Market size and forecast, by Enterprise Size
- 9.5.7.2.4. Market size and forecast, by Deployment Model
- 9.5.7.2.5. Market size and forecast, by Application
- 9.5.7.2.6. Market size and forecast, by Industry Vertical
- 9.5.7.3. Africa
- 9.5.7.3.1. Key market trends, growth factors and opportunities
- 9.5.7.3.2. Market size and forecast, by Component
- 9.5.7.3.3. Market size and forecast, by Enterprise Size
- 9.5.7.3.4. Market size and forecast, by Deployment Model
- 9.5.7.3.5. Market size and forecast, by Application
- 9.5.7.3.6. Market size and forecast, by Industry Vertical
CHAPTER 10: COMPETITIVE LANDSCAPE
- 10.1. Introduction
- 10.2. Top winning strategies
- 10.3. Product Mapping of Top 10 Player
- 10.4. Competitive Dashboard
- 10.5. Competitive Heatmap
- 10.6. Top player positioning, 2021
CHAPTER 11: COMPANY PROFILES
- 11.1. Microsoft Corporation
- 11.1.1. Company overview
- 11.1.2. Key Executives
- 11.1.3. Company snapshot
- 11.1.4. Operating business segments
- 11.1.5. Product portfolio
- 11.1.6. Business performance
- 11.1.7. Key strategic moves and developments
- 11.2. Oracle Corporation
- 11.2.1. Company overview
- 11.2.2. Key Executives
- 11.2.3. Company snapshot
- 11.2.4. Operating business segments
- 11.2.5. Product portfolio
- 11.2.6. Business performance
- 11.2.7. Key strategic moves and developments
- 11.3. SAP SE
- 11.3.1. Company overview
- 11.3.2. Key Executives
- 11.3.3. Company snapshot
- 11.3.4. Operating business segments
- 11.3.5. Product portfolio
- 11.3.6. Business performance
- 11.3.7. Key strategic moves and developments
- 11.4. IBM Corporation
- 11.4.1. Company overview
- 11.4.2. Key Executives
- 11.4.3. Company snapshot
- 11.4.4. Operating business segments
- 11.4.5. Product portfolio
- 11.4.6. Business performance
- 11.4.7. Key strategic moves and developments
- 11.5. Amazon Web Services Inc.
- 11.5.1. Company overview
- 11.5.2. Key Executives
- 11.5.3. Company snapshot
- 11.5.4. Operating business segments
- 11.5.5. Product portfolio
- 11.5.6. Business performance
- 11.5.7. Key strategic moves and developments
- 11.6. Cisco Systems Inc.
- 11.6.1. Company overview
- 11.6.2. Key Executives
- 11.6.3. Company snapshot
- 11.6.4. Operating business segments
- 11.6.5. Product portfolio
- 11.6.6. Business performance
- 11.6.7. Key strategic moves and developments
- 11.7. Google LLC
- 11.7.1. Company overview
- 11.7.2. Key Executives
- 11.7.3. Company snapshot
- 11.7.4. Operating business segments
- 11.7.5. Product portfolio
- 11.7.6. Business performance
- 11.7.7. Key strategic moves and developments
- 11.8. Adobe
- 11.8.1. Company overview
- 11.8.2. Key Executives
- 11.8.3. Company snapshot
- 11.8.4. Operating business segments
- 11.8.5. Product portfolio
- 11.8.6. Business performance
- 11.8.7. Key strategic moves and developments
- 11.9. Teradata Corporation
- 11.9.1. Company overview
- 11.9.2. Key Executives
- 11.9.3. Company snapshot
- 11.9.4. Operating business segments
- 11.9.5. Product portfolio
- 11.9.6. Business performance
- 11.9.7. Key strategic moves and developments
- 11.10. Hitachi Ltd.
- 11.10.1. Company overview
- 11.10.2. Key Executives
- 11.10.3. Company snapshot
- 11.10.4. Operating business segments
- 11.10.5. Product portfolio
- 11.10.6. Business performance
- 11.10.7. Key strategic moves and developments
LIST OF TABLES
- TABLE 01. GLOBAL CONNECTED DEVICE ANALYTICS MARKET, BY COMPONENT, 2021-2031 ($MILLION)
- TABLE 02. CONNECTED DEVICE ANALYTICS MARKET FOR SOLUTION, BY REGION, 2021-2031 ($MILLION)
- TABLE 03. CONNECTED DEVICE ANALYTICS MARKET FOR SERVICE, BY REGION, 2021-2031 ($MILLION)
- TABLE 04. GLOBAL CONNECTED DEVICE ANALYTICS MARKET, BY ENTERPRISE SIZE, 2021-2031 ($MILLION)
- TABLE 05. CONNECTED DEVICE ANALYTICS MARKET FOR LARGE ENTERPRISE, BY REGION, 2021-2031 ($MILLION)
- TABLE 06. CONNECTED DEVICE ANALYTICS MARKET FOR SMES, BY REGION, 2021-2031 ($MILLION)
- TABLE 07. GLOBAL CONNECTED DEVICE ANALYTICS MARKET, BY DEPLOYMENT MODEL, 2021-2031 ($MILLION)
- TABLE 08. CONNECTED DEVICE ANALYTICS MARKET FOR ON-PREMISE, BY REGION, 2021-2031 ($MILLION)
- TABLE 09. CONNECTED DEVICE ANALYTICS MARKET FOR CLOUD, BY REGION, 2021-2031 ($MILLION)
- TABLE 10. GLOBAL CONNECTED DEVICE ANALYTICS MARKET, BY APPLICATION, 2021-2031 ($MILLION)
- TABLE 11. CONNECTED DEVICE ANALYTICS MARKET FOR SALES AND CUSTOMER MANAGEMENT, BY REGION, 2021-2031 ($MILLION)
- TABLE 12. CONNECTED DEVICE ANALYTICS MARKET FOR SECURITY AND EMERGENCY MANAGEMENT, BY REGION, 2021-2031 ($MILLION)
- TABLE 13. CONNECTED DEVICE ANALYTICS MARKET FOR REMOTE MONITORING, BY REGION, 2021-2031 ($MILLION)
- TABLE 14. CONNECTED DEVICE ANALYTICS MARKET FOR PREDECTIVE MAINTAINCE AND ASSET MANAGEMENT, BY REGION, 2021-2031 ($MILLION)
- TABLE 15. CONNECTED DEVICE ANALYTICS MARKET FOR INVENTORY MANAGEMENT, BY REGION, 2021-2031 ($MILLION)
- TABLE 16. CONNECTED DEVICE ANALYTICS MARKET FOR ENERGY MANAGEMENT, BY REGION, 2021-2031 ($MILLION)
- TABLE 17. CONNECTED DEVICE ANALYTICS MARKET FOR BUILDING AUTOMATION, BY REGION, 2021-2031 ($MILLION)
- TABLE 18. CONNECTED DEVICE ANALYTICS MARKET FOR OTHERS, BY REGION, 2021-2031 ($MILLION)
- TABLE 19. GLOBAL CONNECTED DEVICE ANALYTICS MARKET, BY INDUSTRY VERTICAL, 2021-2031 ($MILLION)
- TABLE 20. CONNECTED DEVICE ANALYTICS MARKET FOR MANUFACTURING, BY REGION, 2021-2031 ($MILLION)
- TABLE 21. CONNECTED DEVICE ANALYTICS MARKET FOR TRANSPORT AND LOGISTICS, BY REGION, 2021-2031 ($MILLION)
- TABLE 22. CONNECTED DEVICE ANALYTICS MARKET FOR ENERGY AND UTILITIES, BY REGION, 2021-2031 ($MILLION)
- TABLE 23. CONNECTED DEVICE ANALYTICS MARKET FOR RETAIL AND ECOMMERCE, BY REGION, 2021-2031 ($MILLION)
- TABLE 24. CONNECTED DEVICE ANALYTICS MARKET FOR BFSI, BY REGION, 2021-2031 ($MILLION)
- TABLE 25. CONNECTED DEVICE ANALYTICS MARKET FOR HEALTH AND LIFE SCIENCE, BY REGION, 2021-2031 ($MILLION)
- TABLE 26. CONNECTED DEVICE ANALYTICS MARKET FOR GOVERNMENT AND DEFENSE, BY REGION, 2021-2031 ($MILLION)
- TABLE 27. CONNECTED DEVICE ANALYTICS MARKET FOR OTHERS, BY REGION, 2021-2031 ($MILLION)
- TABLE 28. CONNECTED DEVICE ANALYTICS MARKET, BY REGION, 2021-2031 ($MILLION)
- TABLE 29. NORTH AMERICA CONNECTED DEVICE ANALYTICS MARKET, BY COMPONENT, 2021-2031 ($MILLION)
- TABLE 30. NORTH AMERICA CONNECTED DEVICE ANALYTICS MARKET, BY ENTERPRISE SIZE, 2021-2031 ($MILLION)
- TABLE 31. NORTH AMERICA CONNECTED DEVICE ANALYTICS MARKET, BY DEPLOYMENT MODEL, 2021-2031 ($MILLION)
- TABLE 32. NORTH AMERICA CONNECTED DEVICE ANALYTICS MARKET, BY APPLICATION, 2021-2031 ($MILLION)
- TABLE 33. NORTH AMERICA CONNECTED DEVICE ANALYTICS MARKET, BY INDUSTRY VERTICAL, 2021-2031 ($MILLION)
- TABLE 34. NORTH AMERICA CONNECTED DEVICE ANALYTICS MARKET, BY COUNTRY, 2021-2031 ($MILLION)
- TABLE 35. U.S. CONNECTED DEVICE ANALYTICS MARKET, BY COMPONENT, 2021-2031 ($MILLION)
- TABLE 36. U.S. CONNECTED DEVICE ANALYTICS MARKET, BY ENTERPRISE SIZE, 2021-2031 ($MILLION)
- TABLE 37. U.S. CONNECTED DEVICE ANALYTICS MARKET, BY DEPLOYMENT MODEL, 2021-2031 ($MILLION)
- TABLE 38. U.S. CONNECTED DEVICE ANALYTICS MARKET, BY APPLICATION, 2021-2031 ($MILLION)
- TABLE 39. U.S. CONNECTED DEVICE ANALYTICS MARKET, BY INDUSTRY VERTICAL, 2021-2031 ($MILLION)
- TABLE 40. CANADA CONNECTED DEVICE ANALYTICS MARKET, BY COMPONENT, 2021-2031 ($MILLION)
- TABLE 41. CANADA CONNECTED DEVICE ANALYTICS MARKET, BY ENTERPRISE SIZE, 2021-2031 ($MILLION)
- TABLE 42. CANADA CONNECTED DEVICE ANALYTICS MARKET, BY DEPLOYMENT MODEL, 2021-2031 ($MILLION)
- TABLE 43. CANADA CONNECTED DEVICE ANALYTICS MARKET, BY APPLICATION, 2021-2031 ($MILLION)
- TABLE 44. CANADA CONNECTED DEVICE ANALYTICS MARKET, BY INDUSTRY VERTICAL, 2021-2031 ($MILLION)
- TABLE 45. EUROPE CONNECTED DEVICE ANALYTICS MARKET, BY COMPONENT, 2021-2031 ($MILLION)
- TABLE 46. EUROPE CONNECTED DEVICE ANALYTICS MARKET, BY ENTERPRISE SIZE, 2021-2031 ($MILLION)
- TABLE 47. EUROPE CONNECTED DEVICE ANALYTICS MARKET, BY DEPLOYMENT MODEL, 2021-2031 ($MILLION)
- TABLE 48. EUROPE CONNECTED DEVICE ANALYTICS MARKET, BY APPLICATION, 2021-2031 ($MILLION)
- TABLE 49. EUROPE CONNECTED DEVICE ANALYTICS MARKET, BY INDUSTRY VERTICAL, 2021-2031 ($MILLION)
- TABLE 50. EUROPE CONNECTED DEVICE ANALYTICS MARKET, BY COUNTRY, 2021-2031 ($MILLION)
- TABLE 51. UK CONNECTED DEVICE ANALYTICS MARKET, BY COMPONENT, 2021-2031 ($MILLION)
- TABLE 52. UK CONNECTED DEVICE ANALYTICS MARKET, BY ENTERPRISE SIZE, 2021-2031 ($MILLION)
- TABLE 53. UK CONNECTED DEVICE ANALYTICS MARKET, BY DEPLOYMENT MODEL, 2021-2031 ($MILLION)
- TABLE 54. UK CONNECTED DEVICE ANALYTICS MARKET, BY APPLICATION, 2021-2031 ($MILLION)
- TABLE 55. UK CONNECTED DEVICE ANALYTICS MARKET, BY INDUSTRY VERTICAL, 2021-2031 ($MILLION)
- TABLE 56. GERMANY CONNECTED DEVICE ANALYTICS MARKET, BY COMPONENT, 2021-2031 ($MILLION)
- TABLE 57. GERMANY CONNECTED DEVICE ANALYTICS MARKET, BY ENTERPRISE SIZE, 2021-2031 ($MILLION)
- TABLE 58. GERMANY CONNECTED DEVICE ANALYTICS MARKET, BY DEPLOYMENT MODEL, 2021-2031 ($MILLION)
- TABLE 59. GERMANY CONNECTED DEVICE ANALYTICS MARKET, BY APPLICATION, 2021-2031 ($MILLION)
- TABLE 60. GERMANY CONNECTED DEVICE ANALYTICS MARKET, BY INDUSTRY VERTICAL, 2021-2031 ($MILLION)
- TABLE 61. FRANCE CONNECTED DEVICE ANALYTICS MARKET, BY COMPONENT, 2021-2031 ($MILLION)
- TABLE 62. FRANCE CONNECTED DEVICE ANALYTICS MARKET, BY ENTERPRISE SIZE, 2021-2031 ($MILLION)
- TABLE 63. FRANCE CONNECTED DEVICE ANALYTICS MARKET, BY DEPLOYMENT MODEL, 2021-2031 ($MILLION)
- TABLE 64. FRANCE CONNECTED DEVICE ANALYTICS MARKET, BY APPLICATION, 2021-2031 ($MILLION)
- TABLE 65. FRANCE CONNECTED DEVICE ANALYTICS MARKET, BY INDUSTRY VERTICAL, 2021-2031 ($MILLION)
- TABLE 66. SPAIN CONNECTED DEVICE ANALYTICS MARKET, BY COMPONENT, 2021-2031 ($MILLION)
- TABLE 67. SPAIN CONNECTED DEVICE ANALYTICS MARKET, BY ENTERPRISE SIZE, 2021-2031 ($MILLION)
- TABLE 68. SPAIN CONNECTED DEVICE ANALYTICS MARKET, BY DEPLOYMENT MODEL, 2021-2031 ($MILLION)
- TABLE 69. SPAIN CONNECTED DEVICE ANALYTICS MARKET, BY APPLICATION, 2021-2031 ($MILLION)
- TABLE 70. SPAIN CONNECTED DEVICE ANALYTICS MARKET, BY INDUSTRY VERTICAL, 2021-2031 ($MILLION)
- TABLE 71. ITALY CONNECTED DEVICE ANALYTICS MARKET, BY COMPONENT, 2021-2031 ($MILLION)
- TABLE 72. ITALY CONNECTED DEVICE ANALYTICS MARKET, BY ENTERPRISE SIZE, 2021-2031 ($MILLION)
- TABLE 73. ITALY CONNECTED DEVICE ANALYTICS MARKET, BY DEPLOYMENT MODEL, 2021-2031 ($MILLION)
- TABLE 74. ITALY CONNECTED DEVICE ANALYTICS MARKET, BY APPLICATION, 2021-2031 ($MILLION)
- TABLE 75. ITALY CONNECTED DEVICE ANALYTICS MARKET, BY INDUSTRY VERTICAL, 2021-2031 ($MILLION)
- TABLE 76. REST OF EUROPE CONNECTED DEVICE ANALYTICS MARKET, BY COMPONENT, 2021-2031 ($MILLION)
- TABLE 77. REST OF EUROPE CONNECTED DEVICE ANALYTICS MARKET, BY ENTERPRISE SIZE, 2021-2031 ($MILLION)
- TABLE 78. REST OF EUROPE CONNECTED DEVICE ANALYTICS MARKET, BY DEPLOYMENT MODEL, 2021-2031 ($MILLION)
- TABLE 79. REST OF EUROPE CONNECTED DEVICE ANALYTICS MARKET, BY APPLICATION, 2021-2031 ($MILLION)
- TABLE 80. REST OF EUROPE CONNECTED DEVICE ANALYTICS MARKET, BY INDUSTRY VERTICAL, 2021-2031 ($MILLION)
- TABLE 81. ASIA-PACIFIC CONNECTED DEVICE ANALYTICS MARKET, BY COMPONENT, 2021-2031 ($MILLION)
- TABLE 82. ASIA-PACIFIC CONNECTED DEVICE ANALYTICS MARKET, BY ENTERPRISE SIZE, 2021-2031 ($MILLION)
- TABLE 83. ASIA-PACIFIC CONNECTED DEVICE ANALYTICS MARKET, BY DEPLOYMENT MODEL, 2021-2031 ($MILLION)
- TABLE 84. ASIA-PACIFIC CONNECTED DEVICE ANALYTICS MARKET, BY APPLICATION, 2021-2031 ($MILLION)
- TABLE 85. ASIA-PACIFIC CONNECTED DEVICE ANALYTICS MARKET, BY INDUSTRY VERTICAL, 2021-2031 ($MILLION)
- TABLE 86. ASIA-PACIFIC CONNECTED DEVICE ANALYTICS MARKET, BY COUNTRY, 2021-2031 ($MILLION)
- TABLE 87. CHINA CONNECTED DEVICE ANALYTICS MARKET, BY COMPONENT, 2021-2031 ($MILLION)
- TABLE 88. CHINA CONNECTED DEVICE ANALYTICS MARKET, BY ENTERPRISE SIZE, 2021-2031 ($MILLION)
- TABLE 89. CHINA CONNECTED DEVICE ANALYTICS MARKET, BY DEPLOYMENT MODEL, 2021-2031 ($MILLION)
- TABLE 90. CHINA CONNECTED DEVICE ANALYTICS MARKET, BY APPLICATION, 2021-2031 ($MILLION)
- TABLE 91. CHINA CONNECTED DEVICE ANALYTICS MARKET, BY INDUSTRY VERTICAL, 2021-2031 ($MILLION)
- TABLE 92. JAPAN CONNECTED DEVICE ANALYTICS MARKET, BY COMPONENT, 2021-2031 ($MILLION)
- TABLE 93. JAPAN CONNECTED DEVICE ANALYTICS MARKET, BY ENTERPRISE SIZE, 2021-2031 ($MILLION)
- TABLE 94. JAPAN CONNECTED DEVICE ANALYTICS MARKET, BY DEPLOYMENT MODEL, 2021-2031 ($MILLION)
- TABLE 95. JAPAN CONNECTED DEVICE ANALYTICS MARKET, BY APPLICATION, 2021-2031 ($MILLION)
- TABLE 96. JAPAN CONNECTED DEVICE ANALYTICS MARKET, BY INDUSTRY VERTICAL, 2021-2031 ($MILLION)
- TABLE 97. SOUTH KOREA CONNECTED DEVICE ANALYTICS MARKET, BY COMPONENT, 2021-2031 ($MILLION)
- TABLE 98. SOUTH KOREA CONNECTED DEVICE ANALYTICS MARKET, BY ENTERPRISE SIZE, 2021-2031 ($MILLION)
- TABLE 99. SOUTH KOREA CONNECTED DEVICE ANALYTICS MARKET, BY DEPLOYMENT MODEL, 2021-2031 ($MILLION)
- TABLE 100. SOUTH KOREA CONNECTED DEVICE ANALYTICS MARKET, BY APPLICATION, 2021-2031 ($MILLION)
- TABLE 101. SOUTH KOREA CONNECTED DEVICE ANALYTICS MARKET, BY INDUSTRY VERTICAL, 2021-2031 ($MILLION)
- TABLE 102. INDIA CONNECTED DEVICE ANALYTICS MARKET, BY COMPONENT, 2021-2031 ($MILLION)
- TABLE 103. INDIA CONNECTED DEVICE ANALYTICS MARKET, BY ENTERPRISE SIZE, 2021-2031 ($MILLION)
- TABLE 104. INDIA CONNECTED DEVICE ANALYTICS MARKET, BY DEPLOYMENT MODEL, 2021-2031 ($MILLION)
- TABLE 105. INDIA CONNECTED DEVICE ANALYTICS MARKET, BY APPLICATION, 2021-2031 ($MILLION)
- TABLE 106. INDIA CONNECTED DEVICE ANALYTICS MARKET, BY INDUSTRY VERTICAL, 2021-2031 ($MILLION)
- TABLE 107. AUSTRALIA CONNECTED DEVICE ANALYTICS MARKET, BY COMPONENT, 2021-2031 ($MILLION)
- TABLE 108. AUSTRALIA CONNECTED DEVICE ANALYTICS MARKET, BY ENTERPRISE SIZE, 2021-2031 ($MILLION)
- TABLE 109. AUSTRALIA CONNECTED DEVICE ANALYTICS MARKET, BY DEPLOYMENT MODEL, 2021-2031 ($MILLION)
- TABLE 110. AUSTRALIA CONNECTED DEVICE ANALYTICS MARKET, BY APPLICATION, 2021-2031 ($MILLION)
- TABLE 111. AUSTRALIA CONNECTED DEVICE ANALYTICS MARKET, BY INDUSTRY VERTICAL, 2021-2031 ($MILLION)
- TABLE 112. REST OF ASIA-PACIFIC CONNECTED DEVICE ANALYTICS MARKET, BY COMPONENT, 2021-2031 ($MILLION)
- TABLE 113. REST OF ASIA-PACIFIC CONNECTED DEVICE ANALYTICS MARKET, BY ENTERPRISE SIZE, 2021-2031 ($MILLION)
- TABLE 114. REST OF ASIA-PACIFIC CONNECTED DEVICE ANALYTICS MARKET, BY DEPLOYMENT MODEL, 2021-2031 ($MILLION)
- TABLE 115. REST OF ASIA-PACIFIC CONNECTED DEVICE ANALYTICS MARKET, BY APPLICATION, 2021-2031 ($MILLION)
- TABLE 116. REST OF ASIA-PACIFIC CONNECTED DEVICE ANALYTICS MARKET, BY INDUSTRY VERTICAL, 2021-2031 ($MILLION)
- TABLE 117. LAMEA CONNECTED DEVICE ANALYTICS MARKET, BY COMPONENT, 2021-2031 ($MILLION)
- TABLE 118. LAMEA CONNECTED DEVICE ANALYTICS MARKET, BY ENTERPRISE SIZE, 2021-2031 ($MILLION)
- TABLE 119. LAMEA CONNECTED DEVICE ANALYTICS MARKET, BY DEPLOYMENT MODEL, 2021-2031 ($MILLION)
- TABLE 120. LAMEA CONNECTED DEVICE ANALYTICS MARKET, BY APPLICATION, 2021-2031 ($MILLION)
- TABLE 121. LAMEA CONNECTED DEVICE ANALYTICS MARKET, BY INDUSTRY VERTICAL, 2021-2031 ($MILLION)
- TABLE 122. LAMEA CONNECTED DEVICE ANALYTICS MARKET, BY COUNTRY, 2021-2031 ($MILLION)
- TABLE 123. LATIN AMERICA CONNECTED DEVICE ANALYTICS MARKET, BY COMPONENT, 2021-2031 ($MILLION)
- TABLE 124. LATIN AMERICA CONNECTED DEVICE ANALYTICS MARKET, BY ENTERPRISE SIZE, 2021-2031 ($MILLION)
- TABLE 125. LATIN AMERICA CONNECTED DEVICE ANALYTICS MARKET, BY DEPLOYMENT MODEL, 2021-2031 ($MILLION)
- TABLE 126. LATIN AMERICA CONNECTED DEVICE ANALYTICS MARKET, BY APPLICATION, 2021-2031 ($MILLION)
- TABLE 127. LATIN AMERICA CONNECTED DEVICE ANALYTICS MARKET, BY INDUSTRY VERTICAL, 2021-2031 ($MILLION)
- TABLE 128. MIDDLE EAST CONNECTED DEVICE ANALYTICS MARKET, BY COMPONENT, 2021-2031 ($MILLION)
- TABLE 129. MIDDLE EAST CONNECTED DEVICE ANALYTICS MARKET, BY ENTERPRISE SIZE, 2021-2031 ($MILLION)
- TABLE 130. MIDDLE EAST CONNECTED DEVICE ANALYTICS MARKET, BY DEPLOYMENT MODEL, 2021-2031 ($MILLION)
- TABLE 131. MIDDLE EAST CONNECTED DEVICE ANALYTICS MARKET, BY APPLICATION, 2021-2031 ($MILLION)
- TABLE 132. MIDDLE EAST CONNECTED DEVICE ANALYTICS MARKET, BY INDUSTRY VERTICAL, 2021-2031 ($MILLION)
- TABLE 133. AFRICA CONNECTED DEVICE ANALYTICS MARKET, BY COMPONENT, 2021-2031 ($MILLION)
- TABLE 134. AFRICA CONNECTED DEVICE ANALYTICS MARKET, BY ENTERPRISE SIZE, 2021-2031 ($MILLION)
- TABLE 135. AFRICA CONNECTED DEVICE ANALYTICS MARKET, BY DEPLOYMENT MODEL, 2021-2031 ($MILLION)
- TABLE 136. AFRICA CONNECTED DEVICE ANALYTICS MARKET, BY APPLICATION, 2021-2031 ($MILLION)
- TABLE 137. AFRICA CONNECTED DEVICE ANALYTICS MARKET, BY INDUSTRY VERTICAL, 2021-2031 ($MILLION)
- TABLE 138. MICROSOFT CORPORATION: KEY EXECUTIVES
- TABLE 139. MICROSOFT CORPORATION: COMPANY SNAPSHOT
- TABLE 140. MICROSOFT CORPORATION: SERVICE SEGMENTS
- TABLE 141. MICROSOFT CORPORATION: PRODUCT PORTFOLIO
- TABLE 142. MICROSOFT CORPORATION: KEY STRATERGIES
- TABLE 143. ORACLE CORPORATION: KEY EXECUTIVES
- TABLE 144. ORACLE CORPORATION: COMPANY SNAPSHOT
- TABLE 145. ORACLE CORPORATION: PRODUCT SEGMENTS
- TABLE 146. ORACLE CORPORATION: PRODUCT PORTFOLIO
- TABLE 147. ORACLE CORPORATION: KEY STRATERGIES
- TABLE 148. SAP SE: KEY EXECUTIVES
- TABLE 149. SAP SE: COMPANY SNAPSHOT
- TABLE 150. SAP SE: SERVICE SEGMENTS
- TABLE 151. SAP SE: PRODUCT PORTFOLIO
- TABLE 152. SAP SE: KEY STRATERGIES
- TABLE 153. IBM CORPORATION: KEY EXECUTIVES
- TABLE 154. IBM CORPORATION: COMPANY SNAPSHOT
- TABLE 155. IBM CORPORATION: SERVICE SEGMENTS
- TABLE 156. IBM CORPORATION: PRODUCT PORTFOLIO
- TABLE 157. IBM CORPORATION: KEY STRATERGIES
- TABLE 158. AMAZON WEB SERVICES INC.: KEY EXECUTIVES
- TABLE 159. AMAZON WEB SERVICES INC.: COMPANY SNAPSHOT
- TABLE 160. AMAZON WEB SERVICES INC.: SERVICE SEGMENTS
- TABLE 161. AMAZON WEB SERVICES INC.: PRODUCT PORTFOLIO
- TABLE 162. AMAZON WEB SERVICES INC.: KEY STRATERGIES
- TABLE 163. CISCO SYSTEMS INC.: KEY EXECUTIVES
- TABLE 164. CISCO SYSTEMS INC.: COMPANY SNAPSHOT
- TABLE 165. CISCO SYSTEMS INC.: SERVICE SEGMENTS
- TABLE 166. CISCO SYSTEMS INC.: PRODUCT PORTFOLIO
- TABLE 167. CISCO SYSTEMS INC.: KEY STRATERGIES
- TABLE 168. GOOGLE LLC: KEY EXECUTIVES
- TABLE 169. GOOGLE LLC: COMPANY SNAPSHOT
- TABLE 170. GOOGLE LLC: SERVICE SEGMENTS
- TABLE 171. GOOGLE LLC: PRODUCT PORTFOLIO
- TABLE 172. GOOGLE LLC: KEY STRATERGIES
- TABLE 173. ADOBE: KEY EXECUTIVES
- TABLE 174. ADOBE: COMPANY SNAPSHOT
- TABLE 175. ADOBE: SERVICE SEGMENTS
- TABLE 176. ADOBE: PRODUCT PORTFOLIO
- TABLE 177. ADOBE: KEY STRATERGIES
- TABLE 178. TERADATA CORPORATION: KEY EXECUTIVES
- TABLE 179. TERADATA CORPORATION: COMPANY SNAPSHOT
- TABLE 180. TERADATA CORPORATION: SERVICE SEGMENTS
- TABLE 181. TERADATA CORPORATION: PRODUCT PORTFOLIO
- TABLE 182. TERADATA CORPORATION: KEY STRATERGIES
- TABLE 183. HITACHI LTD.: KEY EXECUTIVES
- TABLE 184. HITACHI LTD.: COMPANY SNAPSHOT
- TABLE 185. HITACHI LTD.: SERVICE SEGMENTS
- TABLE 186. HITACHI LTD.: PRODUCT PORTFOLIO
- TABLE 187. HITACHI LTD.: KEY STRATERGIES
LIST OF FIGURES
- FIGURE 01. CONNECTED DEVICE ANALYTICS MARKET, 2021-2031
- FIGURE 02. SEGMENTATION OF CONNECTED DEVICE ANALYTICS MARKET, 2021-2031
- FIGURE 03. TOP INVESTMENT POCKETS IN CONNECTED DEVICE ANALYTICS MARKET (2022-2031)
- FIGURE 04. LOW BARGAINING POWER OF SUPPLIERS
- FIGURE 05. LOW BARGAINING POWER OF BUYERS
- FIGURE 06. LOW THREAT OF SUBSTITUTES
- FIGURE 07. LOW THREAT OF NEW ENTRANTS
- FIGURE 08. LOW INTENSITY OF RIVALRY
- FIGURE 09. DRIVERS, RESTRAINTS AND OPPORTUNITIES: GLOBALCONNECTED DEVICE ANALYTICS MARKET
- FIGURE 10. CONNECTED DEVICE ANALYTICS MARKET, BY COMPONENT, 2021(%)
- FIGURE 11. COMPARATIVE SHARE ANALYSIS OF CONNECTED DEVICE ANALYTICS MARKET FOR SOLUTION, BY COUNTRY 2021 AND 2031(%)
- FIGURE 12. COMPARATIVE SHARE ANALYSIS OF CONNECTED DEVICE ANALYTICS MARKET FOR SERVICE, BY COUNTRY 2021 AND 2031(%)
- FIGURE 13. CONNECTED DEVICE ANALYTICS MARKET, BY ENTERPRISE SIZE, 2021(%)
- FIGURE 14. COMPARATIVE SHARE ANALYSIS OF CONNECTED DEVICE ANALYTICS MARKET FOR LARGE ENTERPRISE, BY COUNTRY 2021 AND 2031(%)
- FIGURE 15. COMPARATIVE SHARE ANALYSIS OF CONNECTED DEVICE ANALYTICS MARKET FOR SMES, BY COUNTRY 2021 AND 2031(%)
- FIGURE 16. CONNECTED DEVICE ANALYTICS MARKET, BY DEPLOYMENT MODEL, 2021(%)
- FIGURE 17. COMPARATIVE SHARE ANALYSIS OF CONNECTED DEVICE ANALYTICS MARKET FOR ON-PREMISE, BY COUNTRY 2021 AND 2031(%)
- FIGURE 18. COMPARATIVE SHARE ANALYSIS OF CONNECTED DEVICE ANALYTICS MARKET FOR CLOUD, BY COUNTRY 2021 AND 2031(%)
- FIGURE 19. CONNECTED DEVICE ANALYTICS MARKET, BY APPLICATION, 2021(%)
- FIGURE 20. COMPARATIVE SHARE ANALYSIS OF CONNECTED DEVICE ANALYTICS MARKET FOR SALES AND CUSTOMER MANAGEMENT, BY COUNTRY 2021 AND 2031(%)
- FIGURE 21. COMPARATIVE SHARE ANALYSIS OF CONNECTED DEVICE ANALYTICS MARKET FOR SECURITY AND EMERGENCY MANAGEMENT, BY COUNTRY 2021 AND 2031(%)
- FIGURE 22. COMPARATIVE SHARE ANALYSIS OF CONNECTED DEVICE ANALYTICS MARKET FOR REMOTE MONITORING, BY COUNTRY 2021 AND 2031(%)
- FIGURE 23. COMPARATIVE SHARE ANALYSIS OF CONNECTED DEVICE ANALYTICS MARKET FOR PREDECTIVE MAINTAINCE AND ASSET MANAGEMENT, BY COUNTRY 2021 AND 2031(%)
- FIGURE 24. COMPARATIVE SHARE ANALYSIS OF CONNECTED DEVICE ANALYTICS MARKET FOR INVENTORY MANAGEMENT, BY COUNTRY 2021 AND 2031(%)
- FIGURE 25. COMPARATIVE SHARE ANALYSIS OF CONNECTED DEVICE ANALYTICS MARKET FOR ENERGY MANAGEMENT, BY COUNTRY 2021 AND 2031(%)
- FIGURE 26. COMPARATIVE SHARE ANALYSIS OF CONNECTED DEVICE ANALYTICS MARKET FOR BUILDING AUTOMATION, BY COUNTRY 2021 AND 2031(%)
- FIGURE 27. COMPARATIVE SHARE ANALYSIS OF CONNECTED DEVICE ANALYTICS MARKET FOR OTHERS, BY COUNTRY 2021 AND 2031(%)
- FIGURE 28. CONNECTED DEVICE ANALYTICS MARKET, BY INDUSTRY VERTICAL, 2021(%)
- FIGURE 29. COMPARATIVE SHARE ANALYSIS OF CONNECTED DEVICE ANALYTICS MARKET FOR MANUFACTURING, BY COUNTRY 2021 AND 2031(%)
- FIGURE 30. COMPARATIVE SHARE ANALYSIS OF CONNECTED DEVICE ANALYTICS MARKET FOR TRANSPORT AND LOGISTICS, BY COUNTRY 2021 AND 2031(%)
- FIGURE 31. COMPARATIVE SHARE ANALYSIS OF CONNECTED DEVICE ANALYTICS MARKET FOR ENERGY AND UTILITIES, BY COUNTRY 2021 AND 2031(%)
- FIGURE 32. COMPARATIVE SHARE ANALYSIS OF CONNECTED DEVICE ANALYTICS MARKET FOR RETAIL AND ECOMMERCE, BY COUNTRY 2021 AND 2031(%)
- FIGURE 33. COMPARATIVE SHARE ANALYSIS OF CONNECTED DEVICE ANALYTICS MARKET FOR BFSI, BY COUNTRY 2021 AND 2031(%)
- FIGURE 34. COMPARATIVE SHARE ANALYSIS OF CONNECTED DEVICE ANALYTICS MARKET FOR HEALTH AND LIFE SCIENCE, BY COUNTRY 2021 AND 2031(%)
- FIGURE 35. COMPARATIVE SHARE ANALYSIS OF CONNECTED DEVICE ANALYTICS MARKET FOR GOVERNMENT AND DEFENSE, BY COUNTRY 2021 AND 2031(%)
- FIGURE 36. COMPARATIVE SHARE ANALYSIS OF CONNECTED DEVICE ANALYTICS MARKET FOR OTHERS, BY COUNTRY 2021 AND 2031(%)
- FIGURE 37. CONNECTED DEVICE ANALYTICS MARKET BY REGION, 2021
- FIGURE 38. U.S. CONNECTED DEVICE ANALYTICS MARKET, 2021-2031 ($MILLION)
- FIGURE 39. CANADA CONNECTED DEVICE ANALYTICS MARKET, 2021-2031 ($MILLION)
- FIGURE 40. UK CONNECTED DEVICE ANALYTICS MARKET, 2021-2031 ($MILLION)
- FIGURE 41. GERMANY CONNECTED DEVICE ANALYTICS MARKET, 2021-2031 ($MILLION)
- FIGURE 42. FRANCE CONNECTED DEVICE ANALYTICS MARKET, 2021-2031 ($MILLION)
- FIGURE 43. SPAIN CONNECTED DEVICE ANALYTICS MARKET, 2021-2031 ($MILLION)
- FIGURE 44. ITALY CONNECTED DEVICE ANALYTICS MARKET, 2021-2031 ($MILLION)
- FIGURE 45. REST OF EUROPE CONNECTED DEVICE ANALYTICS MARKET, 2021-2031 ($MILLION)
- FIGURE 46. CHINA CONNECTED DEVICE ANALYTICS MARKET, 2021-2031 ($MILLION)
- FIGURE 47. JAPAN CONNECTED DEVICE ANALYTICS MARKET, 2021-2031 ($MILLION)
- FIGURE 48. SOUTH KOREA CONNECTED DEVICE ANALYTICS MARKET, 2021-2031 ($MILLION)
- FIGURE 49. INDIA CONNECTED DEVICE ANALYTICS MARKET, 2021-2031 ($MILLION)
- FIGURE 50. AUSTRALIA CONNECTED DEVICE ANALYTICS MARKET, 2021-2031 ($MILLION)
- FIGURE 51. REST OF ASIA-PACIFIC CONNECTED DEVICE ANALYTICS MARKET, 2021-2031 ($MILLION)
- FIGURE 52. LATIN AMERICA CONNECTED DEVICE ANALYTICS MARKET, 2021-2031 ($MILLION)
- FIGURE 53. MIDDLE EAST CONNECTED DEVICE ANALYTICS MARKET, 2021-2031 ($MILLION)
- FIGURE 54. AFRICA CONNECTED DEVICE ANALYTICS MARKET, 2021-2031 ($MILLION)
- FIGURE 55. TOP WINNING STRATEGIES, BY YEAR
- FIGURE 56. TOP WINNING STRATEGIES, BY DEVELOPMENT
- FIGURE 57. TOP WINNING STRATEGIES, BY COMPANY
- FIGURE 58. PRODUCT MAPPING OF TOP 10 PLAYERS
- FIGURE 59. COMPETITIVE DASHBOARD
- FIGURE 60. COMPETITIVE HEATMAP: CONNECTED DEVICE ANALYTICS MARKET
- FIGURE 61. TOP PLAYER POSITIONING, 2021
- FIGURE 62. MICROSOFT CORPORATION: NET REVENUE, 2020-2022 ($BILLION)
- FIGURE 63. MICROSOFT CORPORATION: RESEARCH & DEVELOPMENT EXPENDITURE, 2020-2022 ($BILLION)
- FIGURE 64. MICROSOFT CORPORATION: REVENUE SHARE BY SEGMENT, 2022 (%)
- FIGURE 65. MICROSOFT CORPORATION: REVENUE SHARE BY REGION, 2022 (%)
- FIGURE 66. ORACLE CORPORATION: NET REVENUE, 2020-2022 ($MILLION)
- FIGURE 67. ORACLE CORPORATION: RESEARCH & DEVELOPMENT EXPENDITURE, 2020-2022 ($MILLION)
- FIGURE 68. ORACLE CORPORATION: REVENUE SHARE BY SEGMENT, 2022 (%)
- FIGURE 69. ORACLE CORPORATION: REVENUE SHARE BY REGION, 2022 (%)
- FIGURE 70. SAP SE: NET REVENUE, 2020-2022 ($MILLION)
- FIGURE 71. SAP SE: RESEARCH & DEVELOPMENT EXPENDITURE, 2020-2022 ($MILLION)
- FIGURE 72. SAP SE: REVENUE SHARE BY SEGMENT, 2022 (%)
- FIGURE 73. SAP SE: REVENUE SHARE BY REGION, 2022 (%)
- FIGURE 74. IBM CORPORATION: NET REVENUE, 2020-2022 ($MILLION)
- FIGURE 75. IBM CORPORATION: RESEARCH & DEVELOPMENT EXPENDITURE, 2019-2021
- FIGURE 76. IBM CORPORATION: REVENUE SHARE BY REGION, 2022 (%)
- FIGURE 77. IBM CORPORATION: REVENUE SHARE BY SEGMENT, 2022 (%)
- FIGURE 78. AMAZON WEB SERVICES INC.: NET SALES, 2019-2021 ($MILLION)
- FIGURE 79. AMAZON WEB SERVICES INC.: REVENUE SHARE BY SEGMENT, 2021 (%)
- FIGURE 80. AMAZON WEB SERVICES INC.: REVENUE SHARE BY REGION, 2021 (%)
- FIGURE 81. CISCO SYSTEMS INC.: NET REVENUE, 2019-2021 ($MILLION)
- FIGURE 82. CISCO SYSTEMS INC.: RESEARCH & DEVELOPMENT EXPENDITURE, 2019-2021 ($MILLION)
- FIGURE 83. CISCO SYSTEMS INC.: REVENUE SHARE BY SEGMENT, 2021 (%)
- FIGURE 84. CISCO SYSTEMS INC.: REVENUE SHARE BY REGION, 2021 (%)
- FIGURE 85. GOOGLE LLC: NET REVENUE, 2019-2021 ($MILLION)
- FIGURE 86. GOOGLE LLC: REVENUE SHARE BY SEGMENT, 2021 (%)
- FIGURE 87. GOOGLE LLC: REVENUE SHARE BY REGION, 2021 (%)
- FIGURE 88. ADOBE: NET REVENUE, 2019-2021 ($MILLION)
- FIGURE 89. ADOBE: RESEARCH & DEVELOPMENT EXPENDITURE, 2019-2021 ($MILLION)
- FIGURE 90. ADOBE: REVENUE SHARE BY SEGMENT, 2021 (%)
- FIGURE 91. ADOBE: REVENUE SHARE BY REGION, 2021 (%)
- FIGURE 92. TERADATA CORPORATION: NET REVENUE, 2019-2021 ($MILLION)
- FIGURE 93. TERADATA CORPORATION: RESEARCH & DEVELOPMENT EXPENDITURE, 2019-2021 ($MILLION)
- FIGURE 94. TERADATA CORPORATION: REVENUE SHARE BY REGION, 2021 (%)
- FIGURE 95. TERADATA CORPORATION: REVENUE SHARE BY SEGMENT, 2020 (%)
- FIGURE 96. HITACHI LTD.: NET REVENUE, 2019-2021 ($MILLION)
- FIGURE 97. HITACHI LTD.: RESEARCH & DEVELOPMENT EXPENDITURE, 2019-2021
- FIGURE 98. HITACHI LTD.: REVENUE SHARE BY SEGMENT, 2021 (%)


