


 |
市場調查報告書
商品編碼
1298234
基因組學中的人工智能市場:按產品、技術、應用、最終用戶劃分:2021-2031 年全球機遇分析和行業預測AI in Genomics Market By Offering, By Technology, By Application, By End User : Global Opportunity Analysis and Industry Forecast, 2021-2031 |
||||||
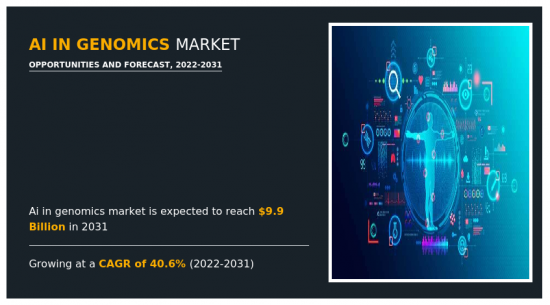
2021 年,基因組學領域人工智能的全球市場價值為 3.4 億美元,預計 2022 年至 2031 年復合年增長率為 40.6%,到 □□2031 年將達到 99 億美元。
基因組學是分子生物學的一個分支,專注於研究生物體的整個遺傳物質 (DNA)。 我們分析基因組結構、功能和進化,以揭示基因、它們的調控元件以及它們如何相互作用。 近幾十年來,由於技術進步使得更快速、更準確地對 DNA 進行測序成為可能,基因組學領域發展迅速。 高通量測序技術的出現使得以以前所需成本和時間的一小部分對整個基因組進行測序成為可能。 基因組學領域的AI市場是指利用人工智能(AI)技術支持基因組研究和應用。 隨著大量基因組數據的產生,用於分析和解釋這些數據的人工智能工具變得越來越重要。
基因組學市場人工智能的驅動力是人工智能技術的進步、對個性化醫療的需求不斷增加、基因組學在研究和醫療保健中的採用增加以及對基因組學人工智能的投資增加。 人工智能技術的進步是機器學習、自然語言處理和深度學習研究和開發的結果,使研究人員能夠更準確、更有效地分析和解釋基因組數據。 隨著人工智能技術的不斷進步,其在基因組學中的應用預計將變得更加廣泛。 個性化醫療利用基因組數據為個體患者量身定制治療計劃。 隨著個性化醫療的需求不斷增長,在基因組學中使用人工智能工具對於識別可能與患者疾病和狀況相關的遺傳變異變得越來越重要。 例如,根據國家醫學圖書館 2022 年的一份報告,除了阿爾茨海默病之外,炎症性疾病類風濕性關節炎和牛皮癬也與疾病機制、診斷生物標誌物、使用診斷標誌物的治療藥物以及治療滿意度有關。從角度來看,這是一種個性化醫療需求未得到滿足的疾病。
此外,基因組學在研究和醫療保健中已成為越來越重要的工具,因為它為疾病和其他病症的遺傳基礎提供了重要的見解。 因此,需要更先進的人工智能工具和技術來分析和解釋基因組數據。 然而,高成本的數據質量問題和熟練專家的有限等因素預計將限制基因組學市場中人工智能的增長。
內容
第一章簡介
第 2 章執行摘要
第三章市場概述
- 市場定義和範圍
- 主要發現
- 影響因素
- 主要投資領域
- 波特五力分析
- 供應商的議價能力
- 買家的議價能力
- 替代品的威脅
- 新進入者的威脅
- 競爭強度
- 市場動態
- 驅動程序
- 人工智能技術的進步
- 基因組學在研究和醫療保健領域的應用不斷增加
- 個性化醫療需求增加
- 制約因素
- 缺乏熟練的專業人員
- 數據質量問題
- 機會
- 具有人類意識的人工智能開發
- 驅動程序
- COVID-19 對市場的影響分析
第 4 章基因組學中的人工智能市場:通過提供
- 概述
- 市場規模和預測
- 硬件
- 主要市場趨勢、增長因素和增長機會
- 市場規模/預測:按地區劃分
- 市場份額分析:按國家/地區劃分
- 軟件
- 主要市場趨勢、增長因素和機遇
- 市場規模和預測:按地區劃分
- 市場份額分析:按國家/地區劃分
- 服務
- 主要市場趨勢、增長因素和機遇
- 市場規模和預測:按地區劃分
- 市場份額分析:按國家/地區劃分
第五章基因組學中的人工智能市場:按技術劃分
- 概述
- 市場規模和預測
- 機器學習
- 主要市場趨勢、增長因素、增長機會
- 市場規模和預測:按地區劃分
- 市場份額分析:按國家/地區劃分
- 計算機視覺
- 主要市場趨勢、增長因素和機遇
- 市場規模和預測:按地區劃分
- 市場份額分析:按國家/地區劃分
第 6 章:基因組學中的人工智能市場:按應用分類
- 概述
- 市場規模和預測
- 藥物發現和藥物開發
- 主要市場趨勢、增長因素、增長機會
- 市場規模和預測:按地區劃分
- 市場份額分析:按國家/地區劃分
- 精準醫療
- 主要市場趨勢、增長動力和機遇
- 市場規模和預測:按地區劃分
- 市場份額分析:按國家/地區劃分
- 診斷
- 主要市場趨勢、增長因素和機遇
- 市場規模和預測:按地區劃分
- 市場份額分析:按國家/地區劃分
- 其他
- 主要市場趨勢、增長因素和機遇
- 市場規模和預測:按地區劃分
- 市場份額分析:按國家/地區劃分
第 7 章:基因組學中的人工智能市場:最終用戶
- 概述
- 市場規模和預測
- 製藥和生物技術公司
- 主要市場趨勢、增長因素、增長機會
- 市場規模和預測:按地區劃分
- 市場份額分析:按國家/地區劃分
- 醫療保健提供者
- 主要市場趨勢、增長動力和機遇
- 市場規模和預測:按地區劃分
- 市場份額分析:按國家/地區劃分
- 研究中心
- 主要市場趨勢、增長動力和機遇
- 市場規模和預測:按地區劃分
- 市場份額分析:按國家/地區劃分
第 8 章基因組學中的人工智能市場:按地區
- 概述
- 市場規模/預測:按地區劃分
- 北美
- 主要趨勢和機遇
- 市場規模/預測:按產品劃分
- 市場規模/預測:按技術劃分
- 市場規模和預測:按應用分類
- 市場規模和預測:按最終用戶劃分
- 市場規模/預測:按國家/地區劃分
- 美國
- 主要市場趨勢、增長因素、增長機會
- 市場規模/預測:按產品劃分
- 市場規模/預測:按技術劃分
- 市場規模和預測:按應用分類
- 市場規模和預測:按最終用戶劃分
- 加拿大
- 主要市場趨勢、增長因素、增長機會
- 市場規模/預測:按產品劃分
- 市場規模/預測:按技術劃分
- 市場規模和預測:按應用分類
- 市場規模和預測:按最終用戶劃分
- 墨西哥
- 主要市場趨勢、增長因素、增長機會
- 市場規模/預測:按產品分類
- 市場規模/預測:按技術劃分
- 市場規模和預測:按應用分類
- 市場規模和預測:按最終用戶劃分
- 歐洲
- 主要趨勢和機遇
- 市場規模/預測:按產品劃分
- 市場規模/預測:按技術劃分
- 市場規模和預測:按應用分類
- 市場規模和預測:按最終用戶劃分
- 市場規模/預測:按國家/地區劃分
- 德國
- 主要市場趨勢、增長因素、增長機會
- 市場規模/預測:按產品劃分
- 市場規模/預測:按技術劃分
- 市場規模和預測:按應用分類
- 市場規模和預測:按最終用戶劃分
- 法國
- 主要市場趨勢、增長因素、增長機會
- 市場規模/預測:按產品劃分
- 市場規模/預測:按技術劃分
- 市場規模和預測:按應用分類
- 市場規模和預測:按最終用戶劃分
- 英國
- 主要市場趨勢、增長因素、增長機會
- 市場規模/預測:按產品劃分
- 市場規模/預測:按技術劃分
- 市場規模和預測:按應用分類
- 市場規模和預測:按最終用戶劃分
- 意大利
- 主要市場趨勢、增長因素、增長機會
- 市場規模/預測:按產品分類
- 市場規模/預測:按技術劃分
- 市場規模和預測:按應用分類
- 市場規模和預測:按最終用戶劃分
- 西班牙
- 主要市場趨勢、增長因素、增長機會
- 市場規模/預測:按產品劃分
- 市場規模/預測:按技術劃分
- 市場規模和預測:按應用分類
- 市場規模和預測:按最終用戶劃分
- 歐洲其他地區
- 主要市場趨勢、增長因素、增長機會
- 市場規模/預測:按產品劃分
- 市場規模/預測:按技術劃分
- 市場規模和預測:按應用分類
- 市場規模和預測:按最終用戶劃分
- 亞太地區
- 主要趨勢和機遇
- 市場規模/預測:按產品劃分
- 市場規模/預測:按技術劃分
- 市場規模和預測:按應用分類
- 市場規模和預測:按最終用戶劃分
- 市場規模/預測:按國家/地區劃分
- 日本
- 主要市場趨勢、增長因素、增長機會
- 市場規模/預測:按產品分類
- 市場規模/預測:按技術劃分
- 市場規模和預測:按應用分類
- 市場規模和預測:按最終用戶劃分
- 中國
- 主要市場趨勢、增長因素、增長機會
- 市場規模/預測:按產品分類
- 市場規模/預測:按技術劃分
- 市場規模和預測:按應用分類
- 市場規模和預測:按最終用戶劃分
- 澳大利亞
- 主要市場趨勢、增長因素、增長機會
- 市場規模/預測:按產品劃分
- 市場規模/預測:按技術劃分
- 市場規模和預測:按應用分類
- 市場規模和預測:按最終用戶劃分
- 印度市場
- 主要市場趨勢、增長因素、增長機會
- 市場規模/預測:按產品分類
- 市場規模/預測:按技術劃分
- 市場規模和預測:按應用分類
- 市場規模和預測:按最終用戶劃分
- 韓國市場
- 主要市場趨勢、增長因素、增長機會
- 市場規模/預測:按產品劃分
- 市場規模/預測:按技術劃分
- 市場規模和預測:按應用分類
- 市場規模和預測:按最終用戶劃分
- 亞太地區其他地區
- 主要市場趨勢、增長因素、增長機會
- 市場規模和預測:產品按組
- 市場規模/預測:按技術劃分
- 市場規模和預測:按應用分類
- 市場規模和預測:按最終用戶劃分
- 拉丁美洲/中東/非洲
- 主要趨勢和機遇
- 市場規模/預測:按產品劃分
- 市場規模/預測:按技術劃分
- 市場規模和預測:按應用分類
- 市場規模和預測:按最終用戶劃分
- 市場規模/預測:按國家/地區劃分
- 巴西
- 主要市場趨勢、增長因素、增長機會
- 市場規模/預測:按產品劃分
- 市場規模/預測:按技術劃分
- 市場規模和預測:按應用分類
- 市場規模和預測:按最終用戶劃分
- 沙特阿拉伯
- 主要市場趨勢、增長因素、增長機會
- 市場規模/預測:按產品劃分
- 市場規模/預測:按技術劃分
- 市場規模和預測:按應用分類
- 市場規模和預測:按最終用戶劃分
- 南非
- 主要市場趨勢、增長因素、增長機會
- 市場規模/預測:按產品劃分
- 市場規模/預測:按技術劃分
- 市場規模和預測:按應用分類
- 市場規模和預測:按最終用戶劃分
- 其他地區
- 主要市場趨勢、增長因素、增長機會
- 市場規模/預測:按產品劃分
- 市場規模/預測:按技術劃分
- 市場規模和預測:按應用分類
- 市場規模和預測:按最終用戶劃分
第 9 章競爭格局
- 簡介
- 關鍵成功策略
- 10家主要公司的產品圖譜
- 競賽儀表板
- 比賽熱圖
- 主要企業定位(2021年)
第 10 章公司簡介
- Microsoft Corporation
- IBM Corporation
- NVIDIA Corporation(Mellanox Technologies)
- Deep Genomics
- Data4Cure, Inc
- Freenome Holdings, Inc
- Thermo Fisher Scientific Inc.
- Illumina, Inc.
- Sophia Genetics
- BenevolentAI
The global AI in genomics market was valued at $ 0.34 billion in 2021 and is projected to reach $9.9 billion by 2031, growing at a CAGR of 40.6% from 2022 to 2031.
Genomics is a branch of molecular biology that focuses on the study of the entire genetic material (DNA) of organisms. It involves the analysis of the structure, function, and evolution of genomes, including the identification of genes, their regulatory elements, and how they interact with each other. The field of genomics has grown rapidly over the last few decades due to advances in technology that have made it possible to sequence and analyze DNA more quickly and accurately. With the advent of high-throughput sequencing technologies, it is now possible to sequence entire genomes at a fraction of the cost and time that used to be required earlier. AI in the genomics market refers to the use of artificial intelligence (AI) technologies to support genomic research and applications. With the vast amount of genomic data being generated, AI tools have become increasingly important for analyzing and interpreting this data
The driving factors for AI in the genomics market are advancements in AI technologies, growth in demand for personalized medicine, increase in adoption of genomics in research and healthcare, and rise in investment in AI in genomics. Advancements in AI technologies are the result of the development of machine learning, natural language processing, and deep learning has enabled researchers to analyze and interpret genomic data more accurately and efficiently. As AI technologies continue to improve, their application in genomics is expected to become even more widespread. Personalized medicine involves developing treatment plans tailored to individual patients based on their genomic data. As the demand for personalized medicine continues to grow, the use of AI tools in genomics is becoming increasingly important for identifying genetic variations that may be relevant to a patient's disease or condition. For instance, according to the 2022 report by National Library for Medicine, rheumatoid arthritis and psoriasis as the inflammatory disease, in addition to Alzheimer's disease are diseases having high unmet needs for personalized medicine from the viewpoints of disease mechanisms, diagnostic biomarkers, therapeutic drugs with diagnostic markers and treatment satisfaction.
Furthermore, genomics is becoming an increasingly important tool in both research and healthcare, as it provides important insights into the genetic basis of diseases and other conditions. This is driving the need for more advanced AI tools and technologies to analyze and interpret genomic data. However, factors such as high-cost data quality issues and limited availability of skilled professionals are expected to restrain the growth of AI in the genomics market.
The AI in the genomics market is segmented into offering, technology, application, end-user, and region. Based on offering, the market is segmented into software, services and hardware. By technology, the market is segmented into machine learning and computer vision. By application, the market is segmented into drug discovery & development, precision medicine, diagnostics, and others. By end user, the market is segmented into pharmaceutical and biotech companies, healthcare providers, research centers, and others. Region-wise, the market is analyzed across North America (the U.S., Canada, and Mexico), Europe (Germany, France, the UK, Italy, Spain, and the rest of Europe), Asia-Pacific (Japan, China, Australia, India, South Korea, and rest of Asia-Pacific), and LAMEA (Brazil, South Africa, Saudi Arabia, and rest of LAMEA).
Major key players that operate in the AI in genomics market are: Microsoft, IBM, NVIDIA Corporation, Deep Genomics, DATA4CURE, INC, Freenome holdings, Inc, Thermo fisher scientific, Illumina, Inc., Sophia Genetics, and BenevolentAI.
Key Benefits For Stakeholders
- This report provides a quantitative analysis of the market segments, current trends, estimations, and dynamics of the ai in genomics market analysis from 2021 to 2031 to identify the prevailing ai in genomics market opportunities.
- Market research is offered along with information related to key drivers, restraints, and opportunities.
- Porter's five forces analysis highlights the potency of buyers and suppliers to enable stakeholders make profit-oriented business decisions and strengthen their supplier-buyer network.
- An in-depth analysis of the ai in genomics market segmentation assists to determine the prevailing market opportunities.
- Major countries in each region are mapped according to their revenue contribution to the global market.
- Market player positioning facilitates benchmarking and provides a clear understanding of the present position of the market players.
- The report includes analysis of the regional as well as global ai in genomics market trends, key players, market segments, application areas, and market growth strategies.
Key Market Segments
By Technology
- Machine Learning
- Computer Vision
By Offering
- Hardware
- Software
- Services
By Application
- Drug Discovery and Development
- Precision Medicine
- Diagnostics
- Others
By End User
- Pharmaceutical and Biotech Companies
- Healthcare Providers
- Research Centers
By Region
- North America
- U.S.
- Canada
- Mexico
- Europe
- Germany
- France
- UK
- Italy
- Spain
- Rest of Europe
- Asia-Pacific
- Japan
- China
- Australia
- India
- South Korea
- Rest of Asia-Pacific
- LAMEA
- Brazil
- Saudi Arabia
- South Africa
- Rest of LAMEA
Key Market Players:
- IBM Corporation
- Deep Genomics
- Thermo Fisher Scientific Inc.
- Illumina, Inc.
- Data4Cure, Inc
- BenevolentAI
- Microsoft Corporation
- NVIDIA Corporation (Mellanox Technologies)
- Sophia Genetics
- Freenome Holdings, Inc
TABLE OF CONTENTS
CHAPTER 1: INTRODUCTION
- 1.1. Report description
- 1.2. Key market segments
- 1.3. Key benefits to the stakeholders
- 1.4. Research Methodology
- 1.4.1. Primary research
- 1.4.2. Secondary research
- 1.4.3. Analyst tools and models
CHAPTER 2: EXECUTIVE SUMMARY
- 2.1. CXO Perspective
CHAPTER 3: MARKET OVERVIEW
- 3.1. Market definition and scope
- 3.2. Key findings
- 3.2.1. Top impacting factors
- 3.2.2. Top investment pockets
- 3.3. Porter's five forces analysis
- 3.3.1. Bargaining power of suppliers
- 3.3.2. Bargaining power of buyers
- 3.3.3. Threat of substitutes
- 3.3.4. Threat of new entrants
- 3.3.5. Intensity of rivalry
- 3.4. Market dynamics
- 3.4.1. Drivers
- 3.4.1.1. Advancements in AI technologies
- 3.4.1.2. Rising adoption of genomics in research and healthcare
- 3.4.1.3. Increase ing demand for personalized medicine
- 3.4.1. Drivers
- 3.4.2. Restraints
- 3.4.2.1. Limited availability of skilled professionals
- 3.4.2.2. Data quality issues
- 3.4.3. Opportunities
- 3.4.3.1. Development of human aware AI
- 3.5. COVID-19 Impact Analysis on the market
CHAPTER 4: AI IN GENOMICS MARKET, BY OFFERING
- 4.1. Overview
- 4.1.1. Market size and forecast
- 4.2. Hardware
- 4.2.1. Key market trends, growth factors and opportunities
- 4.2.2. Market size and forecast, by region
- 4.2.3. Market share analysis by country
- 4.3. Software
- 4.3.1. Key market trends, growth factors and opportunities
- 4.3.2. Market size and forecast, by region
- 4.3.3. Market share analysis by country
- 4.4. Services
- 4.4.1. Key market trends, growth factors and opportunities
- 4.4.2. Market size and forecast, by region
- 4.4.3. Market share analysis by country
CHAPTER 5: AI IN GENOMICS MARKET, BY TECHNOLOGY
- 5.1. Overview
- 5.1.1. Market size and forecast
- 5.2. Machine Learning
- 5.2.1. Key market trends, growth factors and opportunities
- 5.2.2. Market size and forecast, by region
- 5.2.3. Market share analysis by country
- 5.3. Computer Vision
- 5.3.1. Key market trends, growth factors and opportunities
- 5.3.2. Market size and forecast, by region
- 5.3.3. Market share analysis by country
CHAPTER 6: AI IN GENOMICS MARKET, BY APPLICATION
- 6.1. Overview
- 6.1.1. Market size and forecast
- 6.2. Drug Discovery and Development
- 6.2.1. Key market trends, growth factors and opportunities
- 6.2.2. Market size and forecast, by region
- 6.2.3. Market share analysis by country
- 6.3. Precision Medicine
- 6.3.1. Key market trends, growth factors and opportunities
- 6.3.2. Market size and forecast, by region
- 6.3.3. Market share analysis by country
- 6.4. Diagnostics
- 6.4.1. Key market trends, growth factors and opportunities
- 6.4.2. Market size and forecast, by region
- 6.4.3. Market share analysis by country
- 6.5. Others
- 6.5.1. Key market trends, growth factors and opportunities
- 6.5.2. Market size and forecast, by region
- 6.5.3. Market share analysis by country
CHAPTER 7: AI IN GENOMICS MARKET, BY END USER
- 7.1. Overview
- 7.1.1. Market size and forecast
- 7.2. Pharmaceutical and Biotech Companies
- 7.2.1. Key market trends, growth factors and opportunities
- 7.2.2. Market size and forecast, by region
- 7.2.3. Market share analysis by country
- 7.3. Healthcare Providers
- 7.3.1. Key market trends, growth factors and opportunities
- 7.3.2. Market size and forecast, by region
- 7.3.3. Market share analysis by country
- 7.4. Research Centers
- 7.4.1. Key market trends, growth factors and opportunities
- 7.4.2. Market size and forecast, by region
- 7.4.3. Market share analysis by country
CHAPTER 8: AI IN GENOMICS MARKET, BY REGION
- 8.1. Overview
- 8.1.1. Market size and forecast By Region
- 8.2. North America
- 8.2.1. Key trends and opportunities
- 8.2.2. Market size and forecast, by Offering
- 8.2.3. Market size and forecast, by Technology
- 8.2.4. Market size and forecast, by Application
- 8.2.5. Market size and forecast, by End User
- 8.2.6. Market size and forecast, by country
- 8.2.6.1. U.S.
- 8.2.6.1.1. Key market trends, growth factors and opportunities
- 8.2.6.1.2. Market size and forecast, by Offering
- 8.2.6.1.3. Market size and forecast, by Technology
- 8.2.6.1.4. Market size and forecast, by Application
- 8.2.6.1.5. Market size and forecast, by End User
- 8.2.6.2. Canada
- 8.2.6.2.1. Key market trends, growth factors and opportunities
- 8.2.6.2.2. Market size and forecast, by Offering
- 8.2.6.2.3. Market size and forecast, by Technology
- 8.2.6.2.4. Market size and forecast, by Application
- 8.2.6.2.5. Market size and forecast, by End User
- 8.2.6.3. Mexico
- 8.2.6.3.1. Key market trends, growth factors and opportunities
- 8.2.6.3.2. Market size and forecast, by Offering
- 8.2.6.3.3. Market size and forecast, by Technology
- 8.2.6.3.4. Market size and forecast, by Application
- 8.2.6.3.5. Market size and forecast, by End User
- 8.3. Europe
- 8.3.1. Key trends and opportunities
- 8.3.2. Market size and forecast, by Offering
- 8.3.3. Market size and forecast, by Technology
- 8.3.4. Market size and forecast, by Application
- 8.3.5. Market size and forecast, by End User
- 8.3.6. Market size and forecast, by country
- 8.3.6.1. Germany
- 8.3.6.1.1. Key market trends, growth factors and opportunities
- 8.3.6.1.2. Market size and forecast, by Offering
- 8.3.6.1.3. Market size and forecast, by Technology
- 8.3.6.1.4. Market size and forecast, by Application
- 8.3.6.1.5. Market size and forecast, by End User
- 8.3.6.2. France
- 8.3.6.2.1. Key market trends, growth factors and opportunities
- 8.3.6.2.2. Market size and forecast, by Offering
- 8.3.6.2.3. Market size and forecast, by Technology
- 8.3.6.2.4. Market size and forecast, by Application
- 8.3.6.2.5. Market size and forecast, by End User
- 8.3.6.3. UK
- 8.3.6.3.1. Key market trends, growth factors and opportunities
- 8.3.6.3.2. Market size and forecast, by Offering
- 8.3.6.3.3. Market size and forecast, by Technology
- 8.3.6.3.4. Market size and forecast, by Application
- 8.3.6.3.5. Market size and forecast, by End User
- 8.3.6.4. Italy
- 8.3.6.4.1. Key market trends, growth factors and opportunities
- 8.3.6.4.2. Market size and forecast, by Offering
- 8.3.6.4.3. Market size and forecast, by Technology
- 8.3.6.4.4. Market size and forecast, by Application
- 8.3.6.4.5. Market size and forecast, by End User
- 8.3.6.5. Spain
- 8.3.6.5.1. Key market trends, growth factors and opportunities
- 8.3.6.5.2. Market size and forecast, by Offering
- 8.3.6.5.3. Market size and forecast, by Technology
- 8.3.6.5.4. Market size and forecast, by Application
- 8.3.6.5.5. Market size and forecast, by End User
- 8.3.6.6. Rest of Europe
- 8.3.6.6.1. Key market trends, growth factors and opportunities
- 8.3.6.6.2. Market size and forecast, by Offering
- 8.3.6.6.3. Market size and forecast, by Technology
- 8.3.6.6.4. Market size and forecast, by Application
- 8.3.6.6.5. Market size and forecast, by End User
- 8.4. Asia-Pacific
- 8.4.1. Key trends and opportunities
- 8.4.2. Market size and forecast, by Offering
- 8.4.3. Market size and forecast, by Technology
- 8.4.4. Market size and forecast, by Application
- 8.4.5. Market size and forecast, by End User
- 8.4.6. Market size and forecast, by country
- 8.4.6.1. Japan
- 8.4.6.1.1. Key market trends, growth factors and opportunities
- 8.4.6.1.2. Market size and forecast, by Offering
- 8.4.6.1.3. Market size and forecast, by Technology
- 8.4.6.1.4. Market size and forecast, by Application
- 8.4.6.1.5. Market size and forecast, by End User
- 8.4.6.2. China
- 8.4.6.2.1. Key market trends, growth factors and opportunities
- 8.4.6.2.2. Market size and forecast, by Offering
- 8.4.6.2.3. Market size and forecast, by Technology
- 8.4.6.2.4. Market size and forecast, by Application
- 8.4.6.2.5. Market size and forecast, by End User
- 8.4.6.3. Australia
- 8.4.6.3.1. Key market trends, growth factors and opportunities
- 8.4.6.3.2. Market size and forecast, by Offering
- 8.4.6.3.3. Market size and forecast, by Technology
- 8.4.6.3.4. Market size and forecast, by Application
- 8.4.6.3.5. Market size and forecast, by End User
- 8.4.6.4. India
- 8.4.6.4.1. Key market trends, growth factors and opportunities
- 8.4.6.4.2. Market size and forecast, by Offering
- 8.4.6.4.3. Market size and forecast, by Technology
- 8.4.6.4.4. Market size and forecast, by Application
- 8.4.6.4.5. Market size and forecast, by End User
- 8.4.6.5. South Korea
- 8.4.6.5.1. Key market trends, growth factors and opportunities
- 8.4.6.5.2. Market size and forecast, by Offering
- 8.4.6.5.3. Market size and forecast, by Technology
- 8.4.6.5.4. Market size and forecast, by Application
- 8.4.6.5.5. Market size and forecast, by End User
- 8.4.6.6. Rest of Asia-Pacific
- 8.4.6.6.1. Key market trends, growth factors and opportunities
- 8.4.6.6.2. Market size and forecast, by Offering
- 8.4.6.6.3. Market size and forecast, by Technology
- 8.4.6.6.4. Market size and forecast, by Application
- 8.4.6.6.5. Market size and forecast, by End User
- 8.5. LAMEA
- 8.5.1. Key trends and opportunities
- 8.5.2. Market size and forecast, by Offering
- 8.5.3. Market size and forecast, by Technology
- 8.5.4. Market size and forecast, by Application
- 8.5.5. Market size and forecast, by End User
- 8.5.6. Market size and forecast, by country
- 8.5.6.1. Brazil
- 8.5.6.1.1. Key market trends, growth factors and opportunities
- 8.5.6.1.2. Market size and forecast, by Offering
- 8.5.6.1.3. Market size and forecast, by Technology
- 8.5.6.1.4. Market size and forecast, by Application
- 8.5.6.1.5. Market size and forecast, by End User
- 8.5.6.2. Saudi Arabia
- 8.5.6.2.1. Key market trends, growth factors and opportunities
- 8.5.6.2.2. Market size and forecast, by Offering
- 8.5.6.2.3. Market size and forecast, by Technology
- 8.5.6.2.4. Market size and forecast, by Application
- 8.5.6.2.5. Market size and forecast, by End User
- 8.5.6.3. South Africa
- 8.5.6.3.1. Key market trends, growth factors and opportunities
- 8.5.6.3.2. Market size and forecast, by Offering
- 8.5.6.3.3. Market size and forecast, by Technology
- 8.5.6.3.4. Market size and forecast, by Application
- 8.5.6.3.5. Market size and forecast, by End User
- 8.5.6.4. Rest of LAMEA
- 8.5.6.4.1. Key market trends, growth factors and opportunities
- 8.5.6.4.2. Market size and forecast, by Offering
- 8.5.6.4.3. Market size and forecast, by Technology
- 8.5.6.4.4. Market size and forecast, by Application
- 8.5.6.4.5. Market size and forecast, by End User
CHAPTER 9: COMPETITIVE LANDSCAPE
- 9.1. Introduction
- 9.2. Top winning strategies
- 9.3. Product Mapping of Top 10 Player
- 9.4. Competitive Dashboard
- 9.5. Competitive Heatmap
- 9.6. Top player positioning, 2021
CHAPTER 10: COMPANY PROFILES
- 10.1. Microsoft Corporation
- 10.1.1. Company overview
- 10.1.2. Key Executives
- 10.1.3. Company snapshot
- 10.1.4. Operating business segments
- 10.1.5. Product portfolio
- 10.1.6. Business performance
- 10.1.7. Key strategic moves and developments
- 10.2. IBM Corporation
- 10.2.1. Company overview
- 10.2.2. Key Executives
- 10.2.3. Company snapshot
- 10.2.4. Operating business segments
- 10.2.5. Product portfolio
- 10.2.6. Business performance
- 10.2.7. Key strategic moves and developments
- 10.3. NVIDIA Corporation (Mellanox Technologies)
- 10.3.1. Company overview
- 10.3.2. Key Executives
- 10.3.3. Company snapshot
- 10.3.4. Operating business segments
- 10.3.5. Product portfolio
- 10.3.6. Business performance
- 10.3.7. Key strategic moves and developments
- 10.4. Deep Genomics
- 10.4.1. Company overview
- 10.4.2. Key Executives
- 10.4.3. Company snapshot
- 10.4.4. Operating business segments
- 10.4.5. Product portfolio
- 10.4.6. Key strategic moves and developments
- 10.5. Data4Cure, Inc
- 10.5.1. Company overview
- 10.5.2. Key Executives
- 10.5.3. Company snapshot
- 10.5.4. Operating business segments
- 10.5.5. Product portfolio
- 10.6. Freenome Holdings, Inc
- 10.6.1. Company overview
- 10.6.2. Key Executives
- 10.6.3. Company snapshot
- 10.6.4. Operating business segments
- 10.6.5. Product portfolio
- 10.7. Thermo Fisher Scientific Inc.
- 10.7.1. Company overview
- 10.7.2. Key Executives
- 10.7.3. Company snapshot
- 10.7.4. Operating business segments
- 10.7.5. Product portfolio
- 10.7.6. Business performance
- 10.8. Illumina, Inc.
- 10.8.1. Company overview
- 10.8.2. Key Executives
- 10.8.3. Company snapshot
- 10.8.4. Operating business segments
- 10.8.5. Product portfolio
- 10.8.6. Business performance
- 10.8.7. Key strategic moves and developments
- 10.9. Sophia Genetics
- 10.9.1. Company overview
- 10.9.2. Key Executives
- 10.9.3. Company snapshot
- 10.9.4. Operating business segments
- 10.9.5. Product portfolio
- 10.9.6. Business performance
- 10.10. BenevolentAI
- 10.10.1. Company overview
- 10.10.2. Key Executives
- 10.10.3. Company snapshot
- 10.10.4. Operating business segments
- 10.10.5. Product portfolio
- 10.10.6. Key strategic moves and developments
LIST OF TABLES
- TABLE 01. GLOBAL AI IN GENOMICS MARKET, BY OFFERING, 2021-2031 ($MILLION)
- TABLE 02. AI IN GENOMICS MARKET FOR HARDWARE, BY REGION, 2021-2031 ($MILLION)
- TABLE 03. AI IN GENOMICS MARKET FOR SOFTWARE, BY REGION, 2021-2031 ($MILLION)
- TABLE 04. AI IN GENOMICS MARKET FOR SERVICES, BY REGION, 2021-2031 ($MILLION)
- TABLE 05. GLOBAL AI IN GENOMICS MARKET, BY TECHNOLOGY, 2021-2031 ($MILLION)
- TABLE 06. AI IN GENOMICS MARKET FOR MACHINE LEARNING, BY REGION, 2021-2031 ($MILLION)
- TABLE 07. AI IN GENOMICS MARKET FOR COMPUTER VISION, BY REGION, 2021-2031 ($MILLION)
- TABLE 08. GLOBAL AI IN GENOMICS MARKET, BY APPLICATION, 2021-2031 ($MILLION)
- TABLE 09. AI IN GENOMICS MARKET FOR DRUG DISCOVERY AND DEVELOPMENT, BY REGION, 2021-2031 ($MILLION)
- TABLE 10. AI IN GENOMICS MARKET FOR PRECISION MEDICINE, BY REGION, 2021-2031 ($MILLION)
- TABLE 11. AI IN GENOMICS MARKET FOR DIAGNOSTICS, BY REGION, 2021-2031 ($MILLION)
- TABLE 12. AI IN GENOMICS MARKET FOR OTHERS, BY REGION, 2021-2031 ($MILLION)
- TABLE 13. GLOBAL AI IN GENOMICS MARKET, BY END USER, 2021-2031 ($MILLION)
- TABLE 14. AI IN GENOMICS MARKET FOR PHARMACEUTICAL AND BIOTECH COMPANIES, BY REGION, 2021-2031 ($MILLION)
- TABLE 15. AI IN GENOMICS MARKET FOR HEALTHCARE PROVIDERS, BY REGION, 2021-2031 ($MILLION)
- TABLE 16. AI IN GENOMICS MARKET FOR RESEARCH CENTERS, BY REGION, 2021-2031 ($MILLION)
- TABLE 17. AI IN GENOMICS MARKET, BY REGION, 2021-2031 ($MILLION)
- TABLE 18. NORTH AMERICA AI IN GENOMICS MARKET, BY OFFERING, 2021-2031 ($MILLION)
- TABLE 19. NORTH AMERICA AI IN GENOMICS MARKET, BY TECHNOLOGY, 2021-2031 ($MILLION)
- TABLE 20. NORTH AMERICA AI IN GENOMICS MARKET, BY APPLICATION, 2021-2031 ($MILLION)
- TABLE 21. NORTH AMERICA AI IN GENOMICS MARKET, BY END USER, 2021-2031 ($MILLION)
- TABLE 22. NORTH AMERICA AI IN GENOMICS MARKET, BY COUNTRY, 2021-2031 ($MILLION)
- TABLE 23. U.S. AI IN GENOMICS MARKET, BY OFFERING, 2021-2031 ($MILLION)
- TABLE 24. U.S. AI IN GENOMICS MARKET, BY TECHNOLOGY, 2021-2031 ($MILLION)
- TABLE 25. U.S. AI IN GENOMICS MARKET, BY APPLICATION, 2021-2031 ($MILLION)
- TABLE 26. U.S. AI IN GENOMICS MARKET, BY END USER, 2021-2031 ($MILLION)
- TABLE 27. CANADA AI IN GENOMICS MARKET, BY OFFERING, 2021-2031 ($MILLION)
- TABLE 28. CANADA AI IN GENOMICS MARKET, BY TECHNOLOGY, 2021-2031 ($MILLION)
- TABLE 29. CANADA AI IN GENOMICS MARKET, BY APPLICATION, 2021-2031 ($MILLION)
- TABLE 30. CANADA AI IN GENOMICS MARKET, BY END USER, 2021-2031 ($MILLION)
- TABLE 31. MEXICO AI IN GENOMICS MARKET, BY OFFERING, 2021-2031 ($MILLION)
- TABLE 32. MEXICO AI IN GENOMICS MARKET, BY TECHNOLOGY, 2021-2031 ($MILLION)
- TABLE 33. MEXICO AI IN GENOMICS MARKET, BY APPLICATION, 2021-2031 ($MILLION)
- TABLE 34. MEXICO AI IN GENOMICS MARKET, BY END USER, 2021-2031 ($MILLION)
- TABLE 35. EUROPE AI IN GENOMICS MARKET, BY OFFERING, 2021-2031 ($MILLION)
- TABLE 36. EUROPE AI IN GENOMICS MARKET, BY TECHNOLOGY, 2021-2031 ($MILLION)
- TABLE 37. EUROPE AI IN GENOMICS MARKET, BY APPLICATION, 2021-2031 ($MILLION)
- TABLE 38. EUROPE AI IN GENOMICS MARKET, BY END USER, 2021-2031 ($MILLION)
- TABLE 39. EUROPE AI IN GENOMICS MARKET, BY COUNTRY, 2021-2031 ($MILLION)
- TABLE 40. GERMANY AI IN GENOMICS MARKET, BY OFFERING, 2021-2031 ($MILLION)
- TABLE 41. GERMANY AI IN GENOMICS MARKET, BY TECHNOLOGY, 2021-2031 ($MILLION)
- TABLE 42. GERMANY AI IN GENOMICS MARKET, BY APPLICATION, 2021-2031 ($MILLION)
- TABLE 43. GERMANY AI IN GENOMICS MARKET, BY END USER, 2021-2031 ($MILLION)
- TABLE 44. FRANCE AI IN GENOMICS MARKET, BY OFFERING, 2021-2031 ($MILLION)
- TABLE 45. FRANCE AI IN GENOMICS MARKET, BY TECHNOLOGY, 2021-2031 ($MILLION)
- TABLE 46. FRANCE AI IN GENOMICS MARKET, BY APPLICATION, 2021-2031 ($MILLION)
- TABLE 47. FRANCE AI IN GENOMICS MARKET, BY END USER, 2021-2031 ($MILLION)
- TABLE 48. UK AI IN GENOMICS MARKET, BY OFFERING, 2021-2031 ($MILLION)
- TABLE 49. UK AI IN GENOMICS MARKET, BY TECHNOLOGY, 2021-2031 ($MILLION)
- TABLE 50. UK AI IN GENOMICS MARKET, BY APPLICATION, 2021-2031 ($MILLION)
- TABLE 51. UK AI IN GENOMICS MARKET, BY END USER, 2021-2031 ($MILLION)
- TABLE 52. ITALY AI IN GENOMICS MARKET, BY OFFERING, 2021-2031 ($MILLION)
- TABLE 53. ITALY AI IN GENOMICS MARKET, BY TECHNOLOGY, 2021-2031 ($MILLION)
- TABLE 54. ITALY AI IN GENOMICS MARKET, BY APPLICATION, 2021-2031 ($MILLION)
- TABLE 55. ITALY AI IN GENOMICS MARKET, BY END USER, 2021-2031 ($MILLION)
- TABLE 56. SPAIN AI IN GENOMICS MARKET, BY OFFERING, 2021-2031 ($MILLION)
- TABLE 57. SPAIN AI IN GENOMICS MARKET, BY TECHNOLOGY, 2021-2031 ($MILLION)
- TABLE 58. SPAIN AI IN GENOMICS MARKET, BY APPLICATION, 2021-2031 ($MILLION)
- TABLE 59. SPAIN AI IN GENOMICS MARKET, BY END USER, 2021-2031 ($MILLION)
- TABLE 60. REST OF EUROPE AI IN GENOMICS MARKET, BY OFFERING, 2021-2031 ($MILLION)
- TABLE 61. REST OF EUROPE AI IN GENOMICS MARKET, BY TECHNOLOGY, 2021-2031 ($MILLION)
- TABLE 62. REST OF EUROPE AI IN GENOMICS MARKET, BY APPLICATION, 2021-2031 ($MILLION)
- TABLE 63. REST OF EUROPE AI IN GENOMICS MARKET, BY END USER, 2021-2031 ($MILLION)
- TABLE 64. ASIA-PACIFIC AI IN GENOMICS MARKET, BY OFFERING, 2021-2031 ($MILLION)
- TABLE 65. ASIA-PACIFIC AI IN GENOMICS MARKET, BY TECHNOLOGY, 2021-2031 ($MILLION)
- TABLE 66. ASIA-PACIFIC AI IN GENOMICS MARKET, BY APPLICATION, 2021-2031 ($MILLION)
- TABLE 67. ASIA-PACIFIC AI IN GENOMICS MARKET, BY END USER, 2021-2031 ($MILLION)
- TABLE 68. ASIA-PACIFIC AI IN GENOMICS MARKET, BY COUNTRY, 2021-2031 ($MILLION)
- TABLE 69. JAPAN AI IN GENOMICS MARKET, BY OFFERING, 2021-2031 ($MILLION)
- TABLE 70. JAPAN AI IN GENOMICS MARKET, BY TECHNOLOGY, 2021-2031 ($MILLION)
- TABLE 71. JAPAN AI IN GENOMICS MARKET, BY APPLICATION, 2021-2031 ($MILLION)
- TABLE 72. JAPAN AI IN GENOMICS MARKET, BY END USER, 2021-2031 ($MILLION)
- TABLE 73. CHINA AI IN GENOMICS MARKET, BY OFFERING, 2021-2031 ($MILLION)
- TABLE 74. CHINA AI IN GENOMICS MARKET, BY TECHNOLOGY, 2021-2031 ($MILLION)
- TABLE 75. CHINA AI IN GENOMICS MARKET, BY APPLICATION, 2021-2031 ($MILLION)
- TABLE 76. CHINA AI IN GENOMICS MARKET, BY END USER, 2021-2031 ($MILLION)
- TABLE 77. AUSTRALIA AI IN GENOMICS MARKET, BY OFFERING, 2021-2031 ($MILLION)
- TABLE 78. AUSTRALIA AI IN GENOMICS MARKET, BY TECHNOLOGY, 2021-2031 ($MILLION)
- TABLE 79. AUSTRALIA AI IN GENOMICS MARKET, BY APPLICATION, 2021-2031 ($MILLION)
- TABLE 80. AUSTRALIA AI IN GENOMICS MARKET, BY END USER, 2021-2031 ($MILLION)
- TABLE 81. INDIA AI IN GENOMICS MARKET, BY OFFERING, 2021-2031 ($MILLION)
- TABLE 82. INDIA AI IN GENOMICS MARKET, BY TECHNOLOGY, 2021-2031 ($MILLION)
- TABLE 83. INDIA AI IN GENOMICS MARKET, BY APPLICATION, 2021-2031 ($MILLION)
- TABLE 84. INDIA AI IN GENOMICS MARKET, BY END USER, 2021-2031 ($MILLION)
- TABLE 85. SOUTH KOREA AI IN GENOMICS MARKET, BY OFFERING, 2021-2031 ($MILLION)
- TABLE 86. SOUTH KOREA AI IN GENOMICS MARKET, BY TECHNOLOGY, 2021-2031 ($MILLION)
- TABLE 87. SOUTH KOREA AI IN GENOMICS MARKET, BY APPLICATION, 2021-2031 ($MILLION)
- TABLE 88. SOUTH KOREA AI IN GENOMICS MARKET, BY END USER, 2021-2031 ($MILLION)
- TABLE 89. REST OF ASIA-PACIFIC AI IN GENOMICS MARKET, BY OFFERING, 2021-2031 ($MILLION)
- TABLE 90. REST OF ASIA-PACIFIC AI IN GENOMICS MARKET, BY TECHNOLOGY, 2021-2031 ($MILLION)
- TABLE 91. REST OF ASIA-PACIFIC AI IN GENOMICS MARKET, BY APPLICATION, 2021-2031 ($MILLION)
- TABLE 92. REST OF ASIA-PACIFIC AI IN GENOMICS MARKET, BY END USER, 2021-2031 ($MILLION)
- TABLE 93. LAMEA AI IN GENOMICS MARKET, BY OFFERING, 2021-2031 ($MILLION)
- TABLE 94. LAMEA AI IN GENOMICS MARKET, BY TECHNOLOGY, 2021-2031 ($MILLION)
- TABLE 95. LAMEA AI IN GENOMICS MARKET, BY APPLICATION, 2021-2031 ($MILLION)
- TABLE 96. LAMEA AI IN GENOMICS MARKET, BY END USER, 2021-2031 ($MILLION)
- TABLE 97. LAMEA AI IN GENOMICS MARKET, BY COUNTRY, 2021-2031 ($MILLION)
- TABLE 98. BRAZIL AI IN GENOMICS MARKET, BY OFFERING, 2021-2031 ($MILLION)
- TABLE 99. BRAZIL AI IN GENOMICS MARKET, BY TECHNOLOGY, 2021-2031 ($MILLION)
- TABLE 100. BRAZIL AI IN GENOMICS MARKET, BY APPLICATION, 2021-2031 ($MILLION)
- TABLE 101. BRAZIL AI IN GENOMICS MARKET, BY END USER, 2021-2031 ($MILLION)
- TABLE 102. SAUDI ARABIA AI IN GENOMICS MARKET, BY OFFERING, 2021-2031 ($MILLION)
- TABLE 103. SAUDI ARABIA AI IN GENOMICS MARKET, BY TECHNOLOGY, 2021-2031 ($MILLION)
- TABLE 104. SAUDI ARABIA AI IN GENOMICS MARKET, BY APPLICATION, 2021-2031 ($MILLION)
- TABLE 105. SAUDI ARABIA AI IN GENOMICS MARKET, BY END USER, 2021-2031 ($MILLION)
- TABLE 106. SOUTH AFRICA AI IN GENOMICS MARKET, BY OFFERING, 2021-2031 ($MILLION)
- TABLE 107. SOUTH AFRICA AI IN GENOMICS MARKET, BY TECHNOLOGY, 2021-2031 ($MILLION)
- TABLE 108. SOUTH AFRICA AI IN GENOMICS MARKET, BY APPLICATION, 2021-2031 ($MILLION)
- TABLE 109. SOUTH AFRICA AI IN GENOMICS MARKET, BY END USER, 2021-2031 ($MILLION)
- TABLE 110. REST OF LAMEA AI IN GENOMICS MARKET, BY OFFERING, 2021-2031 ($MILLION)
- TABLE 111. REST OF LAMEA AI IN GENOMICS MARKET, BY TECHNOLOGY, 2021-2031 ($MILLION)
- TABLE 112. REST OF LAMEA AI IN GENOMICS MARKET, BY APPLICATION, 2021-2031 ($MILLION)
- TABLE 113. REST OF LAMEA AI IN GENOMICS MARKET, BY END USER, 2021-2031 ($MILLION)
- TABLE 114. MICROSOFT CORPORATION: KEY EXECUTIVES
- TABLE 115. MICROSOFT CORPORATION: COMPANY SNAPSHOT
- TABLE 116. MICROSOFT CORPORATION: SERVICE SEGMENTS
- TABLE 117. MICROSOFT CORPORATION: PRODUCT PORTFOLIO
- TABLE 118. MICROSOFT CORPORATION: KEY STRATERGIES
- TABLE 119. IBM CORPORATION: KEY EXECUTIVES
- TABLE 120. IBM CORPORATION: COMPANY SNAPSHOT
- TABLE 121. IBM CORPORATION: SERVICE SEGMENTS
- TABLE 122. IBM CORPORATION: PRODUCT PORTFOLIO
- TABLE 123. IBM CORPORATION: KEY STRATERGIES
- TABLE 124. NVIDIA CORPORATION (MELLANOX TECHNOLOGIES): KEY EXECUTIVES
- TABLE 125. NVIDIA CORPORATION (MELLANOX TECHNOLOGIES): COMPANY SNAPSHOT
- TABLE 126. NVIDIA CORPORATION (MELLANOX TECHNOLOGIES): PRODUCT SEGMENTS
- TABLE 127. NVIDIA CORPORATION (MELLANOX TECHNOLOGIES): PRODUCT PORTFOLIO
- TABLE 128. NVIDIA CORPORATION (MELLANOX TECHNOLOGIES): KEY STRATERGIES
- TABLE 129. DEEP GENOMICS: KEY EXECUTIVES
- TABLE 130. DEEP GENOMICS: COMPANY SNAPSHOT
- TABLE 131. DEEP GENOMICS: SERVICE SEGMENTS
- TABLE 132. DEEP GENOMICS: PRODUCT PORTFOLIO
- TABLE 133. DEEP GENOMICS: KEY STRATERGIES
- TABLE 134. DATA4CURE, INC: KEY EXECUTIVES
- TABLE 135. DATA4CURE, INC: COMPANY SNAPSHOT
- TABLE 136. DATA4CURE, INC: SERVICE SEGMENTS
- TABLE 137. DATA4CURE, INC: PRODUCT PORTFOLIO
- TABLE 138. FREENOME HOLDINGS, INC: KEY EXECUTIVES
- TABLE 139. FREENOME HOLDINGS, INC: COMPANY SNAPSHOT
- TABLE 140. FREENOME HOLDINGS, INC: SERVICE SEGMENTS
- TABLE 141. FREENOME HOLDINGS, INC: PRODUCT PORTFOLIO
- TABLE 142. THERMO FISHER SCIENTIFIC INC.: KEY EXECUTIVES
- TABLE 143. THERMO FISHER SCIENTIFIC INC.: COMPANY SNAPSHOT
- TABLE 144. THERMO FISHER SCIENTIFIC INC.: PRODUCT SEGMENTS
- TABLE 145. THERMO FISHER SCIENTIFIC INC.: PRODUCT PORTFOLIO
- TABLE 146. ILLUMINA, INC.: KEY EXECUTIVES
- TABLE 147. ILLUMINA, INC.: COMPANY SNAPSHOT
- TABLE 148. ILLUMINA, INC.: PRODUCT SEGMENTS
- TABLE 149. ILLUMINA, INC.: PRODUCT PORTFOLIO
- TABLE 150. ILLUMINA, INC.: KEY STRATERGIES
- TABLE 151. SOPHIA GENETICS: KEY EXECUTIVES
- TABLE 152. SOPHIA GENETICS: COMPANY SNAPSHOT
- TABLE 153. SOPHIA GENETICS: PRODUCT SEGMENTS
- TABLE 154. SOPHIA GENETICS: SERVICE SEGMENTS
- TABLE 155. SOPHIA GENETICS: PRODUCT PORTFOLIO
- TABLE 156. BENEVOLENTAI: KEY EXECUTIVES
- TABLE 157. BENEVOLENTAI: COMPANY SNAPSHOT
- TABLE 158. BENEVOLENTAI: SERVICE SEGMENTS
- TABLE 159. BENEVOLENTAI: PRODUCT PORTFOLIO
- TABLE 160. BENEVOLENTAI: KEY STRATERGIES
LIST OF FIGURES
- FIGURE 01. AI IN GENOMICS MARKET, 2021-2031
- FIGURE 02. SEGMENTATION OF AI IN GENOMICS MARKET, 2021-2031
- FIGURE 03. TOP INVESTMENT POCKETS IN AI IN GENOMICS MARKET (2022-2031)
- FIGURE 04. LOW BARGAINING POWER OF SUPPLIERS
- FIGURE 05. LOW BARGAINING POWER OF BUYERS
- FIGURE 06. LOW THREAT OF SUBSTITUTES
- FIGURE 07. LOW THREAT OF NEW ENTRANTS
- FIGURE 08. LOW INTENSITY OF RIVALRY
- FIGURE 09. DRIVERS, RESTRAINTS AND OPPORTUNITIES: GLOBALAI IN GENOMICS MARKET
- FIGURE 10. AI IN GENOMICS MARKET, BY OFFERING, 2021(%)
- FIGURE 11. COMPARATIVE SHARE ANALYSIS OF AI IN GENOMICS MARKET FOR HARDWARE, BY COUNTRY 2021 AND 2031(%)
- FIGURE 12. COMPARATIVE SHARE ANALYSIS OF AI IN GENOMICS MARKET FOR SOFTWARE, BY COUNTRY 2021 AND 2031(%)
- FIGURE 13. COMPARATIVE SHARE ANALYSIS OF AI IN GENOMICS MARKET FOR SERVICES, BY COUNTRY 2021 AND 2031(%)
- FIGURE 14. AI IN GENOMICS MARKET, BY TECHNOLOGY, 2021(%)
- FIGURE 15. COMPARATIVE SHARE ANALYSIS OF AI IN GENOMICS MARKET FOR MACHINE LEARNING, BY COUNTRY 2021 AND 2031(%)
- FIGURE 16. COMPARATIVE SHARE ANALYSIS OF AI IN GENOMICS MARKET FOR COMPUTER VISION, BY COUNTRY 2021 AND 2031(%)
- FIGURE 17. AI IN GENOMICS MARKET, BY APPLICATION, 2021(%)
- FIGURE 18. COMPARATIVE SHARE ANALYSIS OF AI IN GENOMICS MARKET FOR DRUG DISCOVERY AND DEVELOPMENT, BY COUNTRY 2021 AND 2031(%)
- FIGURE 19. COMPARATIVE SHARE ANALYSIS OF AI IN GENOMICS MARKET FOR PRECISION MEDICINE, BY COUNTRY 2021 AND 2031(%)
- FIGURE 20. COMPARATIVE SHARE ANALYSIS OF AI IN GENOMICS MARKET FOR DIAGNOSTICS, BY COUNTRY 2021 AND 2031(%)
- FIGURE 21. COMPARATIVE SHARE ANALYSIS OF AI IN GENOMICS MARKET FOR OTHERS, BY COUNTRY 2021 AND 2031(%)
- FIGURE 22. AI IN GENOMICS MARKET, BY END USER, 2021(%)
- FIGURE 23. COMPARATIVE SHARE ANALYSIS OF AI IN GENOMICS MARKET FOR PHARMACEUTICAL AND BIOTECH COMPANIES, BY COUNTRY 2021 AND 2031(%)
- FIGURE 24. COMPARATIVE SHARE ANALYSIS OF AI IN GENOMICS MARKET FOR HEALTHCARE PROVIDERS, BY COUNTRY 2021 AND 2031(%)
- FIGURE 25. COMPARATIVE SHARE ANALYSIS OF AI IN GENOMICS MARKET FOR RESEARCH CENTERS, BY COUNTRY 2021 AND 2031(%)
- FIGURE 26. AI IN GENOMICS MARKET BY REGION, 2021
- FIGURE 27. U.S. AI IN GENOMICS MARKET, 2021-2031 ($MILLION)
- FIGURE 28. CANADA AI IN GENOMICS MARKET, 2021-2031 ($MILLION)
- FIGURE 29. MEXICO AI IN GENOMICS MARKET, 2021-2031 ($MILLION)
- FIGURE 30. GERMANY AI IN GENOMICS MARKET, 2021-2031 ($MILLION)
- FIGURE 31. FRANCE AI IN GENOMICS MARKET, 2021-2031 ($MILLION)
- FIGURE 32. UK AI IN GENOMICS MARKET, 2021-2031 ($MILLION)
- FIGURE 33. ITALY AI IN GENOMICS MARKET, 2021-2031 ($MILLION)
- FIGURE 34. SPAIN AI IN GENOMICS MARKET, 2021-2031 ($MILLION)
- FIGURE 35. REST OF EUROPE AI IN GENOMICS MARKET, 2021-2031 ($MILLION)
- FIGURE 36. JAPAN AI IN GENOMICS MARKET, 2021-2031 ($MILLION)
- FIGURE 37. CHINA AI IN GENOMICS MARKET, 2021-2031 ($MILLION)
- FIGURE 38. AUSTRALIA AI IN GENOMICS MARKET, 2021-2031 ($MILLION)
- FIGURE 39. INDIA AI IN GENOMICS MARKET, 2021-2031 ($MILLION)
- FIGURE 40. SOUTH KOREA AI IN GENOMICS MARKET, 2021-2031 ($MILLION)
- FIGURE 41. REST OF ASIA-PACIFIC AI IN GENOMICS MARKET, 2021-2031 ($MILLION)
- FIGURE 42. BRAZIL AI IN GENOMICS MARKET, 2021-2031 ($MILLION)
- FIGURE 43. SAUDI ARABIA AI IN GENOMICS MARKET, 2021-2031 ($MILLION)
- FIGURE 44. SOUTH AFRICA AI IN GENOMICS MARKET, 2021-2031 ($MILLION)
- FIGURE 45. REST OF LAMEA AI IN GENOMICS MARKET, 2021-2031 ($MILLION)
- FIGURE 46. TOP WINNING STRATEGIES, BY YEAR
- FIGURE 47. TOP WINNING STRATEGIES, BY DEVELOPMENT
- FIGURE 48. TOP WINNING STRATEGIES, BY COMPANY
- FIGURE 49. PRODUCT MAPPING OF TOP 10 PLAYERS
- FIGURE 50. COMPETITIVE DASHBOARD
- FIGURE 51. COMPETITIVE HEATMAP: AI IN GENOMICS MARKET
- FIGURE 52. TOP PLAYER POSITIONING, 2021
- FIGURE 53. MICROSOFT CORPORATION.: NET REVENUE, 2020-2022 ($MILLION)
- FIGURE 54. MICROSOFT CORPORATION.: RESEARCH & DEVELOPMENT EXPENDITURE, 2020-2022 ($MILLION)
- FIGURE 55. MICROSOFT CORPORATION.: REVENUE SHARE BY SEGMENT, 2022 (%)
- FIGURE 56. MICROSOFT CORPORATION.: REVENUE SHARE BY REGION, 2022 (%)
- FIGURE 57. IBM CORPORATION: NET REVENUE, 2020-2022 ($MILLION)
- FIGURE 58. IBM CORPORATION: RESEARCH & DEVELOPMENT EXPENDITURE, 2019-2021
- FIGURE 59. IBM CORPORATION: REVENUE SHARE BY REGION, 2022 (%)
- FIGURE 60. IBM CORPORATION: REVENUE SHARE BY SEGMENT, 2022 (%)
- FIGURE 61. NVIDIA CORPORATION (MELLANOX TECHNOLOGIES): NET REVENUE, 2020-2022 ($MILLION)
- FIGURE 62. NVIDIA CORPORATION (MELLANOX TECHNOLOGIES): RESEARCH & DEVELOPMENT EXPENDITURE, 2020-2022
- FIGURE 63. NVIDIA CORPORATION (MELLANOX TECHNOLOGIES): REVENUE SHARE BY SEGMENT, 2022 (%)
- FIGURE 64. NVIDIA CORPORATION (MELLANOX TECHNOLOGIES): REVENUE SHARE BY REGION, 2022 (%)
- FIGURE 65. THERMO FISHER SCIENTIFIC INC.: NET REVENUE, 2019-2021 ($MILLION)
- FIGURE 66. THERMO FISHER SCIENTIFIC INC.: REVENUE SHARE BY SEGMENT, 2021 (%)
- FIGURE 67. THERMO FISHER SCIENTIFIC INC.: REVENUE SHARE BY REGION, 2021 (%)
- FIGURE 68. ILLUMINA, INC.: NET REVENUE, 2020-2022 ($MILLION)
- FIGURE 69. ILLUMINA, INC.: REVENUE SHARE BY SEGMENT, 2022 (%)
- FIGURE 70. ILLUMINA, INC.: REVENUE SHARE BY REGION, 2022 (%)
- FIGURE 71. SOPHIA GENETICS: NET REVENUE, 2019-2021 ($MILLION)
- FIGURE 72. SOPHIA GENETICS: REVENUE SHARE BY SEGMENT, 2021 (%)
- FIGURE 73. SOPHIA GENETICS: REVENUE SHARE BY REGION, 2021 (%)
 基因組市場中的人工智慧:按產品、功能、應用和最終用戶分類 - 2024-2030 年全球預測
 體學研究中人工智慧的全球市場:按產品、按技術平台、按應用、按最終用戶、按地區
 全球基因組學人工智慧市場研究報告 - 2023 年至 2030 年行業分析、規模、佔有率、成長、趨勢和預測
 基因組學市場中的人工智慧:按交付類型、功能、應用、最終用戶、區域 - 規模、份額、展望、機會分析,2023-2030
 基因組學市場中的人工智慧.份額.規模.趨勢.行業分析報告:按產品提供.技術.功能.應用.最終用戶.地區和細分市場的預測2023-2032 年
 全球基因組學人工智能 (AI) 市場 (2023-2033)
 全球基因組學人工智能 (AI) 市場:按產品、技術、功能、應用、最終用戶、地區劃分——預測至 2028 年
 2022-2029年全球基因組學人工智慧市場規模研究與預測,按組件、按技術、按功能、按應用、按最終用途和區域分析。
 基因組學中的 AI 市場規模、份額和趨勢分析報告:按組件、技術、功能、應用、最終用途、地區和細分趨勢,2023-2030 年
 基因學的AI的全球市場 (2023-2030年):規模·佔有率·預測 (零組件·技術·用途·各地區)·COVID-19影響分析