


 |
市場調查報告書
商品編碼
1298228
電廠鍋爐市場:按燃料類型、類型、技術、容量:2021-2031 年全球機遇分析和行業預測Power Plant Boiler Market By Fuel Type, By Type, By Technology, By Capacity : Global Opportunity Analysis and Industry Forecast, 2021-2031 |
||||||
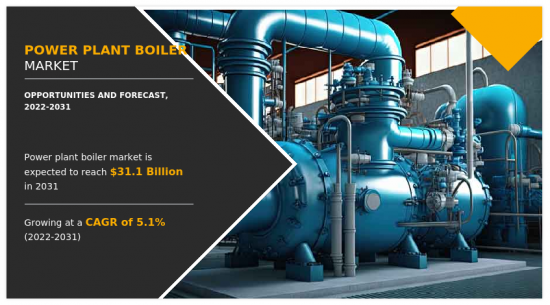
2021年全球電站鍋爐市場價值為190億美元,預計2022年至2031年復合年增長率為5.1%,2031年達到311億美元。
電站鍋爐是一種先進設備,由爐膛、水冷壁、過熱器、省煤器、空氣預熱器等多個部件組成。這些元件共同有助於確保燃料的有效燃燒以及從燃料到工作流體(通常是蒸汽或水)的熱傳遞。電廠鍋爐市場受到多種因素的推動,例如能源需求的增加、電廠鍋爐設計和材料的技術進步、對環境問題的認識不斷增強以及對可持續能源解決方案的需求。然而,安裝和維護方面的熟練勞動力有限以及燃料價格波動限制了市場增長。新興經濟體對電站鍋爐需求的不斷增長為市場帶來了巨大機遇。
然而,研發資金有限可能會減緩電站鍋爐市場的創新步伐。如果沒有足夠的研發投資,電廠鍋爐製造商可能很難開發出能夠提高效率、減少排放並滿足新監管標準的新技術和創新技術。研發資金有限也推高了電廠鍋爐製造商的成本。製造商可能不得不花費更多資金來開發新技術和確保替代資金來源,這可能會增加總體生產成本。研發資金有限也可能限制電廠鍋爐市場新技術的採用。
發電廠運營商可能不願意投資未經證實或未經充分測試的新技術,這可能會限制新產品的採用。上述原因預計將阻礙電站鍋爐市場的發展。
目錄
第 1 章 簡介
第二章執行摘要
第三章市場概況
- 市場定義和範圍
- 主要發現
- 影響因素
- 主要投資機會
- 波特五力分析
- 供應商的議價能力
- 買方議價能力
- 替代品的威脅
- 新進入者的威脅
- 競爭強度
- 市場動態
- 促進者
- 能源需求增加
- 電廠鍋爐設計和材料的技術進步
- 人們對環境問題和可持續能源解決方案需求的認識不斷增強
- 抑製劑
- 缺乏安裝和維護的熟練勞動力
- 燃油價格波動
- 機會
- 新興國家對電站鍋爐的需求不斷增加
- 促進者
- COVID-19 的市場影響分析
- 關鍵監管分析
- 價值鏈分析
4 發電廠鍋爐市場,按燃料類型
- 概述
- 市場規模及預測
- 燃煤鍋爐
- 主要市場趨勢、增長動力和增長機會
- 市場規模/預測:按地區
- 市場份額分析:按國家分類
- 燃氣鍋爐
- 主要市場趨勢、增長動力和機遇
- 市場規模/預測:按地區
- 市場份額分析:按國家分類
- 燃油鍋爐
- 主要市場趨勢、增長動力和機遇
- 市場規模/預測:按地區
- 市場份額分析:按國家分類
- 其他
- 主要市場趨勢、增長動力和機遇
- 市場規模/預測:按地區
- 市場份額分析:按國家分類
5 電廠鍋爐市場,按類型
- 概述
- 市場規模及預測
- 研磨鍋爐
- 主要市場趨勢、增長動力和增長機會
- 市場規模/預測:按地區
- 市場份額分析:按國家分類
- 循環流鍋爐
- 主要市場趨勢、增長動力和機遇
- 市場規模/預測:按地區
- 市場份額分析:按國家分類
- 其他
- 主要市場趨勢、增長動力和機遇
- 市場規模/預測:按地區
- 市場份額分析:按國家分類
6 電站鍋爐市場(按技術)
- 概述
- 市場規模/預測
- 亞臨界壓力
- 主要市場趨勢、增長動力和增長機會
- 市場規模/預測:按地區
- 市場份額分析:按國家分類
- 超臨界壓力
- 主要市場趨勢、增長動力和機遇
- 市場規模/預測:按地區
- 市場份額分析:按國家分類
- 超超臨界壓力
- 主要市場趨勢、增長動力和機遇
- 市場規模/預測:按地區
- 市場份額分析:按國家分類
7 電廠鍋爐市場(按容量)
- 概述
- 市場規模及預測
- 小於 400MW
- 主要市場趨勢、增長動力和增長機會
- 市場規模/預測:按地區
- 市場份額分析:按國家分類
- 400~800MW
- 主要市場趨勢、增長動力和機遇
- 市場規模/預測:按地區
- 市場份額分析:按國家分類
- 800MW以上
- 主要市場趨勢、增長動力和機遇
- 市場規模/預測:按地區
- 市場份額分析:按國家分類
8 發電廠鍋爐市場,按地區
- 概述
- 市場規模/預測:按地區
- 北美
- 主要趨勢和機遇
- 市場規模和預測:按燃料類型
- 市場規模/預測:按類型
- 市場規模/預測:按技術
- 市場規模/預測:按產能
- 市場規模/預測:按國家
- 美國
- 主要市場趨勢、增長因素和增長機會
- 市場規模和預測:按燃料類型
- 市場規模/預測:按類型
- 市場規模/預測:按技術
- 市場規模/預測:按產能
- 加拿大
- 主要市場趨勢、增長因素和增長機會
- 市場規模和預測:按燃料類型
- 市場規模/預測:按類型
- 市場規模/預測:按技術
- 市場規模/預測:按產能
- 墨西哥
- 主要市場趨勢、增長因素和增長機會
- 市場規模和預測:按燃料類型
- 市場規模/預測:按類型
- 市場規模/預測:按技術
- 市場規模/預測:按產能
- 歐洲
- 主要趨勢和機遇
- 市場規模和預測:按燃料類型
- 市場規模/預測:按類型
- 市場規模/預測:按技術
- 市場規模/預測:按產能
- 市場規模/預測:按國家
- 德國
- 主要市場趨勢、增長因素和增長機會
- 市場規模和預測:按燃料類型
- 市場規模/預測:按類型
- 市場規模/預測:按技術
- 市場規模/預測:按產能
- 法國
- 主要市場趨勢、增長動力和增長機會
- 市場規模和預測:按燃料類型
- 市場規模/預測:按類型
- 市場規模/預測:按技術
- 市場規模/預測:按產能
- 意大利
- 主要市場趨勢、增長動力和增長機會
- 市場規模和預測:按燃料類型
- 市場規模/預測:按類型
- 市場規模/預測:按技術
- 市場規模/預測:按產能
- 西班牙
- 主要市場趨勢、增長因素和增長機會
- 市場規模和預測:按燃料類型
- 市場規模/預測:按類型
- 市場規模/預測:按技術
- 市場規模/預測:按產能
- 英國
- 主要市場趨勢、增長因素和增長機會
- 市場規模和預測:按燃料類型
- 市場規模/預測:按類型
- 市場規模/預測:按技術
- 市場規模/預測:按產能
- 歐洲其他地區
- 主要市場趨勢、增長因素和增長機會
- 市場規模和預測:按燃料類型
- 市場規模/預測:按類型
- 市場規模/預測:按技術
- 市場規模/預測:按產能
- 亞太地區
- 主要趨勢和機遇
- 市場規模和預測:按燃料類型
- 市場規模/預測:按類型
- 市場規模/預測:按技術
- 市場規模/預測:按產能
- 市場規模/預測:按國家
- 中國
- 主要市場趨勢、增長因素和增長機會
- 市場規模和預測:按燃料類型
- 市場規模/預測:按類型
- 市場規模/預測:按技術
- 市場規模/預測:按產能
- 日本
- 主要市場趨勢、增長因素和增長機會
- 市場規模和預測:按燃料類型
- 市場規模/預測:按類型
- 市場規模/預測:按技術
- 市場規模/預測:按產能
- 印度
- 主要市場趨勢、增長因素和增長機會
- 市場規模和預測:按燃料類型
- 市場規模/預測:按類型
- 市場規模/預測:按技術
- 市場規模/預測:按產能
- 韓國
- 主要市場趨勢、增長因素和增長機會
- 市場規模和預測:按燃料類型
- 市場規模/預測:按類型
- 市場規模/預測:按技術
- 市場規模/預測:按產能
- 澳大利亞
- 主要市場趨勢、增長因素和增長機會
- 市場規模和預測:按燃料類型
- 市場規模/預測:按類型
- 市場規模/預測:按技術
- 市場規模/預測:按產能
- 亞太其他地區
- 主要市場趨勢、增長動力和增長機會
- 市場規模和預測:按燃料類型
- 市場規模/預測:按類型
- 市場規模/預測:按技術
- 市場規模/預測:按產能
- 拉丁美洲/中東/非洲
- 主要趨勢和機遇
- 市場規模和預測:按燃料類型
- 市場規模/預測:按類型
- 市場規模/預測:按技術
- 市場規模/預測:按產能
- 市場規模/預測:按國家
- 巴西
- 主要市場趨勢、增長因素和增長機會
- 市場規模和預測:按燃料類型
- 市場規模/預測:按類型
- 市場規模/預測:按技術
- 市場規模/預測:按產能
- 沙特阿拉伯
- 主要市場趨勢、增長因素和增長機會
- 市場規模和預測:按燃料類型
- 市場規模/預測:按類型
- 市場規模/預測:按技術
- 市場規模/預測:按產能
- 南非
- 主要市場趨勢、增長動力和增長機會
- 市場規模和預測:按燃料類型
- 市場規模/預測:按類型
- 市場規模/預測:按技術
- 市場規模/預測:按產能
- 其他地區
- 主要市場趨勢、增長因素和增長機會
- 市場規模和預測:按燃料類型
- 市場規模/預測:按類型
- 市場規模/預測:按技術
- 市場規模/預測:按產能
第9章 競爭格局
- 介紹
- 關鍵成功策略
- 10大公司產品圖
- 比賽儀表板
- 比賽熱圖
- 2021 年公司主要定位
第十章公司簡介
- General Electric
- Siemens AG
- Babcock & Wilcox Enterprises, Inc.
- Mitsubishi Hitachi Power Systems, Ltd.
- Doosan Corp.
- Bharat Heavy Electricals Limited
- Alstom SA
- Harbin Electric Corporation
- Dongfang Electric Corporation Limited
- Kawasaki Heavy Industries, Ltd.
The global power plant boiler market was valued at $19.0 billion in 2021, and is projected to reach $31.1 billion by 2031, growing at a CAGR of 5.1% from 2022 to 2031.
A power plant boiler is an advanced piece of equipment made up of numerous parts, including a furnace, water walls, superheaters, economizers, and air preheaters. Together, these elements help to ensure efficient fuel combustion and heat transfer from the fuel to the working fluid, which is usually steam or water. The power plant boiler market is driven by several factors, including the increase in demand for energy, technological advancements in power plant boiler designs and materials, and surge in awareness of environmental issues and the need for sustainable energy solutions. However, limited availability of skilled labor for installation and maintenance and fluctuations in fuel prices limit the market growth. The increase in demand for power plant boilers in emerging economies presents a significant opportunity for the market.
However, limited funding for R&D can slow down the pace of innovation in the power plant boiler market. Power plant boiler manufacturers may struggle to develop new and innovative technologies that can improve efficiency, reduce emissions, and meet new regulatory standards without sufficient investment in R&D. Limited funding for R&D can also lead to higher costs for power plant boiler manufacturers. Manufacturers might have to spend more on developing new technologies or finding alternative sources of funding, which can increase the overall cost of production. Limited funding for R&D can also limit the adoption of new technologies in the power plant boiler market.
Power plant operators may be hesitant to invest in new technologies that are unproven or have not been adequately tested, which can limit the uptake of new products. The abovementioned reasons are projected to hamper the development of the power plant boiler market.
The global power plant boiler market analysis is segmented into fuel type, type, technology, and capacity. By fuel type, the market is divided into coal-fired boilers, gas-fired boilers, oil-fired boilers, and others. By type, the market is classified into pulverized boilers, circulating fluidized boilers, and others. By technology, the market is categorized into subcritical, supercritical, and ultra-supercritical. By capacity, the market is fragmented into less than 400 MW, 400-800 MW, and more than 800 MW. By region, the market is analyzed across North America, Europe, Asia-Pacific, and LAMEA.
The North America market for power plant boilers is expanding rapidly. In the U.S., the demand for efficient and reliable power generation systems is driving growth, with favorable policies for renewable energy and advancements in technology. Researchers in the U.S. are utilizing digital solutions to optimize operations and reduce downtime.
Canada is investing heavily in power generation infrastructure, including power plant boilers, to meet the increase in demand for energy from major industrial sectors such as mining, forestry, and manufacturing. In Mexico, the growing economy is fueling demand for power plant boilers, with the country's energy requirements on the rise. Overall, the power plant boiler market in North America is poised for significant growth, with technology advancements and increase in demand for cost-effective and reliable power generation driving the trend.
Key players in the power plant boiler industry are: General Electric (GE), Siemens AG, Babcock & Wilcox Enterprises, Inc., Mitsubishi Hitachi Power Systems, Ltd., Doosan Heavy Industries & Construction Co., Ltd., Bharat Heavy Electricals Limited (BHEL), Alstom SA, Harbin Electric Corporation, Dongfang Electric Corporation Limited, and Kawasaki Heavy Industries, Ltd. These players have adopted various strategies to gain a higher share or retain leading positions in the market.
Impact of COVID-19 on the global power plant boiler market
The decrease in energy demand resulted in a decrease in the demand for power plant boilers. Furthermore, the supply chain disruptions and labor shortages caused by the pandemic impacted the manufacturing and construction of power plant boilers. Project delays and cancellations due to the uncertain economic environment also led to a slowdown in market growth. The COVID-19 pandemic has had a short-term impact on the power plant boiler market, but the long-term outlook for the market remains positive.
The market post-pandemic period is driven by factors such as rising energy demand, increasing focus on reducing greenhouse gas emissions, and government initiatives promoting renewable energy sources. The adoption of digital technologies and the use of advanced materials in power plant boilers are expected to drive innovation and improve the efficiency of power plant operations. The power plant boiler market is expected to play a critical role in the global transition toward a more sustainable and energy-efficient future.
Key Benefits For Stakeholders
- This report provides a quantitative analysis of the market segments, current trends, estimations, and dynamics of the power plant boiler market analysis from 2021 to 2031 to identify the prevailing power plant boiler market opportunities.
- The market research is offered along with information related to key drivers, restraints, and opportunities.
- Porter's five forces analysis highlights the potency of buyers and suppliers to enable stakeholders make profit-oriented business decisions and strengthen their supplier-buyer network.
- In-depth analysis of the power plant boiler market segmentation assists to determine the prevailing market opportunities.
- Major countries in each region are mapped according to their revenue contribution to the global market.
- Market player positioning facilitates benchmarking and provides a clear understanding of the present position of the market players.
- The report includes the analysis of the regional as well as global power plant boiler market trends, key players, market segments, application areas, and market growth strategies.
Key Market Segments
By Fuel Type
- Coal-Fired Boilers
- Gas-Fired Boilers
- Oil-Fired Boilers
- Others
By Type
- Pulverized Boilers
- Circulating Fluidized Boilers
- Others
By Technology
- Subcritical
- Supercritical
- Ultra-supercritical
By Capacity
- Less than 400 MW
- 400-800 MW
- More than 800 MW
By Region
- North America
- U.S.
- Canada
- Mexico
- Europe
- Germany
- France
- Italy
- Spain
- UK
- Rest of Europe
- Asia-Pacific
- China
- Japan
- India
- South Korea
- Australia
- Rest of Asia-Pacific
- LAMEA
- Brazil
- Saudi Arabia
- South Africa
- Rest of LAMEA
Key Market Players:
- General Electric
- Siemens AG
- Babcock & Wilcox Enterprises, Inc.
- Bharat Heavy Electricals Limited
- Alstom SA
- Harbin Electric Corporation
- Doosan Corp.
- Kawasaki Heavy Industries, Ltd.
- Dongfang Electric Corporation Limited
- Mitsubishi Hitachi Power Systems, Ltd.
TABLE OF CONTENTS
CHAPTER 1: INTRODUCTION
- 1.1. Report description
- 1.2. Key market segments
- 1.3. Key benefits to the stakeholders
- 1.4. Research Methodology
- 1.4.1. Primary research
- 1.4.2. Secondary research
- 1.4.3. Analyst tools and models
CHAPTER 2: EXECUTIVE SUMMARY
- 2.1. CXO Perspective
CHAPTER 3: MARKET OVERVIEW
- 3.1. Market definition and scope
- 3.2. Key findings
- 3.2.1. Top impacting factors
- 3.2.2. Top investment pockets
- 3.3. Porter's five forces analysis
- 3.3.1. Bargaining power of suppliers
- 3.3.2. Bargaining power of buyers
- 3.3.3. Threat of substitutes
- 3.3.4. Threat of new entrants
- 3.3.5. Intensity of rivalry
- 3.4. Market dynamics
- 3.4.1. Drivers
- 3.4.1.1. Increase in demand for energy
- 3.4.1.2. Technological advancements in power plant boiler designs and materials
- 3.4.1.3. Rise in awareness of environmental issues and the need for sustainable energy solutions
- 3.4.1. Drivers
- 3.4.2. Restraints
- 3.4.2.1. Limited availability of skilled labor for installation and maintenance
- 3.4.2.2. Fluctuations in fuel prices
- 3.4.3. Opportunities
- 3.4.3.1. Increase in demand for power plant boilers in emerging economies
- 3.5. COVID-19 Impact Analysis on the market
- 3.6. Key Regulation Analysis
- 3.7. Value Chain Analysis
CHAPTER 4: POWER PLANT BOILER MARKET, BY FUEL TYPE
- 4.1. Overview
- 4.1.1. Market size and forecast
- 4.2. Coal-Fired Boilers
- 4.2.1. Key market trends, growth factors and opportunities
- 4.2.2. Market size and forecast, by region
- 4.2.3. Market share analysis by country
- 4.3. Gas-Fired Boilers
- 4.3.1. Key market trends, growth factors and opportunities
- 4.3.2. Market size and forecast, by region
- 4.3.3. Market share analysis by country
- 4.4. Oil-Fired Boilers
- 4.4.1. Key market trends, growth factors and opportunities
- 4.4.2. Market size and forecast, by region
- 4.4.3. Market share analysis by country
- 4.5. Others
- 4.5.1. Key market trends, growth factors and opportunities
- 4.5.2. Market size and forecast, by region
- 4.5.3. Market share analysis by country
CHAPTER 5: POWER PLANT BOILER MARKET, BY TYPE
- 5.1. Overview
- 5.1.1. Market size and forecast
- 5.2. Pulverized Boilers
- 5.2.1. Key market trends, growth factors and opportunities
- 5.2.2. Market size and forecast, by region
- 5.2.3. Market share analysis by country
- 5.3. Circulating Fluidized Boilers
- 5.3.1. Key market trends, growth factors and opportunities
- 5.3.2. Market size and forecast, by region
- 5.3.3. Market share analysis by country
- 5.4. Others
- 5.4.1. Key market trends, growth factors and opportunities
- 5.4.2. Market size and forecast, by region
- 5.4.3. Market share analysis by country
CHAPTER 6: POWER PLANT BOILER MARKET, BY TECHNOLOGY
- 6.1. Overview
- 6.1.1. Market size and forecast
- 6.2. Subcritical
- 6.2.1. Key market trends, growth factors and opportunities
- 6.2.2. Market size and forecast, by region
- 6.2.3. Market share analysis by country
- 6.3. Supercritical
- 6.3.1. Key market trends, growth factors and opportunities
- 6.3.2. Market size and forecast, by region
- 6.3.3. Market share analysis by country
- 6.4. Ultra-supercritical
- 6.4.1. Key market trends, growth factors and opportunities
- 6.4.2. Market size and forecast, by region
- 6.4.3. Market share analysis by country
CHAPTER 7: POWER PLANT BOILER MARKET, BY CAPACITY
- 7.1. Overview
- 7.1.1. Market size and forecast
- 7.2. Less than 400 MW
- 7.2.1. Key market trends, growth factors and opportunities
- 7.2.2. Market size and forecast, by region
- 7.2.3. Market share analysis by country
- 7.3. 400-800 MW
- 7.3.1. Key market trends, growth factors and opportunities
- 7.3.2. Market size and forecast, by region
- 7.3.3. Market share analysis by country
- 7.4. More than 800 MW
- 7.4.1. Key market trends, growth factors and opportunities
- 7.4.2. Market size and forecast, by region
- 7.4.3. Market share analysis by country
CHAPTER 8: POWER PLANT BOILER MARKET, BY REGION
- 8.1. Overview
- 8.1.1. Market size and forecast By Region
- 8.2. North America
- 8.2.1. Key trends and opportunities
- 8.2.2. Market size and forecast, by Fuel Type
- 8.2.3. Market size and forecast, by Type
- 8.2.4. Market size and forecast, by Technology
- 8.2.5. Market size and forecast, by Capacity
- 8.2.6. Market size and forecast, by country
- 8.2.6.1. U.S.
- 8.2.6.1.1. Key market trends, growth factors and opportunities
- 8.2.6.1.2. Market size and forecast, by Fuel Type
- 8.2.6.1.3. Market size and forecast, by Type
- 8.2.6.1.4. Market size and forecast, by Technology
- 8.2.6.1.5. Market size and forecast, by Capacity
- 8.2.6.2. Canada
- 8.2.6.2.1. Key market trends, growth factors and opportunities
- 8.2.6.2.2. Market size and forecast, by Fuel Type
- 8.2.6.2.3. Market size and forecast, by Type
- 8.2.6.2.4. Market size and forecast, by Technology
- 8.2.6.2.5. Market size and forecast, by Capacity
- 8.2.6.3. Mexico
- 8.2.6.3.1. Key market trends, growth factors and opportunities
- 8.2.6.3.2. Market size and forecast, by Fuel Type
- 8.2.6.3.3. Market size and forecast, by Type
- 8.2.6.3.4. Market size and forecast, by Technology
- 8.2.6.3.5. Market size and forecast, by Capacity
- 8.3. Europe
- 8.3.1. Key trends and opportunities
- 8.3.2. Market size and forecast, by Fuel Type
- 8.3.3. Market size and forecast, by Type
- 8.3.4. Market size and forecast, by Technology
- 8.3.5. Market size and forecast, by Capacity
- 8.3.6. Market size and forecast, by country
- 8.3.6.1. Germany
- 8.3.6.1.1. Key market trends, growth factors and opportunities
- 8.3.6.1.2. Market size and forecast, by Fuel Type
- 8.3.6.1.3. Market size and forecast, by Type
- 8.3.6.1.4. Market size and forecast, by Technology
- 8.3.6.1.5. Market size and forecast, by Capacity
- 8.3.6.2. France
- 8.3.6.2.1. Key market trends, growth factors and opportunities
- 8.3.6.2.2. Market size and forecast, by Fuel Type
- 8.3.6.2.3. Market size and forecast, by Type
- 8.3.6.2.4. Market size and forecast, by Technology
- 8.3.6.2.5. Market size and forecast, by Capacity
- 8.3.6.3. Italy
- 8.3.6.3.1. Key market trends, growth factors and opportunities
- 8.3.6.3.2. Market size and forecast, by Fuel Type
- 8.3.6.3.3. Market size and forecast, by Type
- 8.3.6.3.4. Market size and forecast, by Technology
- 8.3.6.3.5. Market size and forecast, by Capacity
- 8.3.6.4. Spain
- 8.3.6.4.1. Key market trends, growth factors and opportunities
- 8.3.6.4.2. Market size and forecast, by Fuel Type
- 8.3.6.4.3. Market size and forecast, by Type
- 8.3.6.4.4. Market size and forecast, by Technology
- 8.3.6.4.5. Market size and forecast, by Capacity
- 8.3.6.5. UK
- 8.3.6.5.1. Key market trends, growth factors and opportunities
- 8.3.6.5.2. Market size and forecast, by Fuel Type
- 8.3.6.5.3. Market size and forecast, by Type
- 8.3.6.5.4. Market size and forecast, by Technology
- 8.3.6.5.5. Market size and forecast, by Capacity
- 8.3.6.6. Rest of Europe
- 8.3.6.6.1. Key market trends, growth factors and opportunities
- 8.3.6.6.2. Market size and forecast, by Fuel Type
- 8.3.6.6.3. Market size and forecast, by Type
- 8.3.6.6.4. Market size and forecast, by Technology
- 8.3.6.6.5. Market size and forecast, by Capacity
- 8.4. Asia-Pacific
- 8.4.1. Key trends and opportunities
- 8.4.2. Market size and forecast, by Fuel Type
- 8.4.3. Market size and forecast, by Type
- 8.4.4. Market size and forecast, by Technology
- 8.4.5. Market size and forecast, by Capacity
- 8.4.6. Market size and forecast, by country
- 8.4.6.1. China
- 8.4.6.1.1. Key market trends, growth factors and opportunities
- 8.4.6.1.2. Market size and forecast, by Fuel Type
- 8.4.6.1.3. Market size and forecast, by Type
- 8.4.6.1.4. Market size and forecast, by Technology
- 8.4.6.1.5. Market size and forecast, by Capacity
- 8.4.6.2. Japan
- 8.4.6.2.1. Key market trends, growth factors and opportunities
- 8.4.6.2.2. Market size and forecast, by Fuel Type
- 8.4.6.2.3. Market size and forecast, by Type
- 8.4.6.2.4. Market size and forecast, by Technology
- 8.4.6.2.5. Market size and forecast, by Capacity
- 8.4.6.3. India
- 8.4.6.3.1. Key market trends, growth factors and opportunities
- 8.4.6.3.2. Market size and forecast, by Fuel Type
- 8.4.6.3.3. Market size and forecast, by Type
- 8.4.6.3.4. Market size and forecast, by Technology
- 8.4.6.3.5. Market size and forecast, by Capacity
- 8.4.6.4. South Korea
- 8.4.6.4.1. Key market trends, growth factors and opportunities
- 8.4.6.4.2. Market size and forecast, by Fuel Type
- 8.4.6.4.3. Market size and forecast, by Type
- 8.4.6.4.4. Market size and forecast, by Technology
- 8.4.6.4.5. Market size and forecast, by Capacity
- 8.4.6.5. Australia
- 8.4.6.5.1. Key market trends, growth factors and opportunities
- 8.4.6.5.2. Market size and forecast, by Fuel Type
- 8.4.6.5.3. Market size and forecast, by Type
- 8.4.6.5.4. Market size and forecast, by Technology
- 8.4.6.5.5. Market size and forecast, by Capacity
- 8.4.6.6. Rest of Asia-Pacific
- 8.4.6.6.1. Key market trends, growth factors and opportunities
- 8.4.6.6.2. Market size and forecast, by Fuel Type
- 8.4.6.6.3. Market size and forecast, by Type
- 8.4.6.6.4. Market size and forecast, by Technology
- 8.4.6.6.5. Market size and forecast, by Capacity
- 8.5. LAMEA
- 8.5.1. Key trends and opportunities
- 8.5.2. Market size and forecast, by Fuel Type
- 8.5.3. Market size and forecast, by Type
- 8.5.4. Market size and forecast, by Technology
- 8.5.5. Market size and forecast, by Capacity
- 8.5.6. Market size and forecast, by country
- 8.5.6.1. Brazil
- 8.5.6.1.1. Key market trends, growth factors and opportunities
- 8.5.6.1.2. Market size and forecast, by Fuel Type
- 8.5.6.1.3. Market size and forecast, by Type
- 8.5.6.1.4. Market size and forecast, by Technology
- 8.5.6.1.5. Market size and forecast, by Capacity
- 8.5.6.2. Saudi Arabia
- 8.5.6.2.1. Key market trends, growth factors and opportunities
- 8.5.6.2.2. Market size and forecast, by Fuel Type
- 8.5.6.2.3. Market size and forecast, by Type
- 8.5.6.2.4. Market size and forecast, by Technology
- 8.5.6.2.5. Market size and forecast, by Capacity
- 8.5.6.3. South Africa
- 8.5.6.3.1. Key market trends, growth factors and opportunities
- 8.5.6.3.2. Market size and forecast, by Fuel Type
- 8.5.6.3.3. Market size and forecast, by Type
- 8.5.6.3.4. Market size and forecast, by Technology
- 8.5.6.3.5. Market size and forecast, by Capacity
- 8.5.6.4. Rest of LAMEA
- 8.5.6.4.1. Key market trends, growth factors and opportunities
- 8.5.6.4.2. Market size and forecast, by Fuel Type
- 8.5.6.4.3. Market size and forecast, by Type
- 8.5.6.4.4. Market size and forecast, by Technology
- 8.5.6.4.5. Market size and forecast, by Capacity
CHAPTER 9: COMPETITIVE LANDSCAPE
- 9.1. Introduction
- 9.2. Top winning strategies
- 9.3. Product Mapping of Top 10 Player
- 9.4. Competitive Dashboard
- 9.5. Competitive Heatmap
- 9.6. Top player positioning, 2021
CHAPTER 10: COMPANY PROFILES
- 10.1. General Electric
- 10.1.1. Company overview
- 10.1.2. Key Executives
- 10.1.3. Company snapshot
- 10.1.4. Operating business segments
- 10.1.5. Product portfolio
- 10.1.6. Business performance
- 10.2. Siemens AG
- 10.2.1. Company overview
- 10.2.2. Key Executives
- 10.2.3. Company snapshot
- 10.2.4. Operating business segments
- 10.2.5. Product portfolio
- 10.2.6. Business performance
- 10.3. Babcock & Wilcox Enterprises, Inc.
- 10.3.1. Company overview
- 10.3.2. Key Executives
- 10.3.3. Company snapshot
- 10.3.4. Operating business segments
- 10.3.5. Product portfolio
- 10.3.6. Business performance
- 10.3.7. Key strategic moves and developments
- 10.4. Mitsubishi Hitachi Power Systems, Ltd.
- 10.4.1. Company overview
- 10.4.2. Key Executives
- 10.4.3. Company snapshot
- 10.4.4. Operating business segments
- 10.4.5. Product portfolio
- 10.5. Doosan Corp.
- 10.5.1. Company overview
- 10.5.2. Key Executives
- 10.5.3. Company snapshot
- 10.5.4. Operating business segments
- 10.5.5. Product portfolio
- 10.5.6. Business performance
- 10.5.7. Key strategic moves and developments
- 10.6. Bharat Heavy Electricals Limited
- 10.6.1. Company overview
- 10.6.2. Key Executives
- 10.6.3. Company snapshot
- 10.6.4. Operating business segments
- 10.6.5. Product portfolio
- 10.6.6. Business performance
- 10.6.7. Key strategic moves and developments
- 10.7. Alstom SA
- 10.7.1. Company overview
- 10.7.2. Key Executives
- 10.7.3. Company snapshot
- 10.7.4. Operating business segments
- 10.7.5. Product portfolio
- 10.7.6. Business performance
- 10.8. Harbin Electric Corporation
- 10.8.1. Company overview
- 10.8.2. Key Executives
- 10.8.3. Company snapshot
- 10.8.4. Operating business segments
- 10.8.5. Product portfolio
- 10.8.6. Business performance
- 10.9. Dongfang Electric Corporation Limited
- 10.9.1. Company overview
- 10.9.2. Key Executives
- 10.9.3. Company snapshot
- 10.9.4. Operating business segments
- 10.9.5. Product portfolio
- 10.9.6. Business performance
- 10.10. Kawasaki Heavy Industries, Ltd.
- 10.10.1. Company overview
- 10.10.2. Key Executives
- 10.10.3. Company snapshot
- 10.10.4. Operating business segments
- 10.10.5. Product portfolio
- 10.10.6. Business performance
LIST OF TABLES
- TABLE 01. GLOBAL POWER PLANT BOILER MARKET, BY FUEL TYPE, 2021-2031 ($MILLION)
- TABLE 02. POWER PLANT BOILER MARKET FOR COAL-FIRED BOILERS, BY REGION, 2021-2031 ($MILLION)
- TABLE 03. POWER PLANT BOILER MARKET FOR GAS-FIRED BOILERS, BY REGION, 2021-2031 ($MILLION)
- TABLE 04. POWER PLANT BOILER MARKET FOR OIL-FIRED BOILERS, BY REGION, 2021-2031 ($MILLION)
- TABLE 05. POWER PLANT BOILER MARKET FOR OTHERS, BY REGION, 2021-2031 ($MILLION)
- TABLE 06. GLOBAL POWER PLANT BOILER MARKET, BY TYPE, 2021-2031 ($MILLION)
- TABLE 07. POWER PLANT BOILER MARKET FOR PULVERIZED BOILERS, BY REGION, 2021-2031 ($MILLION)
- TABLE 08. POWER PLANT BOILER MARKET FOR CIRCULATING FLUIDIZED BOILERS, BY REGION, 2021-2031 ($MILLION)
- TABLE 09. POWER PLANT BOILER MARKET FOR OTHERS, BY REGION, 2021-2031 ($MILLION)
- TABLE 10. GLOBAL POWER PLANT BOILER MARKET, BY TECHNOLOGY, 2021-2031 ($MILLION)
- TABLE 11. POWER PLANT BOILER MARKET FOR SUBCRITICAL, BY REGION, 2021-2031 ($MILLION)
- TABLE 12. POWER PLANT BOILER MARKET FOR SUPERCRITICAL, BY REGION, 2021-2031 ($MILLION)
- TABLE 13. POWER PLANT BOILER MARKET FOR ULTRA-SUPERCRITICAL, BY REGION, 2021-2031 ($MILLION)
- TABLE 14. GLOBAL POWER PLANT BOILER MARKET, BY CAPACITY, 2021-2031 ($MILLION)
- TABLE 15. POWER PLANT BOILER MARKET FOR LESS THAN 400 MW, BY REGION, 2021-2031 ($MILLION)
- TABLE 16. POWER PLANT BOILER MARKET FOR 400-800 MW, BY REGION, 2021-2031 ($MILLION)
- TABLE 17. POWER PLANT BOILER MARKET FOR MORE THAN 800 MW, BY REGION, 2021-2031 ($MILLION)
- TABLE 18. POWER PLANT BOILER MARKET, BY REGION, 2021-2031 ($MILLION)
- TABLE 19. NORTH AMERICA POWER PLANT BOILER MARKET, BY FUEL TYPE, 2021-2031 ($MILLION)
- TABLE 20. NORTH AMERICA POWER PLANT BOILER MARKET, BY TYPE, 2021-2031 ($MILLION)
- TABLE 21. NORTH AMERICA POWER PLANT BOILER MARKET, BY TECHNOLOGY, 2021-2031 ($MILLION)
- TABLE 22. NORTH AMERICA POWER PLANT BOILER MARKET, BY CAPACITY, 2021-2031 ($MILLION)
- TABLE 23. NORTH AMERICA POWER PLANT BOILER MARKET, BY COUNTRY, 2021-2031 ($MILLION)
- TABLE 24. U.S. POWER PLANT BOILER MARKET, BY FUEL TYPE, 2021-2031 ($MILLION)
- TABLE 25. U.S. POWER PLANT BOILER MARKET, BY TYPE, 2021-2031 ($MILLION)
- TABLE 26. U.S. POWER PLANT BOILER MARKET, BY TECHNOLOGY, 2021-2031 ($MILLION)
- TABLE 27. U.S. POWER PLANT BOILER MARKET, BY CAPACITY, 2021-2031 ($MILLION)
- TABLE 28. CANADA POWER PLANT BOILER MARKET, BY FUEL TYPE, 2021-2031 ($MILLION)
- TABLE 29. CANADA POWER PLANT BOILER MARKET, BY TYPE, 2021-2031 ($MILLION)
- TABLE 30. CANADA POWER PLANT BOILER MARKET, BY TECHNOLOGY, 2021-2031 ($MILLION)
- TABLE 31. CANADA POWER PLANT BOILER MARKET, BY CAPACITY, 2021-2031 ($MILLION)
- TABLE 32. MEXICO POWER PLANT BOILER MARKET, BY FUEL TYPE, 2021-2031 ($MILLION)
- TABLE 33. MEXICO POWER PLANT BOILER MARKET, BY TYPE, 2021-2031 ($MILLION)
- TABLE 34. MEXICO POWER PLANT BOILER MARKET, BY TECHNOLOGY, 2021-2031 ($MILLION)
- TABLE 35. MEXICO POWER PLANT BOILER MARKET, BY CAPACITY, 2021-2031 ($MILLION)
- TABLE 36. EUROPE POWER PLANT BOILER MARKET, BY FUEL TYPE, 2021-2031 ($MILLION)
- TABLE 37. EUROPE POWER PLANT BOILER MARKET, BY TYPE, 2021-2031 ($MILLION)
- TABLE 38. EUROPE POWER PLANT BOILER MARKET, BY TECHNOLOGY, 2021-2031 ($MILLION)
- TABLE 39. EUROPE POWER PLANT BOILER MARKET, BY CAPACITY, 2021-2031 ($MILLION)
- TABLE 40. EUROPE POWER PLANT BOILER MARKET, BY COUNTRY, 2021-2031 ($MILLION)
- TABLE 41. GERMANY POWER PLANT BOILER MARKET, BY FUEL TYPE, 2021-2031 ($MILLION)
- TABLE 42. GERMANY POWER PLANT BOILER MARKET, BY TYPE, 2021-2031 ($MILLION)
- TABLE 43. GERMANY POWER PLANT BOILER MARKET, BY TECHNOLOGY, 2021-2031 ($MILLION)
- TABLE 44. GERMANY POWER PLANT BOILER MARKET, BY CAPACITY, 2021-2031 ($MILLION)
- TABLE 45. FRANCE POWER PLANT BOILER MARKET, BY FUEL TYPE, 2021-2031 ($MILLION)
- TABLE 46. FRANCE POWER PLANT BOILER MARKET, BY TYPE, 2021-2031 ($MILLION)
- TABLE 47. FRANCE POWER PLANT BOILER MARKET, BY TECHNOLOGY, 2021-2031 ($MILLION)
- TABLE 48. FRANCE POWER PLANT BOILER MARKET, BY CAPACITY, 2021-2031 ($MILLION)
- TABLE 49. ITALY POWER PLANT BOILER MARKET, BY FUEL TYPE, 2021-2031 ($MILLION)
- TABLE 50. ITALY POWER PLANT BOILER MARKET, BY TYPE, 2021-2031 ($MILLION)
- TABLE 51. ITALY POWER PLANT BOILER MARKET, BY TECHNOLOGY, 2021-2031 ($MILLION)
- TABLE 52. ITALY POWER PLANT BOILER MARKET, BY CAPACITY, 2021-2031 ($MILLION)
- TABLE 53. SPAIN POWER PLANT BOILER MARKET, BY FUEL TYPE, 2021-2031 ($MILLION)
- TABLE 54. SPAIN POWER PLANT BOILER MARKET, BY TYPE, 2021-2031 ($MILLION)
- TABLE 55. SPAIN POWER PLANT BOILER MARKET, BY TECHNOLOGY, 2021-2031 ($MILLION)
- TABLE 56. SPAIN POWER PLANT BOILER MARKET, BY CAPACITY, 2021-2031 ($MILLION)
- TABLE 57. UK POWER PLANT BOILER MARKET, BY FUEL TYPE, 2021-2031 ($MILLION)
- TABLE 58. UK POWER PLANT BOILER MARKET, BY TYPE, 2021-2031 ($MILLION)
- TABLE 59. UK POWER PLANT BOILER MARKET, BY TECHNOLOGY, 2021-2031 ($MILLION)
- TABLE 60. UK POWER PLANT BOILER MARKET, BY CAPACITY, 2021-2031 ($MILLION)
- TABLE 61. REST OF EUROPE POWER PLANT BOILER MARKET, BY FUEL TYPE, 2021-2031 ($MILLION)
- TABLE 62. REST OF EUROPE POWER PLANT BOILER MARKET, BY TYPE, 2021-2031 ($MILLION)
- TABLE 63. REST OF EUROPE POWER PLANT BOILER MARKET, BY TECHNOLOGY, 2021-2031 ($MILLION)
- TABLE 64. REST OF EUROPE POWER PLANT BOILER MARKET, BY CAPACITY, 2021-2031 ($MILLION)
- TABLE 65. ASIA-PACIFIC POWER PLANT BOILER MARKET, BY FUEL TYPE, 2021-2031 ($MILLION)
- TABLE 66. ASIA-PACIFIC POWER PLANT BOILER MARKET, BY TYPE, 2021-2031 ($MILLION)
- TABLE 67. ASIA-PACIFIC POWER PLANT BOILER MARKET, BY TECHNOLOGY, 2021-2031 ($MILLION)
- TABLE 68. ASIA-PACIFIC POWER PLANT BOILER MARKET, BY CAPACITY, 2021-2031 ($MILLION)
- TABLE 69. ASIA-PACIFIC POWER PLANT BOILER MARKET, BY COUNTRY, 2021-2031 ($MILLION)
- TABLE 70. CHINA POWER PLANT BOILER MARKET, BY FUEL TYPE, 2021-2031 ($MILLION)
- TABLE 71. CHINA POWER PLANT BOILER MARKET, BY TYPE, 2021-2031 ($MILLION)
- TABLE 72. CHINA POWER PLANT BOILER MARKET, BY TECHNOLOGY, 2021-2031 ($MILLION)
- TABLE 73. CHINA POWER PLANT BOILER MARKET, BY CAPACITY, 2021-2031 ($MILLION)
- TABLE 74. JAPAN POWER PLANT BOILER MARKET, BY FUEL TYPE, 2021-2031 ($MILLION)
- TABLE 75. JAPAN POWER PLANT BOILER MARKET, BY TYPE, 2021-2031 ($MILLION)
- TABLE 76. JAPAN POWER PLANT BOILER MARKET, BY TECHNOLOGY, 2021-2031 ($MILLION)
- TABLE 77. JAPAN POWER PLANT BOILER MARKET, BY CAPACITY, 2021-2031 ($MILLION)
- TABLE 78. INDIA POWER PLANT BOILER MARKET, BY FUEL TYPE, 2021-2031 ($MILLION)
- TABLE 79. INDIA POWER PLANT BOILER MARKET, BY TYPE, 2021-2031 ($MILLION)
- TABLE 80. INDIA POWER PLANT BOILER MARKET, BY TECHNOLOGY, 2021-2031 ($MILLION)
- TABLE 81. INDIA POWER PLANT BOILER MARKET, BY CAPACITY, 2021-2031 ($MILLION)
- TABLE 82. SOUTH KOREA POWER PLANT BOILER MARKET, BY FUEL TYPE, 2021-2031 ($MILLION)
- TABLE 83. SOUTH KOREA POWER PLANT BOILER MARKET, BY TYPE, 2021-2031 ($MILLION)
- TABLE 84. SOUTH KOREA POWER PLANT BOILER MARKET, BY TECHNOLOGY, 2021-2031 ($MILLION)
- TABLE 85. SOUTH KOREA POWER PLANT BOILER MARKET, BY CAPACITY, 2021-2031 ($MILLION)
- TABLE 86. AUSTRALIA POWER PLANT BOILER MARKET, BY FUEL TYPE, 2021-2031 ($MILLION)
- TABLE 87. AUSTRALIA POWER PLANT BOILER MARKET, BY TYPE, 2021-2031 ($MILLION)
- TABLE 88. AUSTRALIA POWER PLANT BOILER MARKET, BY TECHNOLOGY, 2021-2031 ($MILLION)
- TABLE 89. AUSTRALIA POWER PLANT BOILER MARKET, BY CAPACITY, 2021-2031 ($MILLION)
- TABLE 90. REST OF ASIA-PACIFIC POWER PLANT BOILER MARKET, BY FUEL TYPE, 2021-2031 ($MILLION)
- TABLE 91. REST OF ASIA-PACIFIC POWER PLANT BOILER MARKET, BY TYPE, 2021-2031 ($MILLION)
- TABLE 92. REST OF ASIA-PACIFIC POWER PLANT BOILER MARKET, BY TECHNOLOGY, 2021-2031 ($MILLION)
- TABLE 93. REST OF ASIA-PACIFIC POWER PLANT BOILER MARKET, BY CAPACITY, 2021-2031 ($MILLION)
- TABLE 94. LAMEA POWER PLANT BOILER MARKET, BY FUEL TYPE, 2021-2031 ($MILLION)
- TABLE 95. LAMEA POWER PLANT BOILER MARKET, BY TYPE, 2021-2031 ($MILLION)
- TABLE 96. LAMEA POWER PLANT BOILER MARKET, BY TECHNOLOGY, 2021-2031 ($MILLION)
- TABLE 97. LAMEA POWER PLANT BOILER MARKET, BY CAPACITY, 2021-2031 ($MILLION)
- TABLE 98. LAMEA POWER PLANT BOILER MARKET, BY COUNTRY, 2021-2031 ($MILLION)
- TABLE 99. BRAZIL POWER PLANT BOILER MARKET, BY FUEL TYPE, 2021-2031 ($MILLION)
- TABLE 100. BRAZIL POWER PLANT BOILER MARKET, BY TYPE, 2021-2031 ($MILLION)
- TABLE 101. BRAZIL POWER PLANT BOILER MARKET, BY TECHNOLOGY, 2021-2031 ($MILLION)
- TABLE 102. BRAZIL POWER PLANT BOILER MARKET, BY CAPACITY, 2021-2031 ($MILLION)
- TABLE 103. SAUDI ARABIA POWER PLANT BOILER MARKET, BY FUEL TYPE, 2021-2031 ($MILLION)
- TABLE 104. SAUDI ARABIA POWER PLANT BOILER MARKET, BY TYPE, 2021-2031 ($MILLION)
- TABLE 105. SAUDI ARABIA POWER PLANT BOILER MARKET, BY TECHNOLOGY, 2021-2031 ($MILLION)
- TABLE 106. SAUDI ARABIA POWER PLANT BOILER MARKET, BY CAPACITY, 2021-2031 ($MILLION)
- TABLE 107. SOUTH AFRICA POWER PLANT BOILER MARKET, BY FUEL TYPE, 2021-2031 ($MILLION)
- TABLE 108. SOUTH AFRICA POWER PLANT BOILER MARKET, BY TYPE, 2021-2031 ($MILLION)
- TABLE 109. SOUTH AFRICA POWER PLANT BOILER MARKET, BY TECHNOLOGY, 2021-2031 ($MILLION)
- TABLE 110. SOUTH AFRICA POWER PLANT BOILER MARKET, BY CAPACITY, 2021-2031 ($MILLION)
- TABLE 111. REST OF LAMEA POWER PLANT BOILER MARKET, BY FUEL TYPE, 2021-2031 ($MILLION)
- TABLE 112. REST OF LAMEA POWER PLANT BOILER MARKET, BY TYPE, 2021-2031 ($MILLION)
- TABLE 113. REST OF LAMEA POWER PLANT BOILER MARKET, BY TECHNOLOGY, 2021-2031 ($MILLION)
- TABLE 114. REST OF LAMEA POWER PLANT BOILER MARKET, BY CAPACITY, 2021-2031 ($MILLION)
- TABLE 115. GENERAL ELECTRIC: KEY EXECUTIVES
- TABLE 116. GENERAL ELECTRIC: COMPANY SNAPSHOT
- TABLE 117. GENERAL ELECTRIC: SERVICE SEGMENTS
- TABLE 118. GENERAL ELECTRIC: PRODUCT PORTFOLIO
- TABLE 119. SIEMENS AG: KEY EXECUTIVES
- TABLE 120. SIEMENS AG: COMPANY SNAPSHOT
- TABLE 121. SIEMENS AG: PRODUCT SEGMENTS
- TABLE 122. SIEMENS AG: PRODUCT PORTFOLIO
- TABLE 123. BABCOCK & WILCOX ENTERPRISES, INC.: KEY EXECUTIVES
- TABLE 124. BABCOCK & WILCOX ENTERPRISES, INC.: COMPANY SNAPSHOT
- TABLE 125. BABCOCK & WILCOX ENTERPRISES, INC.: PRODUCT SEGMENTS
- TABLE 126. BABCOCK & WILCOX ENTERPRISES, INC.: PRODUCT PORTFOLIO
- TABLE 127. BABCOCK & WILCOX ENTERPRISES, INC.: KEY STRATERGIES
- TABLE 128. MITSUBISHI HITACHI POWER SYSTEMS, LTD.: KEY EXECUTIVES
- TABLE 129. MITSUBISHI HITACHI POWER SYSTEMS, LTD.: COMPANY SNAPSHOT
- TABLE 130. MITSUBISHI HITACHI POWER SYSTEMS, LTD.: PRODUCT SEGMENTS
- TABLE 131. MITSUBISHI HITACHI POWER SYSTEMS, LTD.: PRODUCT PORTFOLIO
- TABLE 132. DOOSAN CORP.: KEY EXECUTIVES
- TABLE 133. DOOSAN CORP.: COMPANY SNAPSHOT
- TABLE 134. DOOSAN CORP.: PRODUCT SEGMENTS
- TABLE 135. DOOSAN CORP.: PRODUCT PORTFOLIO
- TABLE 136. DOOSAN CORP.: KEY STRATERGIES
- TABLE 137. BHARAT HEAVY ELECTRICALS LIMITED: KEY EXECUTIVES
- TABLE 138. BHARAT HEAVY ELECTRICALS LIMITED: COMPANY SNAPSHOT
- TABLE 139. BHARAT HEAVY ELECTRICALS LIMITED: PRODUCT SEGMENTS
- TABLE 140. BHARAT HEAVY ELECTRICALS LIMITED: PRODUCT PORTFOLIO
- TABLE 141. BHARAT HEAVY ELECTRICALS LIMITED: KEY STRATERGIES
- TABLE 142. ALSTOM SA: KEY EXECUTIVES
- TABLE 143. ALSTOM SA: COMPANY SNAPSHOT
- TABLE 144. ALSTOM SA: PRODUCT SEGMENTS
- TABLE 145. ALSTOM SA: PRODUCT PORTFOLIO
- TABLE 146. HARBIN ELECTRIC CORPORATION: KEY EXECUTIVES
- TABLE 147. HARBIN ELECTRIC CORPORATION: COMPANY SNAPSHOT
- TABLE 148. HARBIN ELECTRIC CORPORATION: PRODUCT SEGMENTS
- TABLE 149. HARBIN ELECTRIC CORPORATION: PRODUCT PORTFOLIO
- TABLE 150. DONGFANG ELECTRIC CORPORATION LIMITED: KEY EXECUTIVES
- TABLE 151. DONGFANG ELECTRIC CORPORATION LIMITED: COMPANY SNAPSHOT
- TABLE 152. DONGFANG ELECTRIC CORPORATION LIMITED: PRODUCT SEGMENTS
- TABLE 153. DONGFANG ELECTRIC CORPORATION LIMITED: PRODUCT PORTFOLIO
- TABLE 154. KAWASAKI HEAVY INDUSTRIES, LTD.: KEY EXECUTIVES
- TABLE 155. KAWASAKI HEAVY INDUSTRIES, LTD.: COMPANY SNAPSHOT
- TABLE 156. KAWASAKI HEAVY INDUSTRIES, LTD.: PRODUCT SEGMENTS
- TABLE 157. KAWASAKI HEAVY INDUSTRIES, LTD.: PRODUCT PORTFOLIO
LIST OF FIGURES
- FIGURE 01. POWER PLANT BOILER MARKET, 2021-2031
- FIGURE 02. SEGMENTATION OF POWER PLANT BOILER MARKET, 2021-2031
- FIGURE 03. TOP INVESTMENT POCKETS IN POWER PLANT BOILER MARKET (2022-2031)
- FIGURE 04. LOW BARGAINING POWER OF SUPPLIERS
- FIGURE 05. LOW BARGAINING POWER OF BUYERS
- FIGURE 06. LOW THREAT OF SUBSTITUTES
- FIGURE 07. LOW THREAT OF NEW ENTRANTS
- FIGURE 08. LOW INTENSITY OF RIVALRY
- FIGURE 09. DRIVERS, RESTRAINTS AND OPPORTUNITIES: GLOBALPOWER PLANT BOILER MARKET
- FIGURE 10. IMPACT OF KEY REGULATION: POWER PLANT BOILER MARKET
- FIGURE 11. VALUE CHAIN ANALYSIS: POWER PLANT BOILER MARKET
- FIGURE 12. POWER PLANT BOILER MARKET, BY FUEL TYPE, 2021(%)
- FIGURE 13. COMPARATIVE SHARE ANALYSIS OF POWER PLANT BOILER MARKET FOR COAL-FIRED BOILERS, BY COUNTRY 2021 AND 2031(%)
- FIGURE 14. COMPARATIVE SHARE ANALYSIS OF POWER PLANT BOILER MARKET FOR GAS-FIRED BOILERS, BY COUNTRY 2021 AND 2031(%)
- FIGURE 15. COMPARATIVE SHARE ANALYSIS OF POWER PLANT BOILER MARKET FOR OIL-FIRED BOILERS, BY COUNTRY 2021 AND 2031(%)
- FIGURE 16. COMPARATIVE SHARE ANALYSIS OF POWER PLANT BOILER MARKET FOR OTHERS, BY COUNTRY 2021 AND 2031(%)
- FIGURE 17. POWER PLANT BOILER MARKET, BY TYPE, 2021(%)
- FIGURE 18. COMPARATIVE SHARE ANALYSIS OF POWER PLANT BOILER MARKET FOR PULVERIZED BOILERS, BY COUNTRY 2021 AND 2031(%)
- FIGURE 19. COMPARATIVE SHARE ANALYSIS OF POWER PLANT BOILER MARKET FOR CIRCULATING FLUIDIZED BOILERS, BY COUNTRY 2021 AND 2031(%)
- FIGURE 20. COMPARATIVE SHARE ANALYSIS OF POWER PLANT BOILER MARKET FOR OTHERS, BY COUNTRY 2021 AND 2031(%)
- FIGURE 21. POWER PLANT BOILER MARKET, BY TECHNOLOGY, 2021(%)
- FIGURE 22. COMPARATIVE SHARE ANALYSIS OF POWER PLANT BOILER MARKET FOR SUBCRITICAL, BY COUNTRY 2021 AND 2031(%)
- FIGURE 23. COMPARATIVE SHARE ANALYSIS OF POWER PLANT BOILER MARKET FOR SUPERCRITICAL, BY COUNTRY 2021 AND 2031(%)
- FIGURE 24. COMPARATIVE SHARE ANALYSIS OF POWER PLANT BOILER MARKET FOR ULTRA-SUPERCRITICAL, BY COUNTRY 2021 AND 2031(%)
- FIGURE 25. POWER PLANT BOILER MARKET, BY CAPACITY, 2021(%)
- FIGURE 26. COMPARATIVE SHARE ANALYSIS OF POWER PLANT BOILER MARKET FOR LESS THAN 400 MW, BY COUNTRY 2021 AND 2031(%)
- FIGURE 27. COMPARATIVE SHARE ANALYSIS OF POWER PLANT BOILER MARKET FOR 400-800 MW, BY COUNTRY 2021 AND 2031(%)
- FIGURE 28. COMPARATIVE SHARE ANALYSIS OF POWER PLANT BOILER MARKET FOR MORE THAN 800 MW, BY COUNTRY 2021 AND 2031(%)
- FIGURE 29. POWER PLANT BOILER MARKET BY REGION, 2021
- FIGURE 30. U.S. POWER PLANT BOILER MARKET, 2021-2031 ($MILLION)
- FIGURE 31. CANADA POWER PLANT BOILER MARKET, 2021-2031 ($MILLION)
- FIGURE 32. MEXICO POWER PLANT BOILER MARKET, 2021-2031 ($MILLION)
- FIGURE 33. GERMANY POWER PLANT BOILER MARKET, 2021-2031 ($MILLION)
- FIGURE 34. FRANCE POWER PLANT BOILER MARKET, 2021-2031 ($MILLION)
- FIGURE 35. ITALY POWER PLANT BOILER MARKET, 2021-2031 ($MILLION)
- FIGURE 36. SPAIN POWER PLANT BOILER MARKET, 2021-2031 ($MILLION)
- FIGURE 37. UK POWER PLANT BOILER MARKET, 2021-2031 ($MILLION)
- FIGURE 38. REST OF EUROPE POWER PLANT BOILER MARKET, 2021-2031 ($MILLION)
- FIGURE 39. CHINA POWER PLANT BOILER MARKET, 2021-2031 ($MILLION)
- FIGURE 40. JAPAN POWER PLANT BOILER MARKET, 2021-2031 ($MILLION)
- FIGURE 41. INDIA POWER PLANT BOILER MARKET, 2021-2031 ($MILLION)
- FIGURE 42. SOUTH KOREA POWER PLANT BOILER MARKET, 2021-2031 ($MILLION)
- FIGURE 43. AUSTRALIA POWER PLANT BOILER MARKET, 2021-2031 ($MILLION)
- FIGURE 44. REST OF ASIA-PACIFIC POWER PLANT BOILER MARKET, 2021-2031 ($MILLION)
- FIGURE 45. BRAZIL POWER PLANT BOILER MARKET, 2021-2031 ($MILLION)
- FIGURE 46. SAUDI ARABIA POWER PLANT BOILER MARKET, 2021-2031 ($MILLION)
- FIGURE 47. SOUTH AFRICA POWER PLANT BOILER MARKET, 2021-2031 ($MILLION)
- FIGURE 48. REST OF LAMEA POWER PLANT BOILER MARKET, 2021-2031 ($MILLION)
- FIGURE 49. TOP WINNING STRATEGIES, BY YEAR
- FIGURE 50. TOP WINNING STRATEGIES, BY DEVELOPMENT
- FIGURE 51. TOP WINNING STRATEGIES, BY COMPANY
- FIGURE 52. PRODUCT MAPPING OF TOP 10 PLAYERS
- FIGURE 53. COMPETITIVE DASHBOARD
- FIGURE 54. COMPETITIVE HEATMAP: POWER PLANT BOILER MARKET
- FIGURE 55. TOP PLAYER POSITIONING, 2021
- FIGURE 56. GENERAL ELECTRIC: NET REVENUE, 2020-2022 ($MILLION)
- FIGURE 57. GENERAL ELECTRIC: RESEARCH & DEVELOPMENT EXPENDITURE, 2020-2022 ($MILLION)
- FIGURE 58. GENERAL ELECTRIC: REVENUE SHARE BY SEGMENT, 2022 (%)
- FIGURE 59. GENERAL ELECTRIC: REVENUE SHARE BY REGION, 2022 (%)
- FIGURE 60. SIEMENS: NET REVENUE, 2019-2021 ($MILLION)
- FIGURE 61. SIEMENS: REVENUE SHARE BY SEGMENT, 2021 (%)
- FIGURE 62. SIEMENS: REVENUE SHARE BY REGION, 2021 (%)
- FIGURE 63. BABCOCK & WILCOX ENTERPRISES, INC.: NET REVENUE, 2019-2021 ($MILLION)
- FIGURE 64. BABCOCK & WILCOX ENTERPRISES, INC.: RESEARCH & DEVELOPMENT EXPENDITURE, 2019-2021 ($MILLION)
- FIGURE 65. BABCOCK & WILCOX ENTERPRISES, INC.: REVENUE SHARE BY SEGMENT, 2021 (%)
- FIGURE 66. BABCOCK & WILCOX ENTERPRISES, INC.: REVENUE SHARE BY REGION, 2021 (%)
- FIGURE 67. DOOSAN CORP.: NET REVENUE, 2019-2021 ($MILLION)
- FIGURE 68. DOOSAN CORP.: RESEARCH & DEVELOPMENT EXPENDITURE, 2019-2021 ($MILLION)
- FIGURE 69. DOOSAN CORP.: REVENUE SHARE BY SEGMENT, 2021 (%)
- FIGURE 70. DOOSAN CORP.: REVENUE SHARE BY REGION, 2021 (%)
- FIGURE 71. BHARAT HEAVY ELECTRICALS LIMITED: NET REVENUE, 2019-2021 ($MILLION)
- FIGURE 72. BHARAT HEAVY ELECTRICALS LIMITED: REVENUE SHARE BY SEGMENT, 2021 (%)
- FIGURE 73. BHARAT HEAVY ELECTRICALS LIMITED: REVENUE SHARE BY REGION, 2021 (%)
- FIGURE 74. ALSTOM SA: NET SALES, 2020-2022 ($MILLION)
- FIGURE 75. ALSTOM SA: REVENUE SHARE BY SEGMENT, 2022 (%)
- FIGURE 76. ALSTOM SA: REVENUE SHARE BY REGION, 2022 (%)
- FIGURE 77. HARBIN ELECTRIC CORPORATION: NET REVENUE, 2019-2021 ($MILLION)
- FIGURE 78. HARBIN ELECTRIC CORPORATION: RESEARCH & DEVELOPMENT EXPENDITURE, 2019-2021 ($MILLION)
- FIGURE 79. HARBIN ELECTRIC CORPORATION: REVENUE SHARE BY REGION, 2021 (%)
- FIGURE 80. DONGFANG ELECTRIC CORPORATION LIMITED: NET REVENUE, 2019-2021 ($MILLION)
- FIGURE 81. DONGFANG ELECTRIC CORPORATION LIMITED: RESEARCH & DEVELOPMENT EXPENDITURE, 2019-2021 ($MILLION)
- FIGURE 82. DONGFANG ELECTRIC CORPORATION LIMITED: REVENUE SHARE BY SEGMENT, 2021 (%)
- FIGURE 83. DONGFANG ELECTRIC CORPORATION LIMITED: REVENUE SHARE BY REGION, 2021 (%)
- FIGURE 84. KAWASAKI HEAVY INDUSTRIES, LTD.: NET REVENUE, 2020-2022 ($MILLION)
- FIGURE 85. KAWASAKI HEAVY INDUSTRIES, LTD.: RESEARCH & DEVELOPMENT EXPENDITURE, 2020-2022 ($MILLION)
- FIGURE 86. KAWASAKI HEAVY INDUSTRIES, LTD.: REVENUE SHARE BY SEGMENT, 2022 (%)
- FIGURE 87. KAWASAKI HEAVY INDUSTRIES, LTD.: REVENUE SHARE BY REGION, 2022 (%)
 2024-2032 年按類型、技術、燃料類型、輸入容量和地區分類的發電廠鍋爐市場報告
 全球循環流體化床鍋爐市場規模、佔有率、成長分析,依類型(亞臨界、超臨界)、依原料(煤、石油焦)、最終用戶(石油和天然氣、電力)- 2024-2031 年產業預測
 2024-2032 年循環流體化床鍋爐市場(按產品、容量、燃料類型、應用和地區分類)
 迴圈式流體化床(CFB) 鍋爐 2024 年全球市場報告
 循環流體化床鍋爐市場 - 全球產業規模、佔有率、趨勢、機會和預測,按產品、原料、產能、燃料類型、按應用、地區和競爭細分,2018-2028年
 電廠鍋爐市場報告:2030 年趨勢、預測與競爭分析
 2023-2030 年按產品、容量、燃料類型、應用和地區分析的全球循環流化床鍋爐市場規模研究與預測
 發電廠鍋爐市場:按製程、技術、容量、燃料類型分類 - 全球預測 2023-2030
 迴圈式流體化床床鍋爐市場:按產品、容量、燃料類型、用途- 全球預測 2023-2030
 到 2028 年的電廠鍋爐市場預測——按類型、容量、技術、燃料類型和地區進行的全球分析