


 |
市場調查報告書
商品編碼
1250867
運營商中立網絡運營商(CNNO):市場分析(2022 Q4)CNNO將在2022投資超過450億美元,通過資本支出和併購進行擴張,以支持運營商領域快速雲端增長降低成本Carrier-Neutral Network Operators - 4Q22 Market Review: CNNOs Spend Over $45B to Expand via Capex and M&A in 2022, Sector Supports Cloud's Rapid Growth and Telco Cost Cutting |
||||||
到 2022 年,全球運營商中立網絡運營商 (CNNO) 的收入將比 2021 年增長 3.7%,達到 948 億美元。 這遠低於 2016 年至 2022 年 9.5% 的複合年增長率和 2021 年 12.4% 的增幅。
過去 10 年推動 CNNO 行業發展的因素是電信和網絡規模市場的需求、支持債務擴張(併購和資本投資)的低利率(過去)以及實際房地產投資信託(REIT)管理,包括該模式的稅收優惠和由私募股權管理的資產池的增長,這是CNNO的主要資金來源。
圖表示例
本報告探討了全球運營商中立網絡運營商 (CNNO) 市場的最新發展,並對 2011 年至 2022 年期間運營商中立網絡運營商 (CNNNO) 市場的財務和運營進行了深入的回顧(所有 47 家公司).
公司分析:
本報告中分析的公司是:
|
|
內容
- 1.總結
- 2.CNNO板塊概況
- 3. 分析
- 4.
- 5. 關鍵統計數據
- 6.細分市場
- 7.按公司分類
- 8. 企業基準
- 9. 原始數據
- 10. 匯率
- 11.關於 MTN 諮詢
This interactive spreadsheet model is a detailed financial and operational review of the carrier-neutral network operator (CNNO) market for the 2011-2022 period. This report tracks 47 CNNOs across the globe, including 10 focused primarily on bandwidth/fiber infrastructure, 16 data center specialists, and 21 tower CNNOs. The CNNOs in this study have all been publicly held entities and reported audited financials at some point in the 2011-22 timeframe; some are now private, or have been acquired by other CNNOs. Since our last review of this market in 1H22, we have added two companies to our coverage: Helios Towers and DigitalBridge.
VISUALS
CNNOs play an important role in the communications market. They sell independent, carrier-neutral access to network infrastructure, including mobile tower (and small cell/DAS), data center, and bandwidth/fiber assets. In 2022, CNNOs accounted for $95 billion (B) in revenues (+4% YoY), $12.3B in M&A spending (+-72%), $33.0B in capex (+3%), and $251B in net property, plant and equipment (net PP&E; flat YoY). They owned and operated 1,224 data centers, 3.29 million cell towers, and about 961K route miles of fiber. CNNOs employed just over 102.1K people at year-end 2022, a bit down from 102.9K in December 2021.
Market directions
In the old days, telcos did it all: they owned all the network infrastructure, they manufactured the switches and transmission gear deployed in the network, and even provided CPE. That model is long since extinct. The telco of 2023 cobbles together its physical network from a mix of owned and leased or rented resources. Cloud providers in the webscale world do the same; while they spend heavily on capex ($203B last year), they generally lease fiber or transmission bandwidth, and only own a portion of their data centers. For both telcos and webscalers, they rely heavily on third party operators of network infra, or carrier neutral network operators. CNNOs do serve other end markets, including various enterprise verticals (finance, media, and energy), and government. But telcos and webscalers are the biggest targets. CNNOs play a vital role in the network design and cost structure of these operators.
In addition to demand from the telco & webscale markets, other factors driving the development of the CNNO sector over the last decade include: low interest rates (in the past) enabling debt-financed expansion (M&A and capex); the tax advantages of the real estate investment trust (REIT) operating model; and, the growth of the asset pool managed by private equity, a key source of funding for CNNOs.
2022 market was flat
In 2022, the CNNO market stabilized, growing just 4% in revenues, to $94.8B. This is much slower than the 10% average growth seen in the 2016-22 period. Telco and webscaler demand for third-party neutral network infrastructure continues to grow. The business models of CNNOs are mature, and there's lots of new entry in the market. But CNNOs are subject to the same economic headwinds as the rest of tech: rising interest rates, inflation, energy price volatility. Rising interest rates are a particular challenge, as CNNO growth is financed by debt and lots of acquisitions. Based on recent comments from American Tower, this will restrain M&A in 2023.
Energy price volatility is also a factor in slowing growth. Utilities costs are a significant part of total opex for a number of CNNOs. For example, in 2022 utilities amounted to 39% of opex (excluding depreciation) for Digital Realty, 27% for Cellnex, and 53% for Helios Towers. CNNOs pass through a large portion of these costs to their customers, but far from 100%. Rising energy prices hit profitability, they require CNNOs to seek out cheaper alternatives, and entice CNNOs' customers to spend more cautiously. This is a particular challenge for CNNOs as they attempt to develop and implement sustainability strategies. The sector has a heavy carbon footprint, due to the use of diesel in remote cell towers and high power consumption in the data center. An MTN Consulting study published late last year found that CNNOs consumed about 572MWh of power for every US$1M in revenue, in 2021; the figures for telcos and webscalers are 163 and 50, respectively.
Despite 2022's moderating growth, the CNNO sector has been growing steadily over a long period of time. From 2016-22, revenues grew at an average annual growth rate (CAGR) of 10%; net PP&E, +4%; employees, +5%. Between 2018 and 2022, the CNNO sector spent nearly $235 billion on capex and acquisitions, combined. This investment significantly broadened the footprints of the major providers. There continues to be a lot of investor enthusiasm from private equity in spurring more growth, and the sector continues to converge as key players develop assets across the three segments (towers, data centers, and fiber.
Market segmentation and convergence
MTN Consulting simplifies the CNNO market into segments based upon their primary investment focus: towers, data centers, and fiber/bandwidth. However, many CNNOs own multiple types of infrastructure, and this cross-ownership is growing as companies leverage benefits from economies of scope. An influx of investment from asset management funds is also pushing CNNOs towards integrated business models. PE firms are acquiring assets across multiple infra types, and blending them into new, more converged entities. Asset managers with stakes in multiple types of CNNOs include Ardian, Brookfield, Carlyle, Cordiant, EQT, GI Partners, KKR, PAG Real Estate, TPG, and Triple Point. Colony Capital's creation, DigitalBridge, is probably the most mature example of this approach, and illustrative of where the CNNO market may be headed. American Tower's 2021 acquisition of a major data center specialist, CoreSite Realty, is another illustration. One tangible result of the growing integration: out of the CNNO sector's 961K route miles of fiber, we estimate that cell tower specialists (as opposed to bandwidth/fiber specialists) own about 30%, from 21% in 2021. Crown Castle, American Tower, Cellnex, TDF, and Protelindo are among the towercos investing heavily in fiber.
Key findings
Key findings from this 4Q22 Market Review include:
- Revenues: In 2022, global CNNO revenues rose by 3.7% from 2021, to $94.8 billion (B). That's much slower than the 2016-22 CAGR of 9.5% and 2021's 12.4% bump. All three segments saw weaker topline growth in 2022 than 2021, but bandwidth was worst hit with a 10% drop (2021: +4%).
- Capex: CNNO capex ended 2022 at $33.0B, up 3% YoY, resulting in a stable ratio of capex to revenues at about 35%. Eleven different CNNOs spent over $1B on capex in 2022, with China Tower leading the pack at $5.0B, followed by Cellnex ($2.7B), Digital Realty ($2.6B), Equinix ($2.3B), and NBN and American Tower (both $1.9B). Note that both DRT and Equinix spend capex beyond what is reported via joint venture investment vehicles.
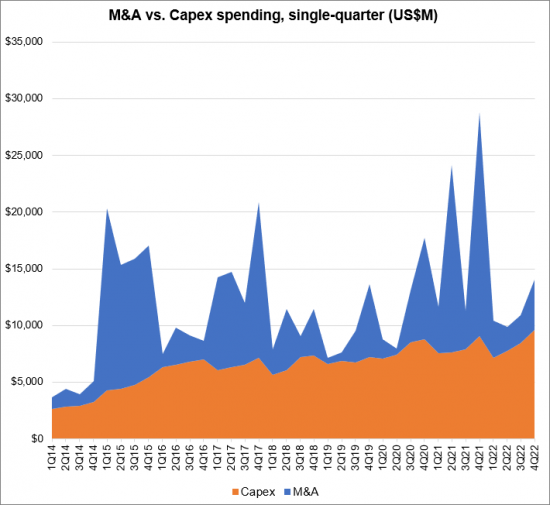
- M&A spending: CNNOs often spend more on M&A than capex, and that was true in 2021, but M&A was quiet in 2022: capex easily outpaced M&A, at $33.0B in capex vs. $14.9B in M&A spend. One factor is a high level of M&A in 2021 by the two most active acquirers, ATC and Cellnex. Cellnex, Digital Realty, and SBA spent the most on M&A in 2022. Cellnex's biggest deal was its purchase of towers from CK Hutch, a telco. Digital Realty expanded to Africa ($1.7B for Teraco). SBA's two big deals aimed at expansion in Tanzania and Brazil. There were no significant cross-segment deals in 2022, in contrast with 2021 when American Tower spent $10.1B to acquire a large data center specialist, Coresite.
- Employees: CNNOs employ about 112K people, slightly down from 113K in 2021. The sector has a relatively high revenue per employee rate (~$852K in 2022), and free cash flow per employee has been rising for several years. The amount of net PP&E per employee has also been rising, from about $1.8M in 2019 to $2.2M in 2022.
- Data center infra: The number of data centers operated by CNNOs (of ALL types) ended 2022 at 1,224, up from 1,138 in 2021, and just 454 in 2011. Most growth came from the two largest DC CNNOs (Digital Realty, +29; Equinix, +8), and two Chinese providers (ChinData, +11; and GDS, +18). Outside of this study's scope, there is a lot of DC construction underway driven by private equity firms. The average size of a CNNO data center has been relatively flat over the last few years, due to development at both the high end (hyperscale target) and low end (edge/telco).
- Bandwidth infra: CNNOs ended 2022 with about 961K route miles of fiber, up from 938K in 2021. About 30% of this fiber was held by companies outside the bandwidth segment (e.g. Crown Castle, Protelindo, American Tower), up from 21% in 2021. Many cell tower specialist providers are either deploying new fiber to help link base stations and small cell/DAS networks, or acquiring smaller providers who already own the infra.
- Tower infra: Tower CNNOs operate nearly 3.286 million towers, including China Tower. Excluding CT, the figure was 1.231M in 2022, up 28% from about 958K in 2021; the 2011 figure was just 210K. Excluding China Tower, CNNOs' average tower tenancy ratio was 1.76 in 2022, a bit up from the prior 4 years but still well below 2017 and earlier. Tower CNNOs with newly acquired assets are working hard to improve tenancy ratios; this potential is usually one rationale for spending big on a tower acquisition.
- CNNO market in context: CNNOs are one of three operator segments tracked at MTN Consulting, along with Telco and Webscale. The CNNO market plays a vital role in the development of these other two sectors. It remains relatively small, though. In 2022, capex spent by telcos and webscalers totaled $322 billion and $203 billion, respectively. That's roughly 10x and 6x the level of capex recorded by CNNOs in 2022. With all the private investment into CNNOs in recent years, though, and ongoing needs from telcos to rely more on third-parties for their network operations, there are strong signs that the CNNO market will continue to bridge this gap, even if 2023 is challenged.
Forecast outlook
The CNNO market's results for 2022 were broadly consistent with the forecast we published in 4Q22. What are expectations for 2023 and beyond, given 2022 actuals? The forecast called for revenue growth of about 8% per year through 2027; in the current climate, mid single digits is more realistic. Capex also needs a small reduction, but capital intensity should still average around 35% per year. A couple of things to watch for: one, how much fiber will towercos buy/build and what will they do with it? Just for backhaul and network performance, or new services? Two, what opportunities will there be for all the private equity-led investment in new/small CNNOs to impact public markets? This is a particular issue in the data center world, where PE players have concentrated their efforts in the last two years. The tower segment is the CNNO market's largest now, at 57% of 2022 revenues, but data center growth is likely to be strongest over the next several years.
MTN Consulting expects to publish an update to its network operator spending forecast in 2Q23. That may include modest adjustments to the CNNO market's outlook.
COVERAGE:
The following companies are included in this Market Review:
|
|
Table of Contents
- 1. Abstract
- 2. CNNO Segment Overview
- 3. Analysis
- 4. Operating Metrics
- 5. Key Stats
- 6. Segment Drilldown
- 7. Company Drilldown
- 8. Company Benchmarking
- 9. Raw Data
- 10. Exchange Rates
- 11. About
List of Figures & Charts
- 1. Revenues by CNNO type (US$M)
- 2. Revenues single-quarter (US$M)
- 3. CNNO Profitability, annualized (%)
- 4. Capex & M&A spending, single-quarter (US$M)
- 5. Net PP&E by CNNO type (US$M)
- 6. Number of data centers & NRSF per data center (K)
- 7. Bandwidth fiber route miles, Global
- 8. CNNO towers & average tenancy ratio
- 9. Average size of data center, owned vs. leased: Equinix (000s of sq ft)
- 10. Average number of cabinets installed, owned vs. leased: 21ViaNet
- 11. TOP CNNOs (2022): # OF DATACENTERS
- 12. TOP CNNOs (2022): NET RENTABLE SQUARE FEET (NRSF) (MN)
- 13. TOP CNNOs (2022): NRSF PER DATA CENTER (K)
- 14. TOP CNNOs (2022): # OF TOWERS
- 15. TOP CNNOs (2022): NUMBER OF TENANTS
- 16. TOP CNNOs (2022): AVG TENANCY PER OCCUPIED TOWER
- 17. TOP CNNOs (2022): ROUTE MILES OF FIBER
Below charts by total CNNO market, CNNO sub-segments, and by companies:
- 1. Revenues: annual, single-quarter, and annualized (US$M)
- 2. Profitability (Net Profit; Cash from operations; Free cash flow): annual, single-quarter, and annualized (US$M)
- 3. Spending (M&A; Capex): annual, single-quarter, and annualized (US$M)
- 4. Cash & Short-term Investments: annual and single-quarter (US$M)
- 5. Debt (Total debt; Net debt): annual and single-quarter (US$M)
- 6. Property, Plant & Equipment: annual and single-quarter (US$M)
- 7. Key Ratios: Net margin; Capex/revenues; M&A/revenues; Free cash flow/revenues
- 8. Total employees
- 9. Revenue per employee, annualized (US$K)
- 10. FCF per employee, annualized (US$K)
- 11. Net PP&E per employee, annualized (US$K)
Company benchmarking charts:
- 1. 2011 vs. 2022: company benchmark by KPI (Revenues, Net profit, Cash from operations, Capex, Free cash flow, Cash & short-term investments, Net PP&E, Total debt)
- 2. 2011 vs. 2022: company benchmark by key ratio (Capex/revenues; Net margin; FCF margin)
- 3. Top 5 CNNOs by sub-segment: by KPI (Revenues, Net profit, Cash from operations, Capex, Free cash flow, Cash & short-term investments, Net PP&E, Total debt)
- 4. Top 5 CNNOs by sub-segment by Key ratio: Capex/revenues; Net margin; FCF margin
 虛擬網路營運商市場- 按服務(行動虛擬網路營運商(MVNO)、固定虛擬網路營運商(FVNO))、按產品(預付費、後付費)、按最終用戶(消費者、企業)、2024 - 2032 年預測
 電信網路營運商-市場回顧(2023年第三季):電信企業總收入呈現復甦趨勢,但資本投資將進一步下降,資本投資削減中利潤率將大幅上升
 網路營運商預測(~2028 年):資本支出將在 2023 年下降後恢復,並在 2028 年增長至約 6500 億美元,生成式人工智慧推動資本支出和員工人數減少
 營運商中立者希望搭乘 GenAI 浪潮 - 2023 年 1 月更新:CNNO 收入預計在 2023 年達到 100B 美元,資本密集度 >35%,因為行業抓住生成式 AI 和 5G 緻密化的機會
 運營商中立部門的2022年的OPEX電費及燃料費對劇增:對許多運營商中立部門經營者來說電費及燃料費是最大的運營成本,佔OPEX (ex-D&A) 的最大80%
 職業中性增長在行業整合中放緩2022:年市場收入接近1000億美元,對運營商行業的健康至關重要,但易受經濟壓力影響,私募股權公司崛起
 網路經營者的電力使用數量:2021年
 22年前半期運營商中立市場的資料中心投資飆升
 全球有線電視運營商市場:按技術,按家庭使用(無線/互聯網/娛樂/安全/家庭自動化/基於物聯網應用程序),按中小/大型企業使用2022-2027