


 |
市場調查報告書
商品編碼
2035142
印度摩托車市場:市場佔有率分析、產業趨勢與統計及成長預測(2026-2031)India Two Wheeler - Market Share Analysis, Industry Trends & Statistics, Growth Forecasts (2026 - 2031) |
||||||
※ 本網頁內容可能與最新版本有所差異。詳細情況請與我們聯繫。
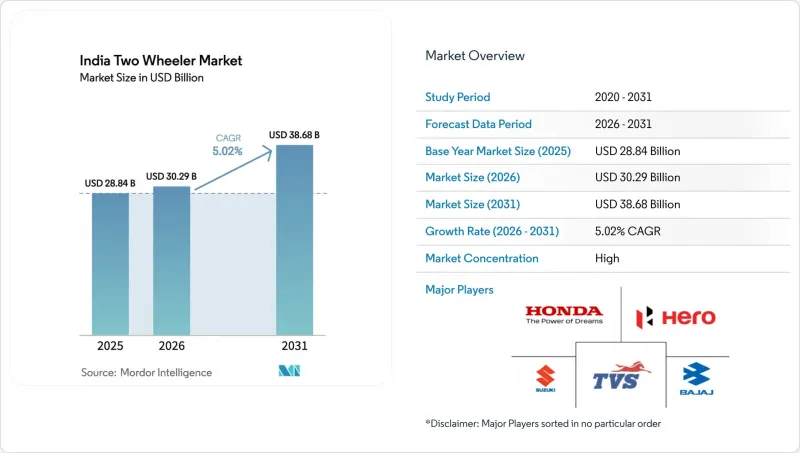
2025 年印度二輪車市場價值 288.4 億美元,預計到 2031 年將達到 386.8 億美元,而 2026 年為 302.9 億美元,預測期(2026-2031 年)複合年成長率為 5.02%。
這一成長軌跡得益於強力的電氣化政策支援、出口需求的復甦以及數位零售通路的擴張。擁擠的都市區對高機動性交通工具的需求、疫情後可支配收入的恢復以及物流車輛的增加,都在推動銷售成長。電池更換的經濟效益促進了電動車的普及,而內燃機汽車出口帶來的規模經濟效益則使製造商能夠在不犧牲利潤率的情況下投資電氣化。老牌企業與電動車專家之間日益激烈的競爭,促使車型更新換代週期縮短、互聯功能的增加以及更具競爭力的價格策略,使得印度二輪車市場對從普通大眾到高階客戶的各類消費者都極具吸引力。
印度摩托車市場的趨勢和洞察
延長FAME-II補貼和州政府電動車獎勵
政府獎勵正在推動電動摩托車的快速普及。在國家層面,政府透過購車補貼和基礎設施投資,確保永續的需求,並建立完善的充電和換電網路。在省級層面,政府則透過現金獎勵和購車補貼來減輕購車負擔。此外,建造專門的電動車充電站也反映了政府的長期投入。這項持續的策略正在增強汽車製造商的商業價值,並為市場轉型為電氣化奠定基礎。
都市區的交通擁擠促使人們更傾向於選擇摩托車。
儘管德里和孟買尖峰時段的平均車速不到20公里/小時,但二輪車完成城市通勤的速度比汽車快40%,所需的停車位也少85%。創新的城市計畫正在透過提供專用車道和安全停車位,將二輪車在緩解交通堵塞方面的作用制度化。送貨車輛也利用這一優勢,承諾使用踏板車和小型摩托車在30分鐘內送達,進一步強化了消費者對二輪車作為印度都市區實用交通工具的認知。
電池原物料價格波動
國內電池製造商面臨外匯風險和鋰價劇烈波動以及過度依賴進口鈷酸鋰帶來的供應中斷風險。這些壓力擠壓了利潤空間,進而影響了整車製造商的定價。結果,電動車和內燃機汽車之間的成本差距有時會擴大,即使有補貼,也會導致消費者購買意願停滯不前。
細分市場分析
2025年,摩托車憑藉其在都市區和鄉村道路上的多功能性,在印度二輪車市場佔據了74.05%的佔有率。然而,預計到2031年,踏板車的複合年成長率將達到6.05%,成長更快,這主要得益於自動變速箱的普及,使其能夠適應走走停停的交通狀況,以及女性騎乘者數量的增加。商業配送公司青睞踏板車平坦的腳踏板和座椅下方的置物空間,企業需求的成長也進一步擴大了踏板車的市場需求。電動技術所需的功率更低,因此電池組體積更小,這也非常適合踏板車,從而能夠實現價格親民且輕便的車輛。為此,一些知名品牌正在推出電動踏板車系列,同時也致力於重新設計其100-125cc的摩托車車型,以鞏固其在農村地區的市場佔有率。
踏板車的風險在於其高速行駛時的穩定性有限,這限制了其對高速公路使用者和農村地區長途通勤者的吸引力。在路況複雜的郊區,由於需要較高的離地間隙和堅固的懸吊系統,摩托車佔據主導地位。旅行和探險等細分市場也促進了摩托車的銷售,反映出騎行作為一種愛好和休閒在富裕的年輕人中廣受歡迎。總體而言,印度二輪車市場在踏板車的成長勢頭和摩托車的穩固地位之間保持著平衡,這兩款車型在不同地區都有共存的空間。
到2025年,內燃機平台將佔印度二輪車市場88.15%的佔有率,這反映了加油站的廣泛覆蓋和較低的購置成本。補貼、電池即服務(BaaS)以及低成本可再生能源正在推動電動車的銷售,預計到2031年將實現7.02%的強勁複合年成長率。每天行駛80-100公里的車隊營運商正在加速向電氣化轉型,因為他們可以在18-24個月內實現盈虧平衡。目前,OEM產品線涵蓋了兩種動力傳動系統。 Hero MotoCorp和TVS Motor正在投資研發48V架構的踏板車,同時也正在改進其BS-VI引擎以滿足日益嚴格的排放氣體法規。這些策略性舉措使它們能夠在技術分散的市場環境中保持市場佔有率,並在印度二輪車市場逐步電氣化的過程中保障獲利能力。
挑戰依然存在,包括電池處置法規、三線城市電網容量以及消費者對實際續航里程的認知。內燃機汽車(ICE)仍享有近乎瞬時的加油優勢。然而,電池組價格正以每年20%的速度下降,而印度PLI-ACC計劃下的國內電池製造可望進一步縮小成本差距。從長遠來看,經濟趨同和基礎設施改善預計將在2028年前後帶來轉折點,屆時都市區汽車銷量將顯著轉向電動車。
其他好處:
- Excel格式的市場預測(ME)表
- 3個月的分析師支持
目錄
第1章:引言
- 研究假設和市場定義
- 調查範圍
第2章:調查方法
第3章執行摘要
第4章:主要產業趨勢
- 人口和都市化
- 人均GDP(購買力平價)和可支配所得中位數
- 汽車購買和交通的消費者支出(CVP)
- 燃油價格
- 摩托車和汽車貸款利率及信用使用環境
- 摩托車擁有率(每千人摩托車擁有量)和摩托車擁有量
- 經銷商/服務網路密度
- 摩托車貿易及收入(進口/出口)
- 電氣化準備(基礎設施和電力)
- 電池組價格和化學成分
- 電池更換站(網路密度和利用率)
- 新車型陣容和OEM覆蓋範圍
- 價值鏈本地化和組裝能力
- 法規結構
- 車輛標準、安全性與駕駛性能
- 整車進口/散裝組裝/半散裝組裝的關稅和增值稅;在地採購率規定;組裝獎勵
- 電氣化、能源與環境政策
- 關於摩托車計程車、送貨車輛、平台和資金籌措。
第5章 市場狀況
- 市場概覽
- 市場促進因素
- 延長FAME-II補助和國家資助的電動車獎勵
- 都市區的交通堵塞正在推高對摩托車的需求。
- 透過使用可更換電池的經營模式來降低整體擁有成本
- 二、三線城市電子商務的快速成長正在推高最後一公里配送需求。
- 數位借貸:向無牌騎士擴大貸款範圍
- ICE出口需求有助於維持國內市場規模。
- 市場限制因素
- 電池原物料價格波動
- 大都會圈以外地區缺乏充電和換電基礎設施
- 商品及服務稅(GST)及進口關稅政策的不確定性
- 因遵守道路安全標準而導致保險費上漲。
- 價值/供應鏈分析
- 監理情勢
- 技術展望
- 波特五力模型
- 新進入者的威脅
- 供應商的議價能力
- 買方的議價能力
- 替代品的威脅
- 競爭公司之間的競爭
第6章 市場規模及成長預測(價值(美元)及數量(單位))
- 車輛類型
- 摩托車
- 小型摩托車
- 透過推進力
- 內燃機
- 電
- 引擎排氣量/功率輸出
- 內燃機
- 110cc或以下
- 111~125cc
- 126~150cc
- 151~200cc
- 201~250cc
- 250~350cc
- 350~500cc
- 500cc或以上
- 電
- 最高可達 1.0 千瓦
- 1.1~3.0 kW
- 3.1~5.0 kW
- 5.0度或以上
- 內燃機
- 按價格範圍
- 最高可達1000美元
- 1000美元至1500美元
- 1,501美元至2,000美元
- 2001-3000美元
- 3001-5000美元
- 超過5000美元
- 最終用戶
- B2C
- B2B
- 共乘/自行車計程車/租賃/觀光
- 配送/物流
- 為企業和中小企業提供車隊
- 其他(政府、組織、非政府組織)
- 銷售管道
- 線上
- 離線
- 按州
- 北方邦
- 馬哈拉斯特拉邦
- 泰米爾納德邦
- 卡納塔克邦
- 古吉拉突邦
- 拉賈斯坦邦
- 安得拉邦
- 比哈爾邦
- 西孟加拉邦
- 特倫甘納邦
- 喀拉拉邦
- 中央邦
- 哈里亞納邦
- 旁遮普邦
- 德里
- 印度其他地區
第7章 競爭情勢
- 市場集中度
- 策略趨勢
- 市佔率分析
- 企業趨勢
- 公司簡介
- Hero MotoCorp Ltd.
- Honda Motorcycle and Scooter India Pvt. Ltd.
- TVS Motor Company Ltd.
- Bajaj Auto Ltd.
- Suzuki Motorcycle India Pvt. Ltd.
- Royal Enfield
- Yamaha Motor India Pvt. Ltd.
- Piaggio Vehicles Pvt. Ltd.
- Mahindra Two Wheelers Ltd.
- India Kawasaki Motors Pvt. Ltd.
- Ampere Vehicles Pvt. Ltd.
- Ather Energy Pvt. Ltd.
- Okinawa Autotech Pvt. Ltd.
- Ola Electric Mobility Pvt. Ltd.
- Revolt Intellicorp Pvt. Ltd.
- Kinetic Green Energy and Power Solutions Ltd.
- Simple Energy Pvt. Ltd.
第8章 市場機會與未來展望
第9章:執行長面臨的關鍵策略挑戰
The India two-wheeler market size was valued at USD 28.84 billion in 2025 and estimated to grow from USD 30.29 billion in 2026 to reach USD 38.68 billion by 2031, at a CAGR of 5.02% during the forecast period (2026-2031).
Strong policy backing for electrification, export demand recovery, and widening digital retail channels underpin this trajectory. Preference for agile transport in congested cities, the return of disposable incomes after the pandemic, and growing logistics fleets reinforce volume growth. Electric vehicle uptake is amplified by battery swapping economics, while scale benefits from ICE exports allow manufacturers to fund electrification without eroding margins. Intensifying competition among legacy brands and EV specialists encourages faster model refresh cycles, added connectivity features, and aggressive pricing strategies that keep the India two-wheeler market attractive for both mass and premium buyers.
India Two Wheeler Market Trends and Insights
FAME-II Subsidy Extension and State EV Incentives
Government incentives are driving the swift adoption of electric two-wheelers. National initiatives offer purchase subsidies and invest in infrastructure, guaranteeing sustained demand and establishing a comprehensive charging and swapping network. On the state level, programs boost affordability with cash incentives and capital subsidies. Additionally, the establishment of dedicated EV parks underscores a long-term commitment. This cohesive strategy bolsters OEM business cases and sets the stage for a significant move towards electrification in the market.
Urban Congestion Driving 2W Preference
Peak-hour speeds in Delhi and Mumbai fall below 20 km/h, yet a two-wheeler completes typical cross-town trips 40% quicker than a car while occupying 85% less parking space. Innovative city projects now earmark dedicated lanes and secure parking for two-wheelers, institutionalizing their role in reducing traffic congestion. Delivery fleets further validate the advantage by meeting 30-minute delivery promises via scooters and small motorcycles, reinforcing consumer perception that two-wheelers are the pragmatic mobility choice in urban India.
Battery-Raw-Material Price Volatility
Domestic battery manufacturers face currency risks and supply disruptions due to extreme swings in lithium prices and a heavy reliance on imported lithium and cobalt. These pressures compress profit margins, which in turn influence OEM pricing. As a result, the cost gap between electric vehicles and internal combustion vehicles occasionally widens, stalling purchase decisions even with subsidy support .
Other drivers and restraints analyzed in the detailed report include:
- Swappable-battery Business Models Lowering TCO
- Digital Lending Expanding Credit to Informal Riders
- Sparse Charging and Swapping Infrastructure Outside Metros
For complete list of drivers and restraints, kindly check the Table Of Contents.
Segment Analysis
Motorcycles sustained 74.05% of the India two-wheeler market share in 2025, owing to their versatility across city and rural roads. Yet scooters are growing faster at a 6.05% CAGR through 2031, aided by automatic transmissions that suit stop-start traffic and rising female ridership. Commercial delivery firms value the flat floorboard and under-seat storage, adding corporate volumes that further widen scooter demand. Electric technology also fits scooters well because lower power needs align with smaller battery packs, ensuring reasonable prices and curb weights. In response, legacy brands unveil electric scooter lines while doubling down on 100-125 cc motorcycle refreshes to defend share in hinterland districts.
Risks for scooters lie in limited high-speed stability, which restricts appeal for highway users and rural commuters travelling longer distances. Motorcycles dominate semi-urban zones where mixed road surfaces require higher ground clearance and robust suspension. Tourer and adventure sub-segments anchor motorcycle volumes, as hobby and leisure riding are popular among affluent youth segments. Overall, the India two-wheeler market thus balances scooter momentum with motorcycle incumbency, leaving room for both formats to co-exist across geographies.
Internal combustion engine platforms accounted for 88.15% of the India two-wheeler market size in 2025, reflecting entrenched fuel stations and lower purchase costs. Subsidized pricing, battery-as-a-service, and cheaper renewables electricity push electric volumes forward, delivering a robust 7.02% CAGR to 2031. Fleet operators with 80-100 km daily realize break-even within 18-24 months, accelerating conversions. OEM portfolios now straddle both powertrains; Hero MotoCorp and TVS Motor invest in 48 V architecture scooters while upgrading BS-VI engines to meet tightening emission rules. Strategic hedging ensures relevance across the technology divide and shields revenues as the India two-wheeler market gradually electrifies.
Challenges remain: battery disposal norms, grid capacity in tier-III regions, and consumer awareness of real-world range. ICE continues to enjoy near-instant refueling advantages. However, pack prices fall at a 20% annual clip, and domestic cell manufacturing under India's PLI-ACC scheme will narrow cost gaps further. Long-term, converging economics and improved infrastructure suggest a tipping point around 2028 when urban sales tilt materially toward electric.
The India Two-Wheeler Market Report is Segmented by Vehicle Type (Motorcycles and Scooters), Propulsion (ICE and Electric), Engine Capacity/Motor Power (Up To 110cc, and More), Price Band (Up To USD 1, 000, and More), End User (B2C and B2B), Sales Channel (Online and Offline), and by State. The Market Forecasts are Provided in Terms of Value (USD) and Volume (Units).
List of Companies Covered in this Report:
- Hero MotoCorp Ltd.
- Honda Motorcycle and Scooter India Pvt. Ltd.
- TVS Motor Company Ltd.
- Bajaj Auto Ltd.
- Suzuki Motorcycle India Pvt. Ltd.
- Royal Enfield
- Yamaha Motor India Pvt. Ltd.
- Piaggio Vehicles Pvt. Ltd.
- Mahindra Two Wheelers Ltd.
- India Kawasaki Motors Pvt. Ltd.
- Ampere Vehicles Pvt. Ltd.
- Ather Energy Pvt. Ltd.
- Okinawa Autotech Pvt. Ltd.
- Ola Electric Mobility Pvt. Ltd.
- Revolt Intellicorp Pvt. Ltd.
- Kinetic Green Energy and Power Solutions Ltd.
- Simple Energy Pvt. Ltd.
Additional Benefits:
- The market estimate (ME) sheet in Excel format
- 3 months of analyst support
TABLE OF CONTENTS
1 Introduction
- 1.1 Study Assumptions and Market Definition
- 1.2 Scope of the Study
2 Research Methodology
3 Executive Summary
4 Key Industry Trends
- 4.1 Population and Urbanization Rate
- 4.2 GDP per Capita (PPP) and Median Disposable Income
- 4.3 Consumer Spend on Vehicle Purchase/Transport (CVP)
- 4.4 Fuel Prices
- 4.5 Interest Rate for 2W/Auto Loans and Credit Access
- 4.6 2W Penetration (units per 1,000) and Parc
- 4.7 Dealer/Service Network Density
- 4.8 Two-Wheeler Trade and Revenue (Imports/Exports)
- 4.9 Electrification Readiness (Infra and Power)
- 4.10 Battery Pack Price and Chemistry Mix
- 4.11 Battery Swapping Stations (Network Density and Utilization)
- 4.12 New Model Pipeline and OEM Coverage
- 4.13 Value-Chain Localization and Assembly Capacity
- 4.14 Regulatory Framework
- 4.14.1 Vehicle Standards, Safety and Roadworthiness
- 4.14.2 CBU/CKD/SKD Duties and VAT; Local-content Rules; Assembly Incentives
- 4.14.3 Electrification, Energy and Environmental Policy
- 4.14.4 Bike-Taxi, Delivery-Fleet, Platform and Financing Rules
5 Market Landscape
- 5.1 Market Overview
- 5.2 Market Drivers
- 5.2.1 FAME-II Subsidy Extension and State-EV Incentives
- 5.2.2 Urban Congestion Driving 2W Preference
- 5.2.3 Swappable-Battery Business Models Lowering TCO
- 5.2.4 Tier-II/III E-Commerce Boom Boosting Last-Mile Demand
- 5.2.5 Digital Lending Expanding Credit to Informal Riders
- 5.2.6 ICE Export Demand Sustaining Domestic Scale
- 5.3 Market Restraints
- 5.3.1 Battery-Raw-Material Price Volatility
- 5.3.2 Sparse Charging/Swapping Infra Outside Metros
- 5.3.3 Policy Uncertainty on GST and Import Duties
- 5.3.4 Rising Insurance Premiums for Road-Safety Compliance
- 5.4 Value / Supply-Chain Analysis
- 5.5 Regulatory Landscape
- 5.6 Technological Outlook
- 5.7 Porter's Five Forces
- 5.7.1 Threat of New Entrants
- 5.7.2 Bargaining Power of Suppliers
- 5.7.3 Bargaining Power of Buyers
- 5.7.4 Threat of Substitutes
- 5.7.5 Competitive Rivalry
6 Market Size and Growth Forecasts (Value (USD) and Volume (Units))
- 6.1 By Vehicle Type
- 6.1.1 Motorcycles
- 6.1.2 Scooters
- 6.2 By Propulsion
- 6.2.1 Internal Combustion Engine
- 6.2.2 Electric
- 6.3 By Engine Capacity / Motor Power
- 6.3.1 Internal Combustion Engine
- 6.3.1.1 Up to110 cc
- 6.3.1.2 111-125 cc
- 6.3.1.3 126-150 cc
- 6.3.1.4 151-200 cc
- 6.3.1.5 201-250 cc
- 6.3.1.6 250-350 cc
- 6.3.1.7 350-500 cc
- 6.3.1.8 Above 500 cc
- 6.3.2 Electric
- 6.3.2.1 Up to 1.0 kW
- 6.3.2.2 1.1-3.0 kW
- 6.3.2.3 3.1-5.0 kW
- 6.3.2.4 Above 5.0 kW
- 6.3.1 Internal Combustion Engine
- 6.4 By Price Band
- 6.4.1 Up to USD 1,000
- 6.4.2 USD 1,000-1,500
- 6.4.3 USD 1,501-2,000
- 6.4.4 USD 2,001-3,000
- 6.4.5 USD 3,001-5,000
- 6.4.6 Above USD 5,000
- 6.5 By End User
- 6.5.1 B2C
- 6.5.2 B2B
- 6.5.2.1 Ride-hail / Bike-Taxi / Rental / Tourism
- 6.5.2.2 Delivery and Logistics
- 6.5.2.3 Corporate and SME Fleets
- 6.5.2.4 Others (Govt, Institutional, NGO)
- 6.6 Sales Channel
- 6.6.1 Online
- 6.6.2 Offline
- 6.7 By State
- 6.7.1 Uttar Pradesh
- 6.7.2 Maharashtra
- 6.7.3 Tamil Nadu
- 6.7.4 Karnataka
- 6.7.5 Gujarat
- 6.7.6 Rajasthan
- 6.7.7 Andhra Pradesh
- 6.7.8 Bihar
- 6.7.9 West Bengal
- 6.7.10 Telangana
- 6.7.11 Kerala
- 6.7.12 Madhya Pradesh
- 6.7.13 Haryana
- 6.7.14 Punjab
- 6.7.15 Delhi
- 6.7.16 Rest of India
7 Competitive Landscape
- 7.1 Market Concentration
- 7.2 Strategic Moves
- 7.3 Market Share Analysis
- 7.4 Company Landscape
- 7.5 Company Profiles (Includes Global level Overview, Market level overview, Core Segments, Financials, Strategic Info, Market Rank/Share, Products and Services, Recent Developments)
- 7.5.1 Hero MotoCorp Ltd.
- 7.5.2 Honda Motorcycle and Scooter India Pvt. Ltd.
- 7.5.3 TVS Motor Company Ltd.
- 7.5.4 Bajaj Auto Ltd.
- 7.5.5 Suzuki Motorcycle India Pvt. Ltd.
- 7.5.6 Royal Enfield
- 7.5.7 Yamaha Motor India Pvt. Ltd.
- 7.5.8 Piaggio Vehicles Pvt. Ltd.
- 7.5.9 Mahindra Two Wheelers Ltd.
- 7.5.10 India Kawasaki Motors Pvt. Ltd.
- 7.5.11 Ampere Vehicles Pvt. Ltd.
- 7.5.12 Ather Energy Pvt. Ltd.
- 7.5.13 Okinawa Autotech Pvt. Ltd.
- 7.5.14 Ola Electric Mobility Pvt. Ltd.
- 7.5.15 Revolt Intellicorp Pvt. Ltd.
- 7.5.16 Kinetic Green Energy and Power Solutions Ltd.
- 7.5.17 Simple Energy Pvt. Ltd.
8 Market Opportunities and Future Outlook
9 Key Strategic Questions for CEOs
 摩托車市場-全球產業規模、佔有率、趨勢、機會和預測:按車型、動力系統、地區和競爭格局分類,2021-2031年
 摩托車市場:2026年至2032年全球預測(按車型、動力系統、性能類型、類別、變速箱類型、價格範圍、應用和最終用戶分類)
 摩托車照明市場規模、佔有率、成長及全球產業分析:按類型、應用和地區分類,並預測至2026-2034年摩托車市場規模、佔有率、成長及全球產業分析:按類型、應用和地區分類的洞察,2026-2034 年預測
 日本摩托車市場:規模、佔有率、趨勢和預測:按類型、技術、變速箱、引擎排氣量、燃料類型、分銷管道、最終用戶和地區分類(2026-2034 年)
 中國摩托車市場:市場佔有率分析、產業趨勢與統計及成長預測(2026-2031年)
 摩托車市場機會、成長要素、產業趨勢分析及2026年至2035年預測歐洲摩托車市場佔有率分析、行業趨勢、統計數據和成長預測(2026-2031)
 摩托車智能化與產業鏈(2025-2026)
 全球摩托車市場