


 |
市場調查報告書
商品編碼
1850358
企業協作:市場佔有率分析、產業趨勢、統計數據和成長預測(2025-2030 年)Enterprise Collaboration - Market Share Analysis, Industry Trends & Statistics, Growth Forecasts (2025 - 2030) |
||||||
※ 本網頁內容可能與最新版本有所差異。詳細情況請與我們聯繫。
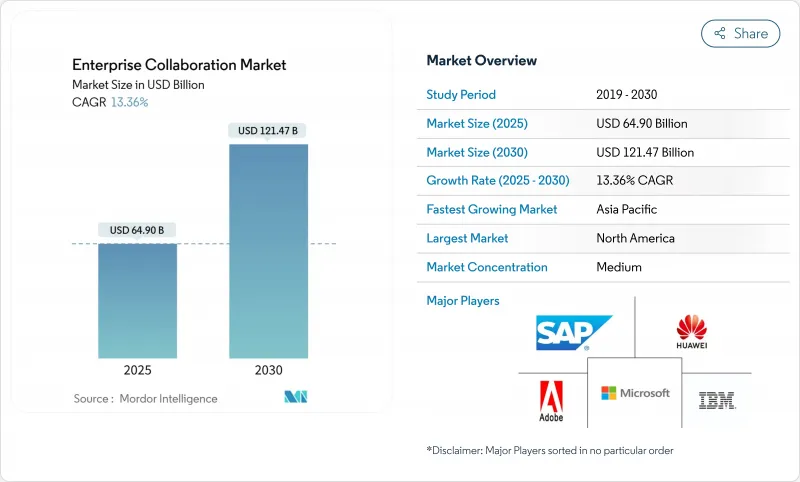
企業協作市場規模預計將在 2025 年達到 649 億美元,到 2030 年將擴大到 1,214.7 億美元,複合年成長率為 13.4%。
強勁成長與生成式人工智慧助理的快速普及、混合辦公模式的興起以及對能夠統一語音、視訊、通訊和知識管理的安全、可擴展平台的需求密切相關。儘管軟體仍然是主要的支出促進因素,但隨著企業尋求人工智慧整合的專業人才,服務成長正在加速。即使許多工作負載仍保留在本地,雲端遷移仍然強勁。從區域來看,北美憑藉早期人工智慧應用保持了其收益主導,而亞太地區則憑藉5G部署、積極的數位基礎設施投資和政府支援政策,成為突出的成長引擎。
全球企業協作市場趨勢與洞察
API整合以統一分散的工作流程
現代企業平均每位員工要管理 9.4 個應用程式,這導致頻繁切換應用程式,成本高昂。到 2026 年,75% 的公司計劃部署支援人工智慧的通訊 API,將 CRM 系統、計劃管理套件和通訊中心連接起來,將產品推出週期縮短 25%,並提升企業協作市場的生產力價值。成功的採用者會為他們的 AI 助理提供豐富的上下文資訊,從而實現更流暢的數據同步、自動化繁瑣的更新,並將員工從繁瑣的工作中解放出來,讓他們專注於更有價值的任務。
行動優先設計加速第一線用戶採用
第一線員工佔全球勞動力的80%,但迄今為止,他們一直缺乏專門設計的工具。行動原生介面能夠實現即時任務管理,但與以桌面為中心的部署相比,其投資報酬率降低了391%。亞太地區憑藉其長期以來優先使用行動裝置的消費行為,引領著這項轉變,並推動了企業協作市場的成長。
人們越來越擔心供應商鎖定和互通性問題
監管機構目前正在調查雲端生態系是否存在反競爭行為,而各公司則透過採用開放標準和容器化配置來反擊,但重新培訓使用者使用替代人工智慧介面的學習曲線仍然很高。
細分市場分析
至2024年,軟體收入將佔72.0%,鞏固其作為企業協作市場核心平台層的地位。然而,隨著企業意識到人工智慧助理需要客製化的回應工程、模型微調和管治框架,服務業務的複合年成長率將達到14.6%,超過整體13.4%的成長速度。預計2030年,企業協作服務市場規模將達373億美元。供應商正在將培訓、變更管理和持續最佳化等服務捆綁銷售,這些合約的期限通常比傳統協作協議長40%至60%。
歷史數據顯示,服務業的複合年成長率將從2019年至2024年的11.8%加速至2030年的14.6%,反映出人工智慧和邊緣運算帶來的日益成長的複雜性。像塔塔諮詢服務公司(Tata Consultancy Services)這樣的供應商正在建立行業專屬的卓越中心,以幫助客戶更快、更安全地進行人工智慧賦能的通訊。因此,在企業協作市場中,軟體授權價值與服務交付創新之間的界線正變得模糊不清。
到2024年,本地部署解決方案將佔總收入的68.5%,凸顯了金融和政府等產業對資料主權規則日益成長的重視。雲端採用率仍然較低,年複合成長率為14.3%,比本地部署高出3.7個百分點,這主要得益於企業尋求彈性消費模式和原生AI附加元件。預計到2030年,雲端企業協作市場規模將達到385.6億美元,顯示將本地控制與雲端創新結合的混合設計將成為架構藍圖的主流。
主權雲端框架、邊緣存取點和保密運算技術正在幫助企業協調監管限制與人工智慧發展目標。到2027年,70%的企業將以「數位主權」為標準來評估其服務提供者的選擇。這項需求正在推動對區域資料中心和多重雲端編配技能的需求,並促進企業協作服務產業的興起。
企業協作市場報告按組件(軟體和服務)、部署類型(雲端基礎和本地部署)、應用(通訊工具、會議工具、其他)、組織規模(大型企業和中小企業)、最終用戶垂直行業(IT 和通訊、BFSI、其他)和地區進行細分。
區域分析
到2024年,北美將佔全球營收的40.1%,反映出雲端運算的廣泛應用、人工智慧的早期採用以及風險資金籌措的活性化。該地區的企業如今正將生成式人工智慧融入面向客戶的工作流程,將其視為保持競爭力的必要條件,從而支撐了兩位數的持續成長。主權雲端和邊緣區域的擴展將使受監管行業能夠在合規與創新之間取得平衡。
亞太地區是成長最快的地區,預計到2030年複合年成長率將達到14.0%。各國政府正大力投資5G骨幹網路和雲端基礎設施,企業在人工智慧應用方面也獲得了3.6倍的投資報酬率。行動優先的工作模式以及相應的政策支持,使亞太地區成為全球企業協作市場擴張的關鍵驅動力。在澳洲、日本和新加坡,數位主權框架與開放的雲端生態系相結合,正在推動融合本地資料駐留和全球人工智慧資源的混合架構的建構。
歐洲正穩步推進,嚴格執行《數位市場法案》和《一般資料保護規範》(GDPR)有利於那些能夠證明其資料保護措施高於行業標準的本地供應商。同時,拉丁美洲和中東及非洲地區正受惠於寬頻普及率的提高和區域資料中心的激增。在墨西哥、巴西和阿拉伯聯合大公國,邊緣接入點的部署降低了延遲,即使在國際頻寬成本高的情況下,也能支援人工智慧密集功能。
其他福利:
- Excel格式的市場預測(ME)表
- 3個月的分析師支持
目錄
第1章 引言
- 研究假設和市場定義
- 調查範圍
第2章調查方法
第3章執行摘要
第4章 市場情勢
- 市場概覽
- 市場促進因素
- API整合以統一分散的工作流程
- 行動優先設計加速了現場應用。
- 生成式人工智慧助理可自動執行重複性任務
- 混合辦公模式將推動統一通訊即服務 (UCaaS) 的普及。
- 垂直化「微套件」捆綁包
- 新興市場的低延遲邊緣接入點
- 市場限制
- 人們越來越擔心供應商鎖定和互通性問題
- 加強數據主權監管
- 「應用疲勞」會降低用戶參與度KPI
- 協作堆疊中零日攻擊的激增
- 價值鏈分析
- 監管格局
- 技術展望
- 波特五力分析
- 新進入者的威脅
- 供應商的議價能力
- 買方的議價能力
- 替代品的威脅
- 競爭對手之間的競爭
- 評估宏觀經濟趨勢對市場的影響
第5章 市場規模與成長預測
- 按組件
- 軟體
- 服務
- 依部署類型
- 雲端基礎
- 本地部署
- 透過使用
- 溝通工具
- 會議工具
- 協調/計劃管理工具
- 社交和知識共用平台
- 按公司規模
- 主要企業
- 小型企業
- 按最終用戶產業
- 資訊科技/通訊
- BFSI
- 零售和消費品
- 醫療保健和生命科學
- 教育
- 運輸/物流
- 旅遊與飯店
- 其他行業
- 按地區
- 北美洲
- 美國
- 加拿大
- 墨西哥
- 歐洲
- 德國
- 英國
- 法國
- 義大利
- 西班牙
- 俄羅斯
- 其他歐洲地區
- 亞太地區
- 中國
- 日本
- 韓國
- 印度
- ASEAN
- 澳洲和紐西蘭
- 其他亞太地區
- 南美洲
- 巴西
- 阿根廷
- 其他南美
- 中東和非洲
- 中東
- 沙烏地阿拉伯
- 阿拉伯聯合大公國
- 土耳其
- 其他中東地區
- 非洲
- 南非
- 奈及利亞
- 其他非洲國家
- 北美洲
第6章 競爭情勢
- 市場集中度
- 策略趨勢
- 市佔率分析
- 公司簡介
- Microsoft Corporation
- Cisco Systems Inc.
- Zoom Video Communications Inc.
- Slack Technologies Inc.(Salesforce)
- Google LLC
- IBM Corporation
- SAP SE
- Atlassian Corporation PLC
- Adobe Inc.
- Huawei Technologies Co. Ltd.
- Mitel Networks Corp.
- TIBCO Software Inc.
- Zoho Corp.
- Axero Solutions LLC
- Trello(Atlassian)
- monday.com Ltd.
- Asana Inc.
- Jive Software
- Poly(HP)
- RingCentral Inc.
第7章 市場機會與未來展望
The enterprise collaboration market size reached a valuation of USD 64.90 billion in 2025 and is projected to expand to USD 121.47 billion by 2030, reflecting a 13.4% CAGR.
Strong growth is tied to rapid adoption of generative-AI copilots, hybrid-work mandates, and the need for secure, scalable platforms that unify voice, video, messaging, and knowledge management. Software continues to anchor spending, though services rise faster as enterprises seek specialized AI integration talent. Cloud migration remains brisk despite data-sovereignty concerns that keep many workloads on-premise. Regionally, North America retains revenue leadership on the strength of early AI deployment, while Asia-Pacific emerges as the standout growth engine on the back of 5G rollouts, aggressive digital-infrastructure investment, and supportive government policy.
Global Enterprise Collaboration Market Trends and Insights
API Integration to Unify Fragmented Workflows
Modern enterprises juggle an average of 9.4 applications per worker, creating costly context-switching overhead. By 2026, 75% of firms plan to deploy AI-enabled communications APIs that connect CRM systems, project-management suites, and messaging hubs, cutting product launch cycles by 25% and lifting the enterprise collaboration market's overall productivity value. Successful adopters report smoother data synchronization that feeds AI copilots richer context, enabling them to automate mundane updates and free employees for higher-value tasks.
Mobile-First Design Accelerates Frontline Adoption
Frontline workers comprise 80% of the global workforce yet historically lacked purpose-built tools. Mobile-native interfaces now deliver real-time task management, saving firms as much as 391% ROI relative to desktop-centric rollouts. Asia-Pacific leads this shift due to long-standing mobile-first consumer behavior, propelling regional growth within the enterprise collaboration market.
Rising Vendor Lock-In and Interoperability Concerns
Regulators now probe cloud ecosystems for anti-competitive practices as egress fees and proprietary AI models create costly switching barriers. Enterprises counter by adopting open standards and containerized deployment, yet the learning curve of retraining users on alternative AI interfaces remains high.
Other drivers and restraints analyzed in the detailed report include:
- Generative-AI Copilots Automate Repetitive Tasks
- Hybrid-Work Mandates Boost UCaaS Deployments
- Verticalised "Micro-Suite" Bundles
- Low-Latency Edge Points of Presence (PoPs) in Emerging Markets
- Tightening Data-Sovereignty Regulations
For complete list of drivers and restraints, kindly check the Table Of Contents.
Segment Analysis
Software retained a 72.0% slice of 2024 revenue, cementing its role as the core platform layer in the enterprise collaboration market. Services, however, are forecast to expand at 14.6% CAGR, topping the overall 13.4% pace as enterprises recognize that AI copilots require custom prompt engineering, model fine-tuning, and governance frameworks. The enterprise collaboration market size for services is on track to reach USD 37.30 billion by 2030, reflecting sustained demand for professional and managed offerings. Vendors bundle training, change-management, and continuous optimization contracts that typically run 40-60% longer than traditional collaboration engagements.
Historical data show services CAGR accelerating from 11.8% during 2019-2024 to 14.6% through 2030, mirroring the escalating complexity that AI and edge computing introduce. Providers such as Tata Consultancy Services build industry-specific centers of excellence, enabling clients to launch AI-infused communications faster and with lower risk. As a result, the enterprise collaboration market continues to see a blurring line between software license value and service-delivered innovation.
On-premise solutions preserved 68.5% of 2024 revenue, underscoring the grip of data-sovereignty rules in sectors like finance and government. Cloud deployments, while smaller, are rising at a 14.3% CAGR-outpacing on-premise by 3.7 percentage points-as organizations pursue elastic consumption models and native AI add-ons. The enterprise collaboration market size for cloud implementations is projected to hit USD 38.56 billion by 2030, illustrating how hybrid designs that pair local control with cloud innovation will dominate architectural blueprints.
Sovereign-cloud frameworks, edge PoPs, and confidential-computing techniques help reconcile regulatory constraints with AI ambitions. By 2027, 70% of enterprises plan to evaluate provider choices through a "digital sovereignty" lens. That requirement inflates demand for regional data centers and multi-cloud orchestration skills, fueling the enterprise collaboration industry's services upswing.
The Enterprise Collaboration Market Report is Segmented by Component (Software and Services), Deployment Type (Cloud-Based and On-Premise), Application (Communication Tools, Conferencing Tools, and More), Organization Size (Large Enterprises and Small and Medium Enterprises (SMEs)), End-User Industry (IT and Telecommunication, BFSI, and More), and Geography.
Geography Analysis
North America generated 40.1% of 2024 revenue for the enterprise collaboration market, reflecting deep cloud penetration, early AI adoption, and robust VC funding. Regional enterprises now embed generative AI in customer-facing workflows as a competitive necessity, underpinning consistent double-digit growth. Expanding sovereign-cloud zones and edge zones ensure regulated sectors can balance compliance with innovation.
Asia-Pacific is the fastest-growing territory at 14.0% CAGR through 2030. Governments invest aggressively in 5G backbones and cloud infrastructure, while organizations report a 3.6X ROI on AI rollouts. Coupled with a mobile-first workforce and supportive policy regimes, this dynamic elevates Asia-Pacific to a primary engine of global expansion for the enterprise collaboration market. In Australia, Japan, and Singapore, digital-sovereignty frameworks align with open-cloud ecosystems, fostering hybrid architectures that blend local data residency with global AI resources.
Europe advances steadily on the back of the Digital Markets Act and strict GDPR enforcement, which favor local providers that can certify higher-than-standard data safeguards. Meanwhile, Latin America and the Middle East, and Africa benefit from improving broadband coverage and the proliferation of regional data centers. Edge PoP deployments in Mexico, Brazil, and the UAE reduce latency, supporting AI-heavy features even where international bandwidth is cost-prohibitive.
- Microsoft Corporation
- Cisco Systems Inc.
- Zoom Video Communications Inc.
- Slack Technologies Inc. (Salesforce)
- Google LLC
- IBM Corporation
- SAP SE
- Atlassian Corporation PLC
- Adobe Inc.
- Huawei Technologies Co. Ltd.
- Mitel Networks Corp.
- TIBCO Software Inc.
- Zoho Corp.
- Axero Solutions LLC
- Trello (Atlassian)
- monday.com Ltd.
- Asana Inc.
- Jive Software
- Poly (HP)
- RingCentral Inc.
Additional Benefits:
- The market estimate (ME) sheet in Excel format
- 3 months of analyst support
TABLE OF CONTENTS
1 INTRODUCTION
- 1.1 Study Assumptions and Market Definition
- 1.2 Scope of the Study
2 RESEARCH METHODOLOGY
3 EXECUTIVE SUMMARY
4 MARKET LANDSCAPE
- 4.1 Market Overview
- 4.2 Market Drivers
- 4.2.1 API integration to unify fragmented workflows
- 4.2.2 Mobile-first design accelerates frontline adoption
- 4.2.3 Generative-AI copilots automate repetitive tasks
- 4.2.4 Hybrid-work mandates boost UCaaS deployments
- 4.2.5 Verticalised "micro-suite" bundles
- 4.2.6 Low-latency edge PoPs in emerging markets
- 4.3 Market Restraints
- 4.3.1 Rising vendor lock-in and interoperability concerns
- 4.3.2 Tightening data-sovereignty regulations
- 4.3.3 "App-fatigue" lowers user-engagement KPIs
- 4.3.4 Escalating zero-day exploits on collaboration stacks
- 4.4 Value Chain Analysis
- 4.5 Regulatory Landscape
- 4.6 Technological Outlook
- 4.7 Porter's Five Forces Analysis
- 4.7.1 Threat of New Entrants
- 4.7.2 Bargaining Power of Suppliers
- 4.7.3 Bargaining Power of Buyers
- 4.7.4 Threat of Substitutes
- 4.7.5 Intensity of Competitive Rivalry
- 4.8 Assessment of the Impact of Macroeconomic Trends on the Market
5 MARKET SIZE AND GROWTH FORECASTS (VALUE)
- 5.1 By Component
- 5.1.1 Software
- 5.1.2 Services
- 5.2 By Deployment Type
- 5.2.1 Cloud-based
- 5.2.2 On-premise
- 5.3 By Application
- 5.3.1 Communication Tools
- 5.3.2 Conferencing Tools
- 5.3.3 Coordination / Project-Mgmt Tools
- 5.3.4 Social and Knowledge-Sharing Platforms
- 5.4 By Organisation Size
- 5.4.1 Large Enterprises
- 5.4.2 Small and Medium Enterprises (SMEs)
- 5.5 By End-user Industry
- 5.5.1 IT and Telecommunication
- 5.5.2 BFSI
- 5.5.3 Retail and Consumer Goods
- 5.5.4 Healthcare and Life Sciences
- 5.5.5 Education
- 5.5.6 Transportation and Logistics
- 5.5.7 Travel and Hospitality
- 5.5.8 Other Industries
- 5.6 By Geography
- 5.6.1 North America
- 5.6.1.1 United States
- 5.6.1.2 Canada
- 5.6.1.3 Mexico
- 5.6.2 Europe
- 5.6.2.1 Germany
- 5.6.2.2 United Kingdom
- 5.6.2.3 France
- 5.6.2.4 Italy
- 5.6.2.5 Spain
- 5.6.2.6 Russia
- 5.6.2.7 Rest of Europe
- 5.6.3 Asia-Pacific
- 5.6.3.1 China
- 5.6.3.2 Japan
- 5.6.3.3 South Korea
- 5.6.3.4 India
- 5.6.3.5 ASEAN
- 5.6.3.6 Australia and New Zealand
- 5.6.3.7 Rest of Asia-Pacific
- 5.6.4 South America
- 5.6.4.1 Brazil
- 5.6.4.2 Argentina
- 5.6.4.3 Rest of South America
- 5.6.5 Middle East and Africa
- 5.6.5.1 Middle East
- 5.6.5.1.1 Saudi Arabia
- 5.6.5.1.2 UAE
- 5.6.5.1.3 Turkey
- 5.6.5.1.4 Rest of Middle East
- 5.6.5.2 Africa
- 5.6.5.2.1 South Africa
- 5.6.5.2.2 Nigeria
- 5.6.5.2.3 Rest of Africa
- 5.6.1 North America
6 COMPETITIVE LANDSCAPE
- 6.1 Market Concentration
- 6.2 Strategic Moves
- 6.3 Market Share Analysis
- 6.4 Company Profiles (includes Global level Overview, Market level overview, Core Segments, Financials as available, Strategic Information, Market Rank/Share, Products and Services, Recent Developments)
- 6.4.1 Microsoft Corporation
- 6.4.2 Cisco Systems Inc.
- 6.4.3 Zoom Video Communications Inc.
- 6.4.4 Slack Technologies Inc. (Salesforce)
- 6.4.5 Google LLC
- 6.4.6 IBM Corporation
- 6.4.7 SAP SE
- 6.4.8 Atlassian Corporation PLC
- 6.4.9 Adobe Inc.
- 6.4.10 Huawei Technologies Co. Ltd.
- 6.4.11 Mitel Networks Corp.
- 6.4.12 TIBCO Software Inc.
- 6.4.13 Zoho Corp.
- 6.4.14 Axero Solutions LLC
- 6.4.15 Trello (Atlassian)
- 6.4.16 monday.com Ltd.
- 6.4.17 Asana Inc.
- 6.4.18 Jive Software
- 6.4.19 Poly (HP)
- 6.4.20 RingCentral Inc.
7 MARKET OPPORTUNITIES AND FUTURE OUTLOOK
- 7.1 White-space and Unmet-need Assessment
 企業協作市場(按組件、部署類型、組織規模和最終用戶產業)—2025-2032 年全球預測
 全球虛擬協作市場
 企業協作服務市場(按解決方案、部署、類型、最終用途產業和地區)全球企業協作市場:市場規模、佔有率、趨勢分析(按類型、組織規模、部署方式、最終用途和地區)、細分市場預測(2025-2030 年)美國企業協作市場:市場規模、佔有率、趨勢分析(按類型、組織規模、部署方法和最終用途)、細分市場預測(2025-2030 年)2032 年企業協作市場預測:按類型、協作工具、部署類型、應用程式、最終用戶和地區進行的全球分析
 企業協作市場規模、佔有率及成長分析(按類型、部署類型、公司規模、組件、垂直產業和地區)-2025 年至 2032 年產業預測
 2025年企業協作軟體全球市場報告2025年企業協作全球市場報告
 亞太企業合作:市場佔有率分析、產業趨勢與統計、成長預測(2025-2030 年)