


 |
市場調查報告書
商品編碼
1237829
航空航天壓力表市場—增長、趨勢、COVID-19 的影響和預測2023-2028Aerospace Pressure Gauge Market - Growth, Trends, And Forecasts (2023 - 2028) |
||||||
※ 本網頁內容可能與最新版本有所差異。詳細情況請與我們聯繫。
在預測期內,航空壓力表市場預計將以超過 3% 的複合年增長率增長。
由於 COVID-19 大流行,全球航空業面臨著前所未有的挑戰。 大流行對航空業產生了重大影響,導致客運量大幅減少,並對新飛機的需求產生負面影響。 根據國際民航組織 (ICAO) 的一份報告,全球機場在 2020 年第一季度的全球客運量下降了 28.4%。 自 COVID-19 以來,由於管制放鬆和空中交通量增加,航空業已顯著復甦,導致對飛機零件的需求增加。
由於航空旅行的增加,對新飛機的需求增加,從而創造了對飛機零部件的需求,從而推動了市場增長。 在飛機上,許多儀器測量壓力以告知飛行員飛機的狀態和飛行條件。 壓敏儀表安裝在飛行組和發動機組。 這些部件具有遙感和直讀功能。 這些是飛機上最重要的儀器,可為飛行員提供準確的信息並保持安全運行。
對新飛機不斷增長的需求以及對飛機現代化項目投資的增加正在推動市場的增長。 飛機上使用的壓力表有不同類型,例如燃油壓力表、液壓壓力表、歧管壓力表和液壓壓力表。 飛機燃油壓力表是一種測量和報告車輛油箱中剩餘燃油量的裝置。 因此,航空業的擴張預計將推動未來幾年的市場增長。
航空壓力表的市場趨勢
數字壓力表在預測期內將大幅增長
預計數字壓力表領域在預測期內將經歷顯著增長。 數字壓力表用於將壓力轉換為電子信號。 儀表在數字顯示屏上顯示壓力,信號可用於控制設備。 Newbow Aerospace 推出了革命性的數字輪胎壓力檢查儀,校準精度為正負0.4%FS。 因此,增加對開發創新產品的投資正在推動市場的增長。
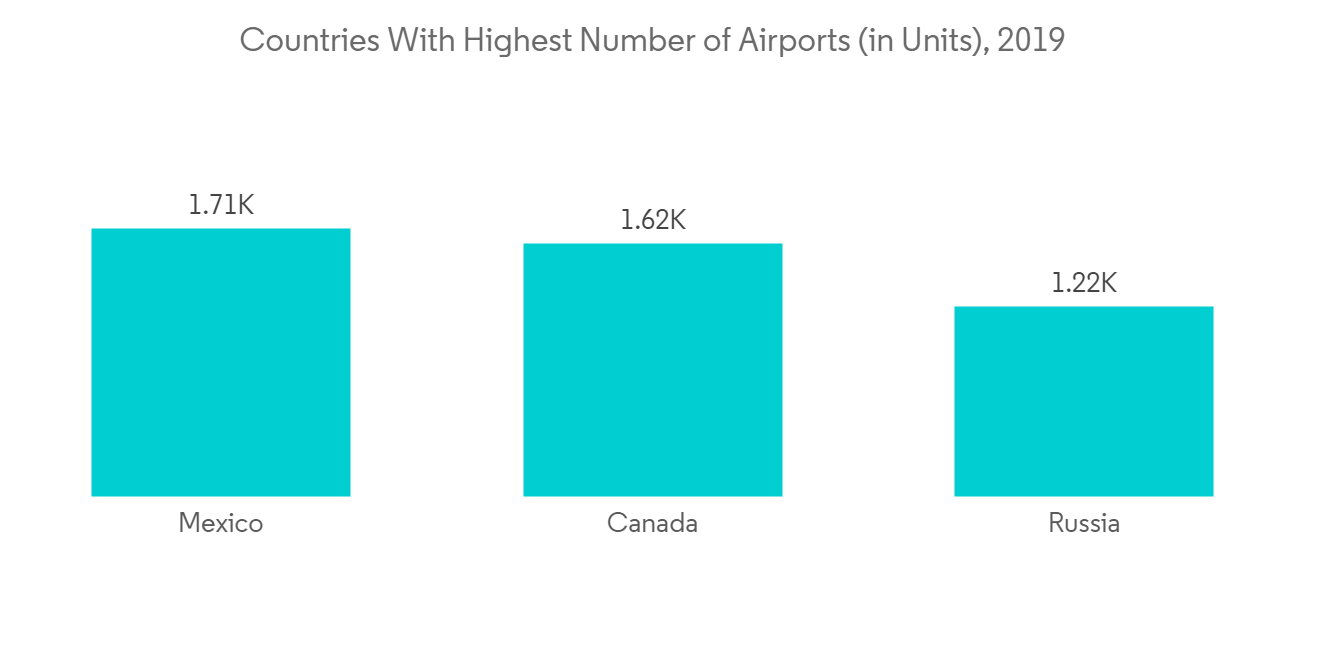
此外,空中交通量的增加、飛機系統現代化投資的增加以及航空領域研發支出的增加也在推動市場的增長。 根據國際航空運輸協會的一份報告,航空業在大流行之後出現了強勁復甦。 到2024年,航空旅客總數將達到40億人次。 報告稱,到2021年將是2019年水平的47%。 這將導致機場數量增加,從而產生對此類飛機系統和組件的需求
亞太地區預計在預測期內呈現最高增長
預計亞太地區在預測期內將出現顯著增長。 這一增長是由航空客運量增加、機場數量增加以及中國和印度等新興經濟體航空支出增加推動的。 在亞太地區,中國、印度、日本和新加坡等主要國家都在計劃新建或擴建現有機場。 機場的增加將導致對飛機零部件的需求增加,從而推動市場增長。
2020年2月,印度政府宣佈到2024年將新建100座機場。 這創造了對各種航空航天組件的需求,例如壓力表、溫度計、傳感器和其他系統。 此外,2022 年 6 月,印度聯邦民航部長宣佈到 2024-2025 年將增加 33 個貨運站。 可支配收入的增加、快速的城市化以及建設新機場的投資增加,因此增加了容納更多飛機的機會,從而導致對航空航天部件和系統的巨大需求,從而推動市場增長。
航天壓力表市場競爭者分析
航空航天壓力表市場本質上是分散的,其特點是有多家供應商提供各種類型的壓力表。 然而,航空航天壓力表市場的主要參與者包括 UMA Instruments、Ahlers Aerospace, Inc.、Alcor Inc.、Davtron Inc. 和 L3Harris Technologies, Inc. 等公司。 隨著行業內競爭的加劇,主要原始設備製造商專注於為航空業開發創新解決方案。
2022 年 10 月:Parker Meggitt 推出了 iPRESS,這是一種用於航空的遠程無線輪胎壓力計。 未來,我們計劃支持各種 Beechcraft 和 Cessna 產品。 這種新的壓力表使用無線輪胎壓力傳感器 (WTPS) 和新的輪胎壓力狀態功能來改善用戶在檢查壓力時的體驗。 因此,主要公司對創新技術的投資增加和研發支出的增加將推動預測期內的市場增長。
其他福利。
- Excel 格式的市場預測 (ME) 表
- 3 個月的分析師支持
內容
第一章介紹
- 調查先決條件
- 調查範圍
第二章研究方法論
第 3 章執行摘要
第四章市場動態
- 市場概覽
- 市場驅動力
- 市場製約因素
- 搬運工 5 力分析
- 新進入者的威脅
- 買家/消費者的議價能力
- 供應商的議價能力
- 替代品的威脅
- 競爭對手之間的競爭強度
第 5 章市場細分
- 按類型
- 模擬
- 數字
- 通過使用
- 商業航空
- 軍事航空
- 按地區
- 北美
- 美國
- 加拿大
- 歐洲
- 德國
- 英國
- 法國
- 俄羅斯
- 其他歐洲
- 亞太地區
- 印度
- 中國
- 日本
- 韓國
- 其他亞太地區
- 拉丁美洲
- 巴西
- 其他拉丁美洲地區
- 中東和非洲
- 阿拉伯聯合酋長國
- 沙特阿拉伯
- 南非
- 其他中東和非洲地區
- 北美
第六章競爭格局
- 供應商市場份額
- 公司簡介
- UMA Instruments
- Ahlers Aerospace Inc.
- L3Harris Technologies Inc.
- Davtron Inc.
- Alcor Inc.
- Flybox Avionics
- Howell Instruments Inc.
- Meggitt PLC
- Adams Aviation
- CIRCOR AEROSPACE PRODUCTS GROUP
第7章 市場機會與今後動向
The aerospace pressure gauge market is expected to grow at a CAGR of more than 3% during the forecast period.
The global aviation sector faced unmatched challenges due to the COVID-19 pandemic. The pandemic significantly affected the aviation sector, resulting in a drastic reduction in passenger traffic, which negatively affected demand for new aircraft. According to the International Civil Aviation Organization (ICAO) report, global airports have seen a 28.4% decline in global passenger traffic volumes for the first quarter of 2020. The aviation sector has witnessed significant recovery post-COVID-19 due to reduced restrictions and increased air traffic, which resulted in the growing demand for aircraft components.
Rising demand for new aircraft due to the growing number of air travelers creates demand for aircraft parts and components, which drives the market's growth. In an aircraft, the number of instruments informs the pilot about the aircraft's condition and flight situations through measuring pressure. The pressure-sensing instruments are installed in the flight group and the engine group. These components can be either remote sensing or direct reading. These are the most critical instruments on the aircraft and accurately inform the pilot to maintain safe operations.
An increase in demand for new aircraft and growing investment in aircraft modernization programs drive market growth. There are different types of pressure gauges, such as fuel pressure gauges, hydraulic pressure gauges, manifold pressure gauges, oil pressure gauges, and others used in an aircraft. An aircraft fuel pressure gauge is a device that measures and reports the quantity of fuel remaining in a vehicle's tank(s). thus, the growing expansion of the aviation sector will drive market growth in the coming years.
Aerospace Pressure Gauge Market Trends
Digital Pressure Gauge Will Showcase Significant Growth During the Forecast Period
The digital pressure gauges segment is estimated to have remarkable growth during the forecast period. These are used to convert the pressure to an electronic signal. The gauge shows the pressure using a digital display, furthermore, the signal can be used to control equipment. Newbow Aerospace launched an innovative range of digital tyre pressure checking gauges that are calibrated to an accuracy of +/-0.4% FS. Thus, growing investments in developing such innovative products propel market growth.
Furthermore, growing air traffic, rising investment in aircraft systems modernization, and growing spending on research and development in aviation boost the market growth. According to the International Air Transport Association report, the aviation sector witnessed a strong recovery after the pandemic. The overall number of air passengers will reach 4.0 billion by 2024. The report stated that in 2021, the numbers were 47% of 2019 levels. This leads to the growing number of airports which creates demand for such aircraft systems and components

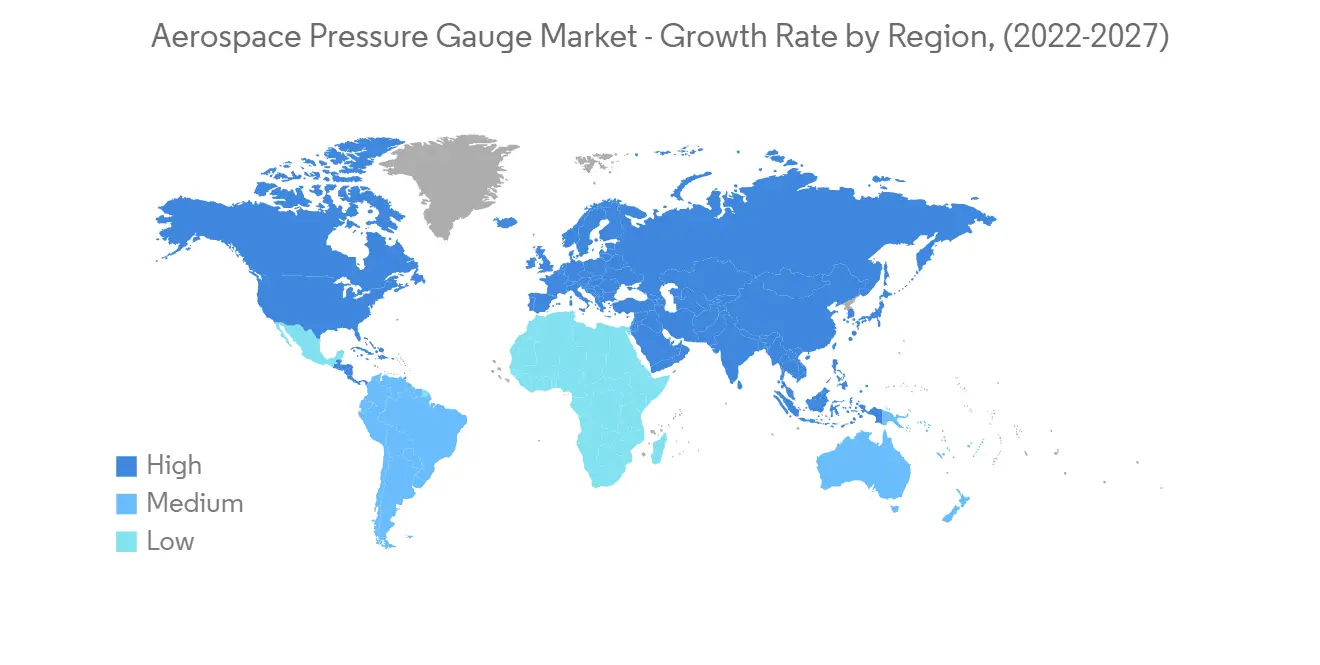
Asia Pacific is Projected to Show Highest Growth During the Forecast Period
Asia-Pacific is projected to show remarkable growth during the forecast period. The growth is due to a rising number of air passengers, a growing number of airports, and increasing expenditure on the aviation sector from emerging economies such as China and India. In Asia-Pacific, major countries like China, India, Japan, and Singapore are planning to construct new airports and expand the existing airports. An increasing number of airports leads to rising demand for aircraft components, thus driving the growth of the market.
In February 2020, the Indian government announced that 100 new airports would be built by 2024. This will create demand for various aerospace components such as pressure gauges, temperature gauges, sensors, and other systems. Furthermore, in June 2022, the Union Civil Aviation Minister of India announced that the country will have 33 additional cargo terminals by 2024-2025. Thus, rising disposable income, rapid urbanization, and growing investment in constructing new airports will improve the opportunities to accommodate a higher number of aircraft and consequently lead to a huge demand for aerospace parts and systems, driving the market's growth.
Aerospace Pressure Gauge Market Competitor Analysis
The market of aerospace pressure gauges is fragmented in nature and is characterized by several suppliers who provide various types of pressure gauges. However, some of the prominent players in the aerospace pressure gauge market are UMA Instruments, Ahlers Aerospace, Inc., Alcor Inc., Davtron Inc., L3Harris Technologies, Inc., and others. With the growing competition in the industry, the key OEMs are focusing on the development of innovative solutions for the aviation sector.
October 2022: Parker Meggitt launched a long-range wireless tire pressure gauge for aviation, iPRESS. It will be available for a range of Beechcraft and Cessna products in the coming days. The new gauge will deliver an enhanced user experience while verifying inflation pressure through the use of a Wireless Tire Pressure Sensor (WTPS) and a new tire pressure status feature. Thus, rising investment in innovative technologies and increased spending on research and development from key players will boost market growth during the forecast period
Additional Benefits:
- The market estimate (ME) sheet in Excel format
- 3 months of analyst support
TABLE OF CONTENTS
1 INTRODUCTION
- 1.1 Study Assumptions
- 1.2 Scope of the Study
2 RESEARCH METHODOLOGY
3 EXECUTIVE SUMMARY
4 MARKET DYNAMICS
- 4.1 Market Overview
- 4.2 Market Drivers
- 4.3 Market Restraints
- 4.4 Porters 5 Force Analysis
- 4.4.1 Threat of New Entrants
- 4.4.2 Bargaining Power of Buyers/Consumers
- 4.4.3 Bargaining Power of Suppliers
- 4.4.4 Threat of Substitute Products
- 4.4.5 Intensity of Competitive Rivalry
5 MARKET SEGMENTATION
- 5.1 By Type
- 5.1.1 Analog
- 5.1.2 Digital
- 5.2 By Application
- 5.2.1 Commercial Aviation
- 5.2.2 Military Aviation
- 5.3 By Geography
- 5.3.1 North America
- 5.3.1.1 United States
- 5.3.1.2 Canada
- 5.3.2 Europe
- 5.3.2.1 Germany
- 5.3.2.2 United Kingdom
- 5.3.2.3 France
- 5.3.2.4 Russia
- 5.3.2.5 Rest of Europe
- 5.3.3 Asia Pacific
- 5.3.3.1 India
- 5.3.3.2 China
- 5.3.3.3 Japan
- 5.3.3.4 South Korea
- 5.3.3.5 Rest of Asia Pacific
- 5.3.4 Latin America
- 5.3.4.1 Brazil
- 5.3.4.2 Rest of Latin America
- 5.3.5 Middle East and Africa
- 5.3.5.1 United Arab Emirates
- 5.3.5.2 Saudi Arabia
- 5.3.5.3 South Africa
- 5.3.5.4 Rest of Middle East and Africa
- 5.3.1 North America
6 COMPETITIVE LANDSCAPE
- 6.1 Vendor Market Share**
- 6.2 Company Profiles*
- 6.2.1 UMA Instruments
- 6.2.2 Ahlers Aerospace Inc.
- 6.2.3 L3Harris Technologies Inc.
- 6.2.4 Davtron Inc.
- 6.2.5 Alcor Inc.
- 6.2.6 Flybox Avionics
- 6.2.7 Howell Instruments Inc.
- 6.2.8 Meggitt PLC
- 6.2.9 Adams Aviation
- 6.2.10 CIRCOR AEROSPACE PRODUCTS GROUP


