


 |
市場調查報告書
商品編碼
1156143
主要照明廠商世界100家公司的財務分析 - 資料庫和摘要整理Financial Analysis of 100 Major Lighting Manufacturers Worldwide - Database and Executive Summary |
||||||
由於貿易摩擦與地緣政治學不穩定從2019年開始穩步下降,2020年的COVID-19危機之後,2021年照明部門大幅度恢復。
2021年的銷售額,除了平均銷售額縮小了5%的小企業,在全部的規模等級記錄了增加。僅大企業分類的群組,從2017年到2021年趨勢正向,同時2021年的結果是2位數。
整體樣本調查:各照明市場區隔企業數,
企業規模,地區
本報告提供主要照明廠商世界100家公司的財務分析,照明部門的業績,600家公司的資產負債表的主要財務資料,銷售成長率指標,盈利,財務結構,僱用,生產率,各市場區隔、地區的分析等資訊。
本報告刊載的企業
Acuity Brands(美國),AEC(義大利),Alto(韓國),Arkoslight(西班牙),Artemide(義大利),Bega(比利時),Bisong Lighting(中國),Catellani & Smith(義大利),Celsa(哥倫比亞),Delta Light(比利時),Dextra Group(英國),Eclatec(法國),Eglo(奧地利),Endo Lighting(日本),EXC-LED Technology(中國),Fagerhult(SE),Flos(義大利),FSL(中國),Gewiss(義大利),GMR Enlights(義大利),Haoyang(中國),Hella(德國),Hubbell(美國),Intra Lighting(斯洛維尼亞),Inventronics(中國),Iwasaki(日本),Koito Manufacturing(日本),Lamplast Finanziaria(義大利),LEDs C4(西班牙),Leedarson(中國),Lightnet(波蘭),Lighting and Urban Equipment(越南),Ligman(泰國),Lival(芬蘭),Lombardo(義大利),Louis Poulsen(丹麥),LSI(美國),Luceco(英國),Maltani(韓國),MK Illumination(斯洛伐克),MLS(中國),Molto Luce(奧地利),Nemo(義大利),Nowodworski(波蘭),Ocean's King Lighting(中國),O Luce(義大利),Opple(中國),Pars Shahab(IR),Performance In Lighting(義大利),PUK Italia(義大利),Ragni(法國),Rangdong(越南),Reggiani(義大利),Roy Alpha(哥倫比亞),Schreder(比利時),SG Armaturen(挪威),Signify(荷蘭),Simes(義大利),Sunway Opto-Electronic(中國),Thorpe(英國),Topmet(波蘭),Ushio(日本),Viabizzuno(義大利),Vizulo(立陶宛),Wever & Ducre(比利時),Wooree(韓國),Xal(奧地利),Zumtobel(奧地利)
目錄
摘要整理
第1章 樣本的選擇,調查手法,及定義
第2章 照明部門的成果
- 總樣本分析:主要財務資料,盈利與結構的比率,僱用與生產率(2017年~2021年),總合價值和平均值
第3章 各地區分析
- 總照明部門:主要財務資料和比率(2017年~2021年),下個每個地區合計值和平均值
- 歐洲
- 日本和韓國
- 中國
- 亞太地區
- 美國
第4章 照明各市場區隔分析
- 主要財務與資料比率(2017年~2021年),下面的照明各市場區隔總合價值和平均值
- 照明設備
- 照明零件
- 汽車照明
第5章 各企業規模分析
- 總照明部門:主要財務資料和比率(2017年~2021年),各企業規模合計值和平均值
- 超大企業(2021年的銷售額:10億美元以上)
- 大企業(2021年的銷售額:1億美元以上不滿10億美元)
- 中規模企業(2021年的銷售額:1,000萬美元以上不滿1億美元)
- 中小企業(2021年的銷售額:不滿1,000萬美元)
第6章 同類中的翹楚企業:大企業
- 照明部門的同類中的翹楚企業(大企業):主要財務與資料比率(2017年~2021年),總合價值和平均值
- 照明部門的同類中的翹楚企業(大企業):各主要財務與資料比率,盈利和財務結構的指標,各企業勞動指標(2021年),各營業收益排行榜
第6章b 同類中的翹楚企業:中小企業
- 照明部門的同類中的翹楚企業(中小企業):主要財務與資料比率(2017年~2021年),總合價值和平均值
- 照明部門的同類中的翹楚企業(中小企業):各主要財務與資料比率,盈利和財務結構的指標,各企業勞動指標(2021年),各營業收益排行榜
第7章 對建築及戶外企業的關注
- 建築及室外照明的主要企業:主要財務與資料比率(2017年~2021年),總合價值和平均值
- 各主要財務與資料比率,盈利和財務結構的指標,各企業的勞動指標(2021年),各營業收益排行榜
附錄:600家公司的清單:各財務資料,網站,證券交易所索引,持有資料
The report “Financial Analysis of 100 Major Lighting Manufacturers Worldwide”, now at its third edition, is the result of CSIL processing of a dataset made up of a large number of balance sheets (600 companies, for the period 2017-2021), including lighting fixtures, lighting components and lighting automotive manufacturers.
The purpose of this study is to assess the recent trends and structural characteristics of the lighting industry through the analysis of the balance sheets for the years 2017 to 2021 of a group of around 600 companies based worldwide and to identify, among them, the top 100 performing companies in the business. Top 100 players are reported separately as Big (over 50 million USD turnover) and Small players. In addition, a focus on the financial results of architectural and outdoor-oriented lighting companies is provided.
The total sample analysed, for which an homogeneous time series were available (approximately 500 companies), shows an average workforce of over 750 employees and an average turnover of over USD 158 million in 2021. In absolute terms, the industry exhibits a 2021 turnover of about USD 77 billion, an EBIT in excess of USD 5 billion, almost 365 employees.
The Report is made up by a short executive summary (around 50 pages) and an Excel database of company financial data and sector average.
The sample was selected according to the following criteria:
- availability of balance sheet data (consolidated and/or unconsolidated accounts);
- company turnover of over US$ 5 million in one of the years between 2017 and 2021;
- company's core activity corresponding to one of the following NACE codes 2740: Manufacture of electric lighting equipment.
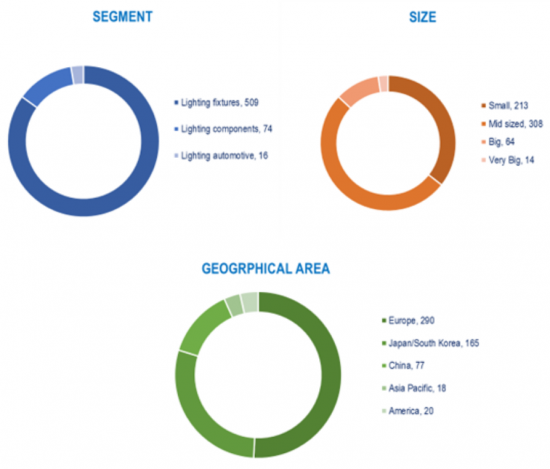
The sample of 600 companies analysed was broken down by geographical area, lighting segment, turnover range.
Sample by geographical area:
- 290 European companies
- 165 Japanese and South Korean companies
- 77 Chinese companies
- 18 Asian Pacific companies
- 20 American companies.
Sample by lighting segment:
- Lighting fixtures, 509 players
- Automotive Lighting, 16 players
- Lighting Components (semi-finished products, lighting sources), 74 manufacturers.
Sample by turnover range:
- 14 Very Big companies (Turnover 2021 over USD 1,000 million)
- 64 Big companies (Turnover 2021 over USD 100 million and under USD 1,000 million)
- 308 Mid-sized companies (Turnover 2021 over USD 10 million and under USD 100 million)
- 213 Small companies (Turnover 2021 below USD 10 million)
The analysis considers a selection of productivity/profitability indicators available from the balance sheets.
- Key financial data: Operating Revenue (Turnover), Added Value, P/L before Tax, Net Income, EBITDA, EBIT
- Turnover indicators: Total Assets, Shareholders Funds, Cash Flow
- Profitability ratios: Profit margin, ROE, ROA, EBITDA margin, EBIT margin
- Structure ratios: Current and Solvency ratio
- Employment data and per employee ratios: Number of Employees, Turnover per Employee, EBIT per employee, Average cost of employee, Costs of employees / Operating revenue.
Annexed Excel File containing:
- Financial tables on average lighting sector performance 2017-2021, based on the 600 companies' sample;
- Companies' "Best in Class" selected data (top 100 performing players in 2021, "Big" and "Small");
- Website, Stock Exchange reference, Holding data for 600 companies (when available);
- Operating revenue (Turnover) 2021, number of employees and EBITDA available for around 600 companies.
The report is structured as follows:
- Lighting sector performance. Analysis of Key financial data of 600 balance-sheet, for the period 2017-2021. Overview of the total sample in terms of turnover growth and turnover indicators, profitability, financial structure, employment, and productivity.
- Analysis by geographical area. This chapter breaks down the sample of 600 companies by five geographical area, highlighting key financial data and ratios for each area.
- Analysis by lighting segment. Each company is classified according to its core activity. The following Lighting segments are identified: Lighting Fixtures, Lighting Components, Automotive Lighting.
- Analysis by company size. The sample of 600 companies was broken down by five turnover ranges, ranging from less than USD 10 million, to over USD 1,000 million during the last available year.
- Analysis of the "best in class" companies. 100 companies were selected from the sample of 600 companies, grouped in "Best in Class" big players and "Best in Class" small players.
- Analysis of the Architectural and Outdoor companies. Performance analysis of a sample of 49 Architectural-oriented lighting companies and 35 Outdoor-oriented lighting companies.
Highlights:
Total Sample Survey: number of companies by lighting segment,
company size, geographic area
After a steady decline started in 2019, as a result of trade frictions and geopolitical instabilities, and confirmed in 2020 due the Covid-19 crisis, 2021 shows a massive recover for the lighting sector.
The profitability indicators describe a sector with positive but decreasing return.
EBITDA margin was around 7.5% in 2021.
The average turnover per employee is approximately USD 211,000, slightly increased over the last five years.
All the size class recorded increases in turnover in 2021 except for small companies, whose average turnover contracted by 5%. Only the group classified as Big Companies reported a positive 2017-2021 trend as well as a double-digit 2021 result.
The Architectural Lighting players are on average more profitable than the total sample, all the considered profitability indicators are almost twice the average ones. The Outdoor Lighting players are slightly more profitable than the average, as three out of five profitability indicators are above the sample average.
Selected Companies:
Acuity Brands (USA), AEC (IT), Alto (KR), Arkoslight (ES), Artemide (IT), Bega (BE), Bisong Lighting (CN), Catellani & Smith (IT), Celsa (CO), Delta Light (BE), Dextra Group (UK), Eclatec (FR), Eglo (AT), Endo Lighting (JP), EXC-LED Technology (CN), Fagerhult (SE), Flos (IT), FSL (CN), Gewiss (IT), GMR Enlights (IT), Haoyang (CN), Hella (DE), Hubbell (USA), Intra Lighting (SI), Inventronics (CN), Iwasaki (JP), Koito Manufacturing (JP), Lamplast Finanziaria (IT), LEDs C4 (ES), Leedarson (CN), Lightnet (PL), Lighting and Urban Equipment (VN), Ligman (TH), Lival (FI), Lombardo (IT), Louis Poulsen (DK), LSI (USA), Luceco (UK), Maltani (KR), MK Illumination (SK), MLS (CN), Molto Luce (AT), Nemo (IT), Nowodworski (PL), Ocean's King Lighting (CN), O Luce (IT), Opple (CN), Pars Shahab (IR), Performance In Lighting (IT), PUK Italia (IT), Ragni (FR), Rangdong (VN), Reggiani (IT), Roy Alpha (CO), Schreder (BE), SG Armaturen (NO), Signify (NL), Simes (IT), Sunway Opto-Electronic (CN), Thorpe (UK), Topmet (PL), Ushio (JP), Viabizzuno (IT), Vizulo (LT), Wever & Ducre (BE), Wooree(KR), Xal (AT), Zumtobel (AT).
TABLE OF CONTENTS
EXECUTIVE SUMMARY
1. SAMPLE SELECTION, METHODOLOGY AND DEFINITIONS
2. LIGHTING SECTOR PERFORMANCE
Total sample analysis: Key financial data, Profitability and Structure ratios, Employment and productivity, 2017-2021. Total and mean values
3. ANALYSIS BY GEOGRAPHICAL AREA
Total lighting sector. Key financial data and ratios, 2017-2021. Total and mean values by the following areas:
- Europe
- Japan and South Korea
- China
- Asia Pacific
- America
4. ANALYSIS BY LIGHTING SEGMENT
Key financial data and ratios, 2017-2021. Total and mean values by the following lighting segments:
- Lighting Fixtures
- Lighting Components
- Automotive Lighting
5. ANALYSIS BY COMPANY SIZE
Total lighting sector. Key financial data and ratios, 2017-2021. Total and mean values by company size:
- Very Big companies (turnover 2021 over 1000 USD million)
- Big companies (turnover 2021 over 100 million USD and under 1000 million USD)
- Mid-sized companies (turnover 2021 over 10 million USD and under 100 million USD)
- Small companies (turnover 2021 under 10 USD million)
6a. BEST IN CLASS COMPANIES: BIG PLAYERS
- Best in Class companies in the Lighting sector: Big players. Key financial data and ratios, 2017-2021. Total and mean values
- Best in Class companies in the Lighting sector: Big players. Selected key financial data and ratios, profitability and financial structure indicators, labour indicators by Company, 2021. Ranking by Operating revenue
6b. BEST IN CLASS COMPANIES: SMALL PLAYERS
- Best in Class companies in the Lighting sector: Small players. Key financial data and ratios, 2017-2021. Total and mean values
- Best in Class companies in the Lighting sector: Small players. Selected key financial data and ratios, profitability and financial structure indicators, labour indicators by Company, 2021. Ranking by Operating revenue
7. FOCUS ON ARCHITECTURAL AND OUTDOOR COMPANIES
- Top architectural and outdoor lighting players. Key financial data and ratios, 2017-2021. Total and mean values
- Selected key financial data and ratios, profitability and financial structure indicators, labour indicators by Company, 2021. Ranking by Operating revenue
ANNEX: LIST OF 600 COMPANIES: SELECTED FINANCIAL DATA, WEBSITE, STOCK EXCHANGE REFERENCE, HOLDING DATA
 中國的照明設備市場
 2024-2028年全球照明設備市場
 光污染最小化燈具 - 城市公園和公共區域、商業和工業照明、停車場、住宅外觀和道路應用:全球市場分析和預測,2023-2032 年
 照明設備市場,份額,市場規模,趨勢,產業分析報告:按產品,按光源,按應用,按分銷管道,按地區,按細分市場,預測2023-2032 年
 照明設備的美國市場
 照明燈具市場(類型:枝形吊燈;吊燈;天花板;壁燈;檯燈、落地燈和檯燈;以及其他;以及燈具類型:攜帶式和固定式)-全球行業分析、規模、佔有率、成長、趨勢和預測, 2023 -2031
 照明設備的歐洲市場
 智慧照明設備的全球市場:趨勢,機會,競爭分析(2023年~2028年)
 拉丁美洲的燈具市場
 照明設備的全球市場:LED、OLED照明的日益引進